AMPHENOL CORP /DE/: revenue accelerated to +65.1%, but the margin slipped slightly

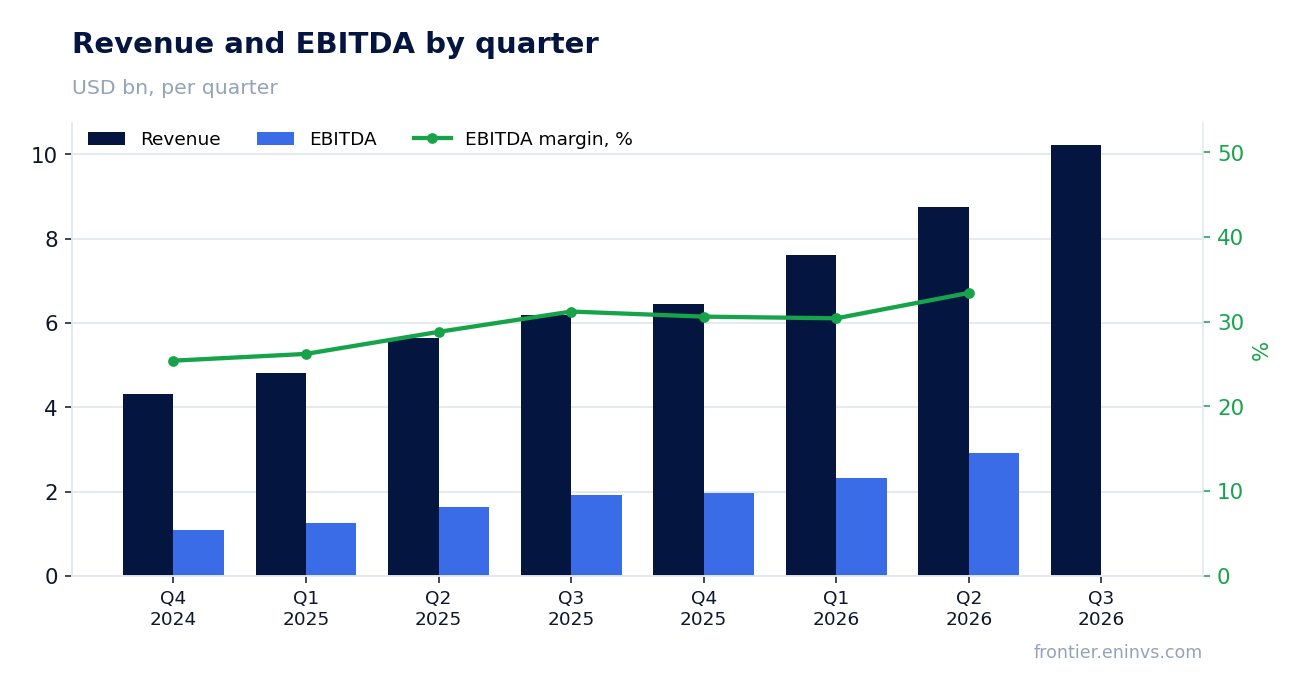
On 28 October AMPHENOL CORP /DE/ reported results for the third quarter of 2026. Revenue came in at USD 10,229.7 mn, operating profit at USD 3,020.8 mn and net profit at USD 2,034.3 mn. Year-on-year revenue growth accelerated to +65.1% from +55.0% a quarter earlier, while net profit rose 63.3%. At the same time, the net margin slipped to 19.9% from 20.1% a year earlier. The share looks rather attractive: the EV/EBITDA multiple of 23.8 is in line with its own three-year average, and the portal's model puts the upside to fair value at +31%.
Key takeaways
— Revenue rose 65.1% year on year, and the pace accelerated from +55.0% in the second quarter
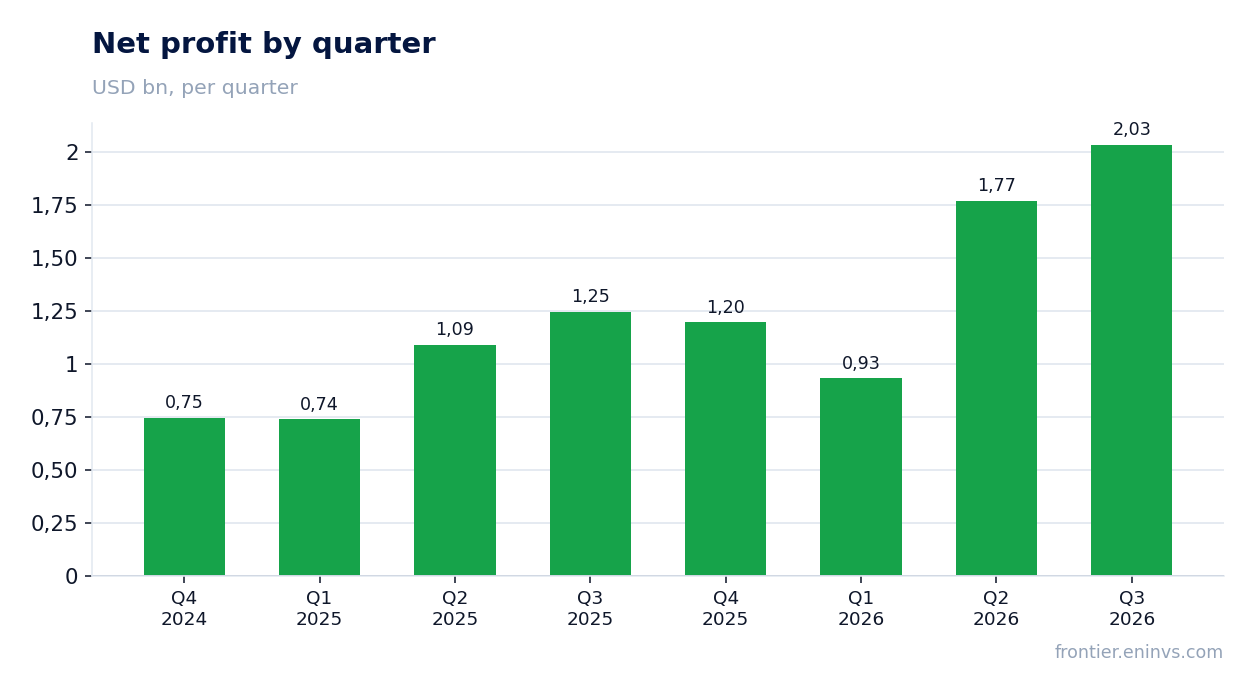
— The net margin slipped to 19.9% from 20.1%, even though profit grew 63.3%
— Operating cash flow for the quarter was USD 2,100.0 mn against net profit of USD 2,034.3 mn
— Leverage on the latest annual balance sheet was 0.45x LTM EBITDA
— EV/EBITDA of 23.8 is in line with its own three-year average of 24.4
— Trailing twelve-month dividend yield is 0.62%, modest for a growth story
— The portal's model implies +31% upside to fair value
Attractiveness
Key figures, USD bn
| Metric | Q3 2025 | Q3 2026 | Change |
|---|---|---|---|
| Revenue | 6.19 | 10.2 | +65.1% |
| EBITDA | 1.93 | — | — |
| Operating profit | 1.70 | 3.02 | +77.5% |
| Net profit | 1.25 | 2.03 | +63.3% |
| Operating cash flow | 1.47 | 2.10 | +42.8% |
| Capex | 0.26 | — | — |
| EBITDA margin | 31.2% | — | — |
| Net margin | 20.1% | 19.9% | -0.2 pp |
Revenue rose 65.1% year on year, and the pace accelerated from +55.0% in the second quarter
In the third quarter of 2026 revenue reached USD 10,229.7 mn, up 65.1% year on year. In the second quarter growth was 55.0%, so the pace accelerated. This is the second consecutive quarter with growth above 50%.
The acceleration rests on a large order base: quarterly revenue exceeded USD 10 bn for the first time. The company did not break out segment detail in the press release, so it is not possible to say which segment made the main contribution. But the very fact of acceleration on such a large base points to strong demand.
The net margin slipped to 19.9% from 20.1%, even though profit grew 63.3%
Net profit for the third quarter was USD 2,034.3 mn, up 63.3% year on year. Operating profit reached USD 3,020.8 mn. At the same time, the net margin declined to 19.9% from 20.1% in the third quarter of 2025.
A 0.2 percentage point decline in the margin against such revenue growth suggests costs are rising slightly faster than revenue. The press release does not disclose the specific cause – cost inflation, a shift in sales mix or one-off items. For a holder this is a signal that scaling is not yet delivering operating leverage in pure form.
Operating cash flow for the quarter was USD 2,100.0 mn against net profit of USD 2,034.3 mn
Operating cash flow in the third quarter was USD 2,100.0 mn, slightly above net profit of USD 2,034.3 mn. The excess is small, but it means profit is converting into cash rather than being tied up in working capital.
Over the trailing twelve months operating cash flow reached USD 6,543.7 mn. That is a stable base for funding capital expenditure and dividends. The company did not disclose capex for the third quarter, so free cash flow for the quarter cannot be assessed.
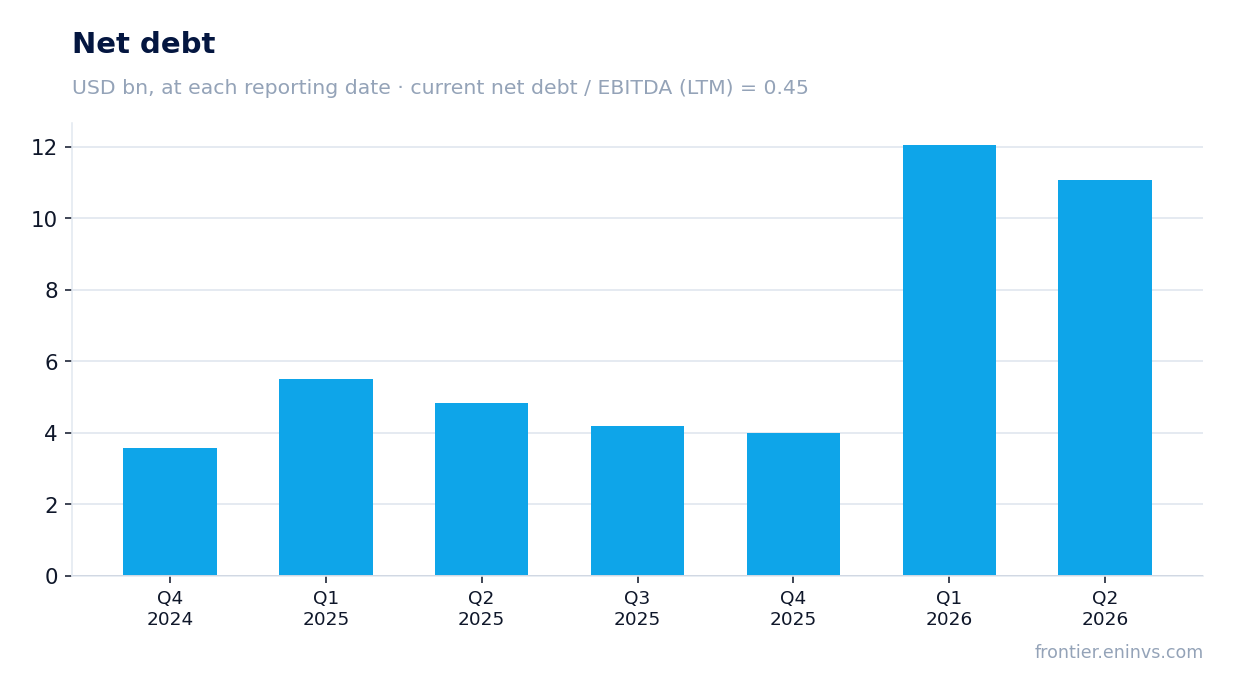
Leverage on the latest annual balance sheet was 0.45x LTM EBITDA
Net debt on the latest annual balance sheet is USD 3,999.9 mn, equivalent to 0.45x LTM EBITDA. That is a low leverage level for a company with such revenue momentum.
The net debt to EBITDA ratio is given as a level only; its direction of change is not in the facts. With LTM EBITDA of USD 8,848.7 mn, the cushion looks comfortable. Low leverage leaves room for further acquisitions or buybacks.
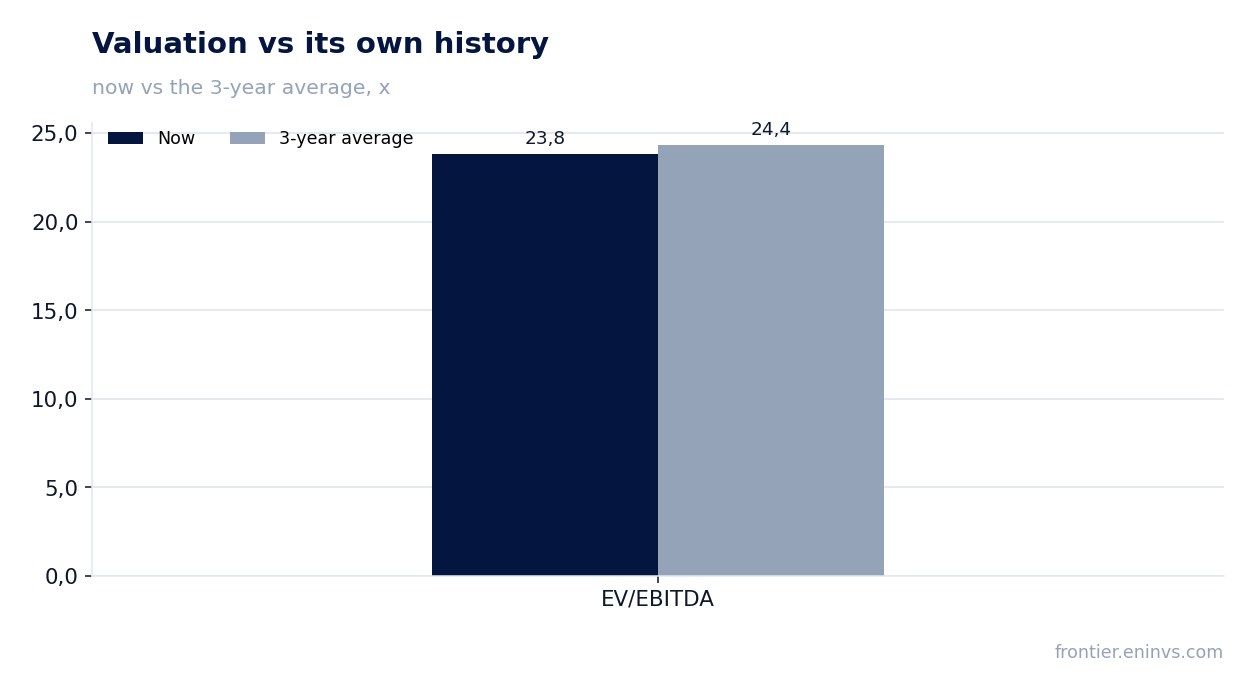
EV/EBITDA of 23.8 is in line with its own three-year average of 24.4
The LTM EV/EBITDA multiple is 23.8, 2% below its own three-year average of 24.4. That is neither cheap nor expensive relative to history – the market values the company roughly as it has on average over the past three years.
The LTM P/E is 34.9. With revenue growth of 65.1%, such a multiple looks justified if the pace holds. The portal's model puts the upside to fair value at +31%, which makes the share interesting for an investor willing to pay for growth.
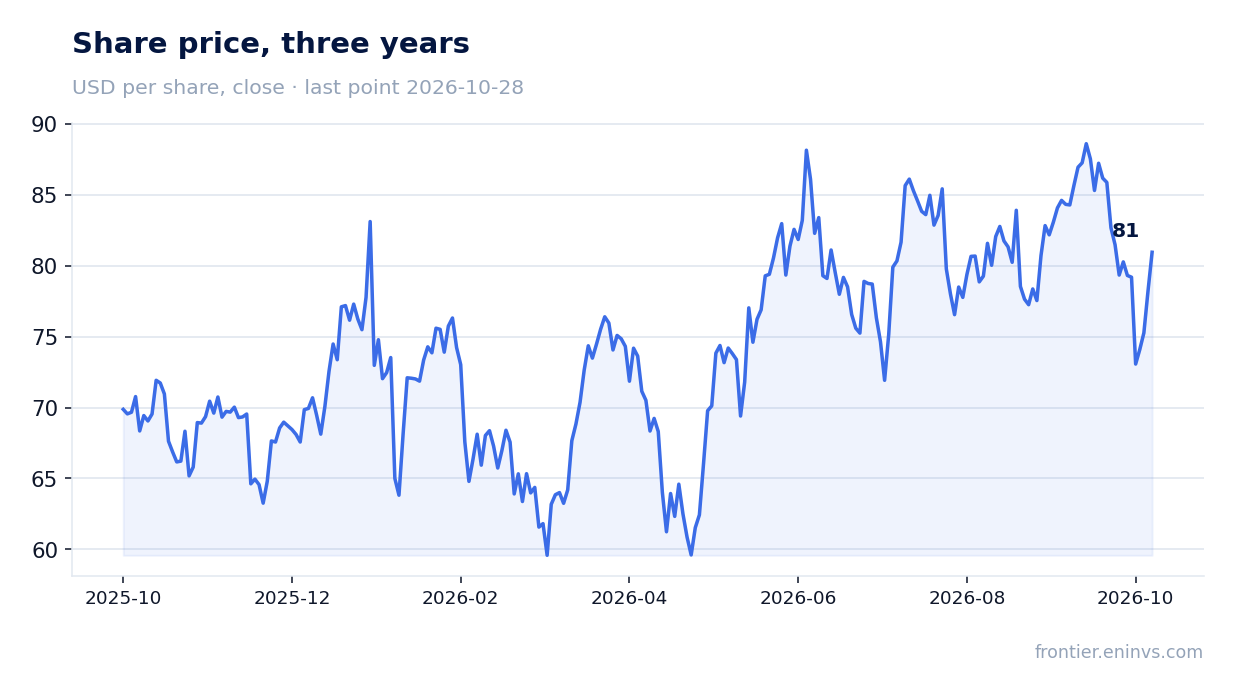
Trailing twelve-month dividend yield is 0.62%, modest for a growth story
The trailing twelve-month dividend yield is 0.62%. That is a low level, reflecting the priority of reinvesting profit into growth. The company pays dividends, but their size is insignificant relative to the share price.
With LTM net profit of USD 5,932.0 mn and a market capitalisation of USD 206,852.8 mn, the yield remains symbolic. For a holder the dividend is not an argument for buying – the main return should come from capital appreciation.
The portal's model implies +31% upside to fair value
According to the portal's model, which compares EBITDA growth with a target multiple and market capitalisation, fair value is 31% above the current price. This is our own estimate, not a market consensus or a target price.
The upside rests on sustaining high revenue and profit growth. If growth slows or the margin continues to decline, the estimate could prove too high. But with current multiples and low leverage, the room for growth looks sufficient.
Valuation on the latest reported figures
| Metric | Value |
|---|---|
| Market cap | 207 bn USD |
| P/E (LTM) | 34.9 |
| EV/EBITDA (LTM) | 23.8 |
| P/B | 15.42 |
| Net debt / EBITDA (LTM) | 0.45 |
| Operating cash flow (LTM) | 6.54 bn |
| ROE | 48.0% |
| Dividend yield (12m) | 0.6% |
| EV/EBITDA, 3-year average | 24.4 |
Bottom line
The strong side of the report is revenue acceleration to 65.1% and profit growth of 63.3% with low leverage of 0.45x EBITDA. The weak spot is the decline in the net margin to 19.9% and a modest dividend yield of 0.62%. The EV/EBITDA multiple of 23.8 is in line with its own three-year average, and the portal's model implies +31% upside. The share looks rather attractive for an investor willing to accept the risk of a growth slowdown.
Open the company's financial profile APH →
See also: market overview · valuation map · stock screeners