Antero Resources Corporation: profit up 4.3x, but the entire gain rests on gas prices, not volumes
On 28 October Antero Resources Corporation reported results for the third quarter of 2026. Revenue came in at USD 1,562.8 mn (+28.7% year on year), EBITDA at USD 633.0 mn (+106.2%) and net profit at USD 367.1 mn (+328.9%). The EBITDA margin rose to 40.5% from 25.3% a year earlier, while leverage over the trailing twelve months stands at 0.83x EBITDA. The share looks attractive: the EV/EBITDA multiple of 5.8 is more than twice below its own three-year average of 12.7, and profit is growing faster than revenue.
Key takeaways
— Revenue accelerated to +28.7% year on year, but the entire gain came from price, not volumes
— EBITDA doubled on revenue up 28.7% – the margin rose from 25.3% to 40.5%
— Net profit rose 4.3x, and this is no one-off: operating profit also tripled
— Debt fell from USD 4.6 bn on 30 June to USD 2.3 bn on 30 September
— Free cash flow for the quarter – USD 575.2 mn of operating cash flow against capex of about USD 300 mn
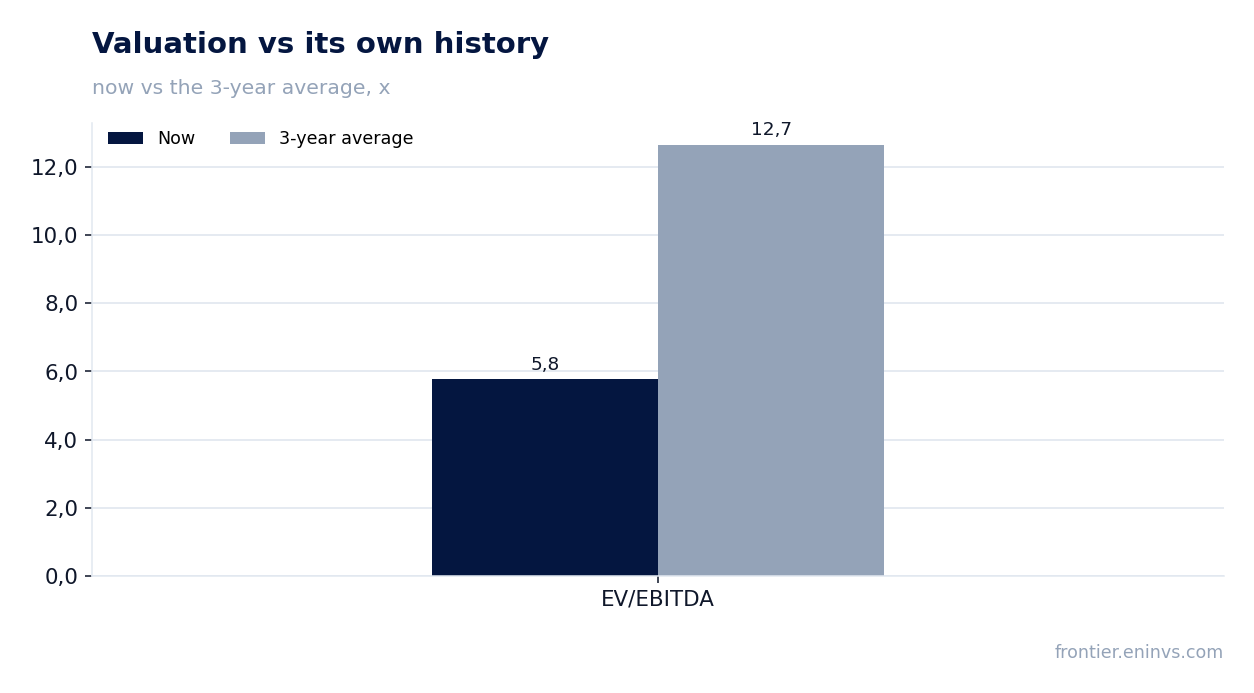
— EV/EBITDA of 5.8 against its own three-year average of 12.7 – the share is 54% cheaper than its history
— The portal's model implies minus 39% to fair value – the market has already priced in high gas prices
Attractiveness
Key figures, USD bn
| Metric | Q3 2025 | Q3 2026 | Change |
|---|---|---|---|
| Revenue | 1.21 | 1.56 | +28.7% |
| EBITDA | 0.31 | 0.63 | +106.2% |
| Operating profit | 0.12 | 0.39 | +231.7% |
| Net profit | 0.09 | 0.37 | +328.9% |
| Operating cash flow | 0.31 | 0.58 | +85.5% |
| Capex | 0.17 | — | — |
| EBITDA margin | 25.3% | 40.5% | +15.2 pp |
| Net margin | 7.1% | 23.5% | +16.4 pp |
Revenue accelerated to +28.7% year on year, but the entire gain came from price, not volumes
Revenue for the third quarter of 2026 came in at USD 1,562.8 mn, 28.7% above the same quarter a year earlier. Growth accelerated from 20.2% in the second quarter. The acceleration is almost entirely explained by the realised price of gas and condensate – production is flat, and the company is not growing volumes.
This structure makes the result sensitive to the market: if gas prices fall, revenue will shrink faster than if volumes were growing. The report gives no hedging data, so it is impossible to say how far the selling price is protected from spot swings.
For comparison: revenue grew 43.8% in the first quarter of 2026, 20.2% in the second and 28.7% in the third. The quarterly dynamics are uneven, but all three quarters show double-digit growth.
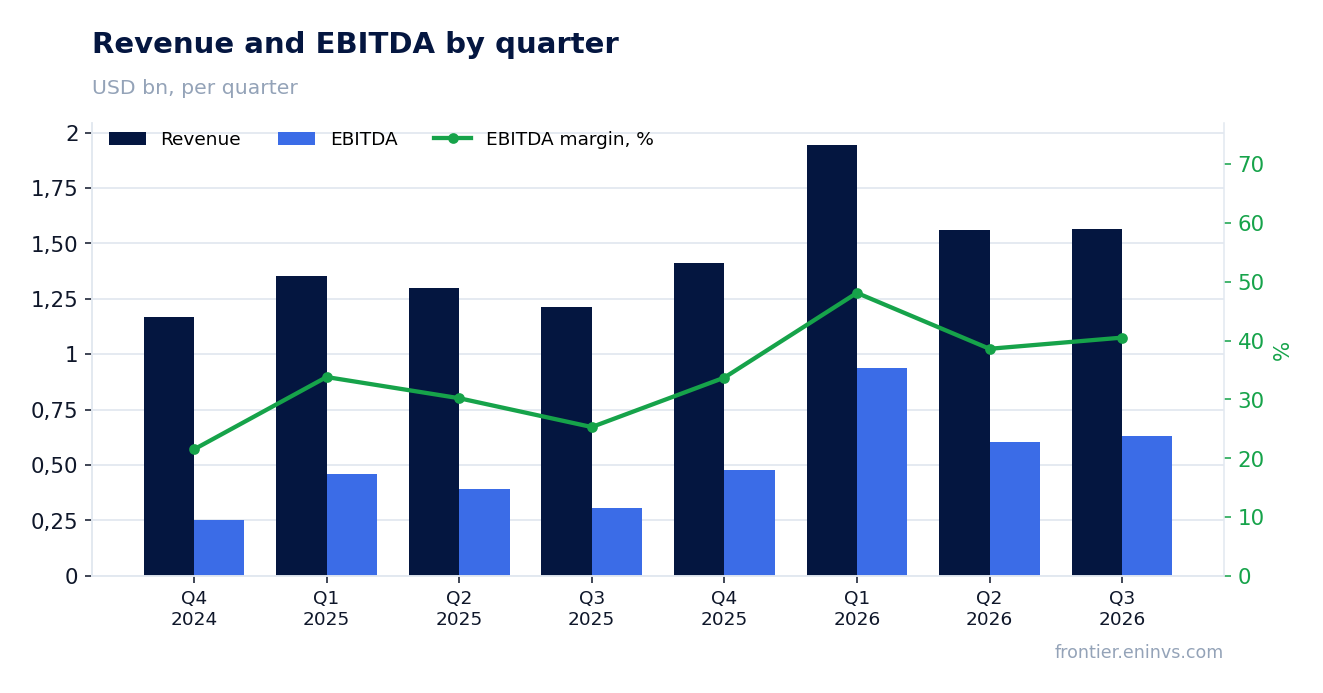
EBITDA doubled on revenue up 28.7% – the margin rose from 25.3% to 40.5%
EBITDA for the third quarter was USD 633.0 mn against USD 306.9 mn a year earlier – up 106.2%. With revenue up 28.7%, this means almost the entire revenue gain reached EBITDA: the margin rose from 25.3% to 40.5%.
Operating profit grew even faster – from USD 118.1 mn to USD 391.8 mn, 3.3x. This confirms that the profit growth is not driven by one-off items below the operating line: the core business has become several times more profitable.
A 40.5% margin is a high level for a gas company, but it rests on price. If gas prices fall, the margin will compress quickly because fixed costs will not shrink.
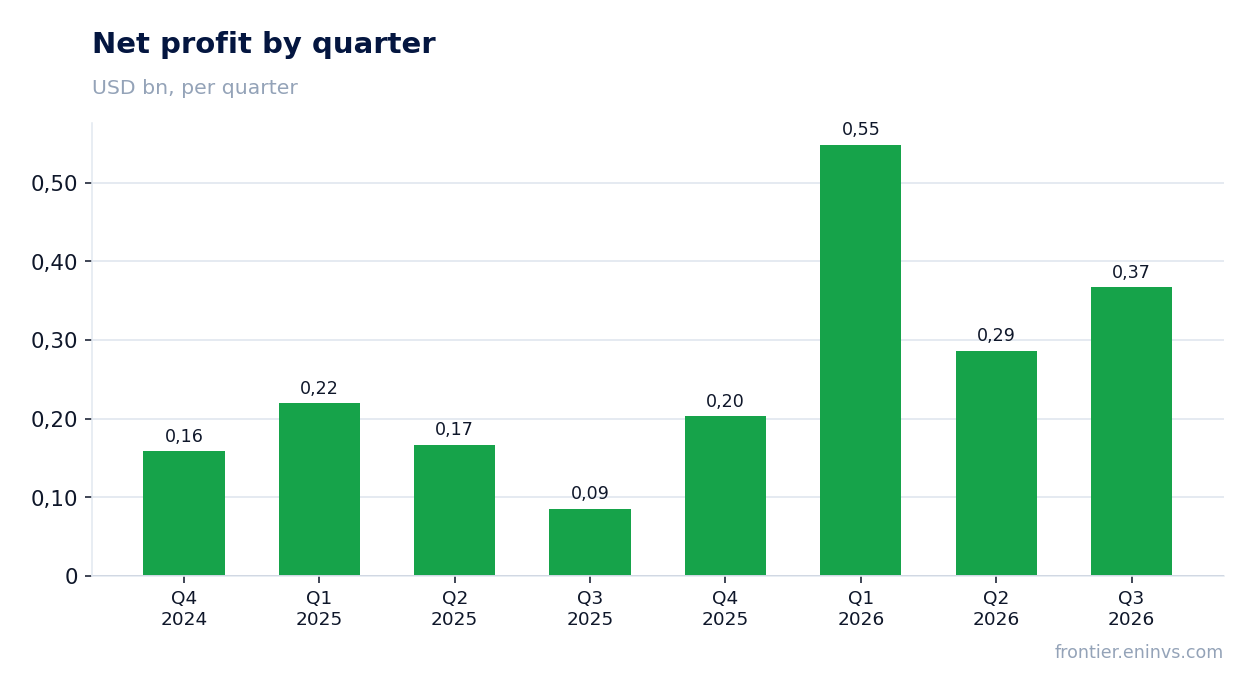
Net profit rose 4.3x, and this is no one-off: operating profit also tripled
Net profit for the third quarter was USD 367.1 mn against USD 85.6 mn a year earlier – up 328.9%. The net margin rose from 7.1% to 23.5%.
Profit growth tracks operating profit growth, so no one-off items explain the jump. The profit was earned by the core business, not by asset sales or revaluation.
Over the trailing twelve months net profit was USD 1,404.7 mn on revenue of USD 6,500.0 mn. That gives a P/E LTM of 9.2 – a low level for a company that has just tripled operating profit.
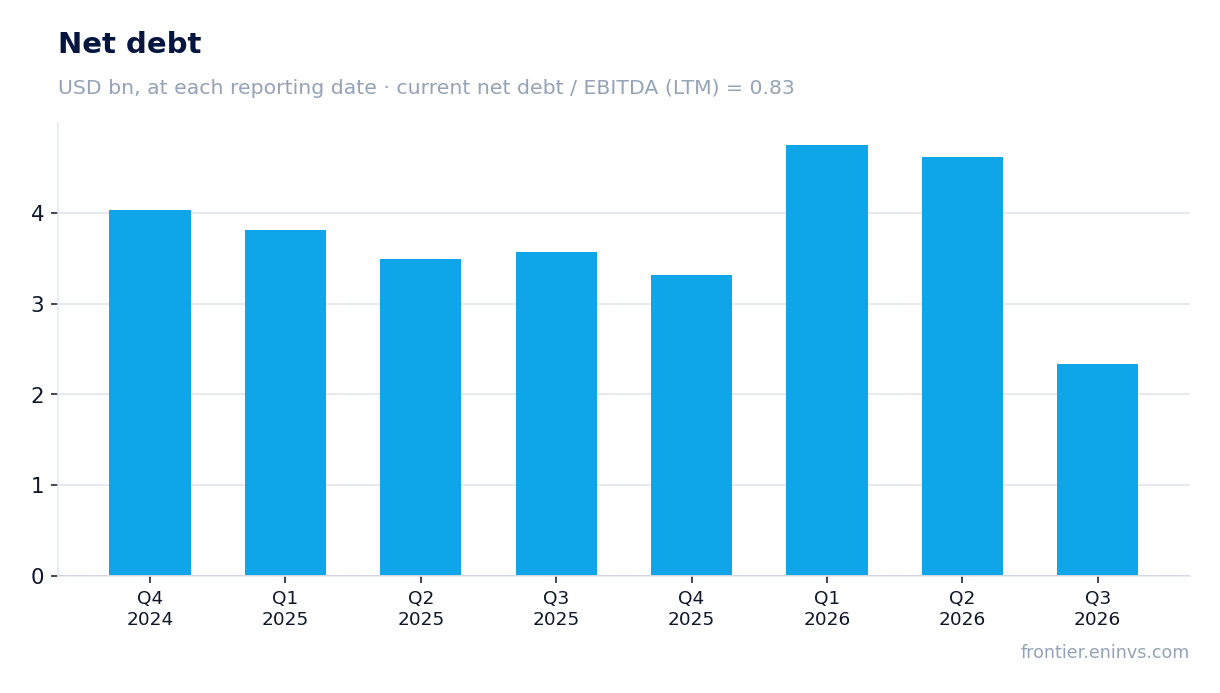
Debt fell from USD 4.6 bn on 30 June to USD 2.3 bn on 30 September
Net debt on 30 September 2026 was USD 2,330.8 mn against USD 4,615.3 mn on 30 June – a reduction of USD 2.3 bn in the quarter. A year earlier, on 30 September 2025, debt stood at USD 3,570.2 mn, so over twelve months it fell by USD 1.2 bn.
The debt reduction was funded by operating cash flow: the company generated USD 575.2 mn of operating cash flow in the quarter. The ratio of net debt to EBITDA over the trailing twelve months is 0.83 – a low level that leaves room to absorb a price decline.
Interest expense is not disclosed separately in the report, but at this level of debt it should not weigh heavily on profit.
Free cash flow for the quarter – USD 575.2 mn of operating cash flow against capex of about USD 300 mn
Operating cash flow for the third quarter was USD 575.2 mn – more than net profit, which is typical for a company with high depreciation. Capex for the quarter is not disclosed, but in the second quarter it was USD 312.1 mn, and if the third quarter is close to that level, free cash flow remains solid.
Over the trailing twelve months operating cash flow was USD 2,243.9 mn. That is enough to fund capex and reduce debt without raising new capital.
The company pays no dividends – the facts show no payouts, and the report does not mention them. All free cash flow goes to debt reduction and possibly buybacks, although the facts say nothing about buybacks.
EV/EBITDA of 5.8 against its own three-year average of 12.7 – the share is 54% cheaper than its history
The EV/EBITDA multiple over the trailing twelve months is 5.8 against its own three-year average of 12.7. The share trades 54% below its historical valuation. P/E LTM is 9.2, also low for a company with growing profit.
This valuation reflects the market's expectation that high gas prices will not last. If profit returns to last year's level, the current multiple will not look so low. But even under a conservative scenario there is room.
Market capitalisation is USD 12,933.0 mn, and enterprise value including debt is about USD 15.3 bn. With EBITDA of USD 2,818.5 mn over twelve months, that gives EV/EBITDA of 5.8.
The portal's model implies minus 39% to fair value – the market has already priced in high gas prices
On the portal's model, which reprices EBITDA at current commodity prices and a target EV/EBITDA, the share is valued at 39% above fair value. This is the portal's own calculation, not a market consensus.
The gap is explained by the model using current gas prices, which may prove higher than sustainable. If prices stay at current levels, the share looks expensive; if they fall, profit will shrink and the current valuation will not look so low.
For an investor this means the main risk is not debt or liquidity but the gas price. At EV/EBITDA of 5.8 the market is already pricing in lower prices, but the portal's model says not enough.
Valuation on the latest reported figures
| Metric | Value |
|---|---|
| Market cap | 12.9 bn USD |
| P/E (LTM) | 9.2 |
| EV/EBITDA (LTM) | 5.8 |
| P/B | 1.71 |
| Net debt / EBITDA (LTM) | 0.83 |
| Operating cash flow (LTM) | 2.24 bn |
| ROE | 17.3% |
| EV/EBITDA, 3-year average | 12.7 |
Bottom line
The quarter was exceptionally strong: revenue rose 28.7%, EBITDA doubled, net profit rose 4.3x, and debt fell by USD 2.3 bn in three months. All this strength rests on the gas price, not volumes, and the price will determine whether profit holds. Leverage of 0.83x EBITDA provides a cushion, and an EV/EBITDA of 5.8 against a historical average of 12.7 suggests the market is already pricing in lower prices. The portal's model, however, shows minus 39% to fair value, meaning the share may be expensive even at current prices. The verdict is attractive: the low valuation and strong balance sheet outweigh the gas price risk, but that risk remains the main one.
Open the company's financial profile AR →
See also: market overview · valuation map · stock screeners