Alexandria Real Estate: the $637.7m loss is a write-down, not an operating collapse, but revenue has fallen for six straight quarters
On 26 October Alexandria Real Estate Equities reported results for the third quarter of 2026. Revenue was $671.2m, down 10.7% year on year, the net loss was $637.7m, operating cash flow was $341.8m and net debt at 30 September stood at $12.4bn. The loss is almost entirely explained by a $637.9m impairment on assets held for sale, not by operations. At the current price the share looks neutral: a strong balance sheet and a 6.1% dividend yield are offset by falling revenue and declining occupancy.
Key takeaways
— The $637.7m loss is a $637.9m write-down on assets held for sale, not an operating collapse
— Revenue has fallen for six straight quarters, but the pace of decline slowed from 13.0% to 10.7%
— Occupancy of 87.1% drags NOI down: the same property pool lost 6.7% of operating profit
— Debt of $12.4bn against $4.6bn of liquidity and an 11.6-year maturity profile leaves room for manoeuvre
— The $0.72 dividend yields 6.1% on a payout of just 47% of FFO
— Leasing of 1.2m sq ft in the quarter is the best since Q4 2024, but renewal rates are still below prior levels
Attractiveness
Key figures, USD bn
| Metric | Q3 2025 | Q3 2026 | Change |
|---|---|---|---|
| Revenue | 0.75 | 0.67 | -10.7% |
| EBITDA | 0.16 | — | — |
| Operating profit | 0.13 | — | — |
| Net profit | -0.23 | -0.64 | — |
| Operating cash flow | 0.43 | 0.34 | -21.1% |
| Capex | 0.00 | — | — |
| EBITDA margin | 21.2% | — | — |
| Net margin | -31.0% | -95.0% | -64.0 pp |
The $637.7m loss is a $637.9m write-down on assets held for sale, not an operating collapse
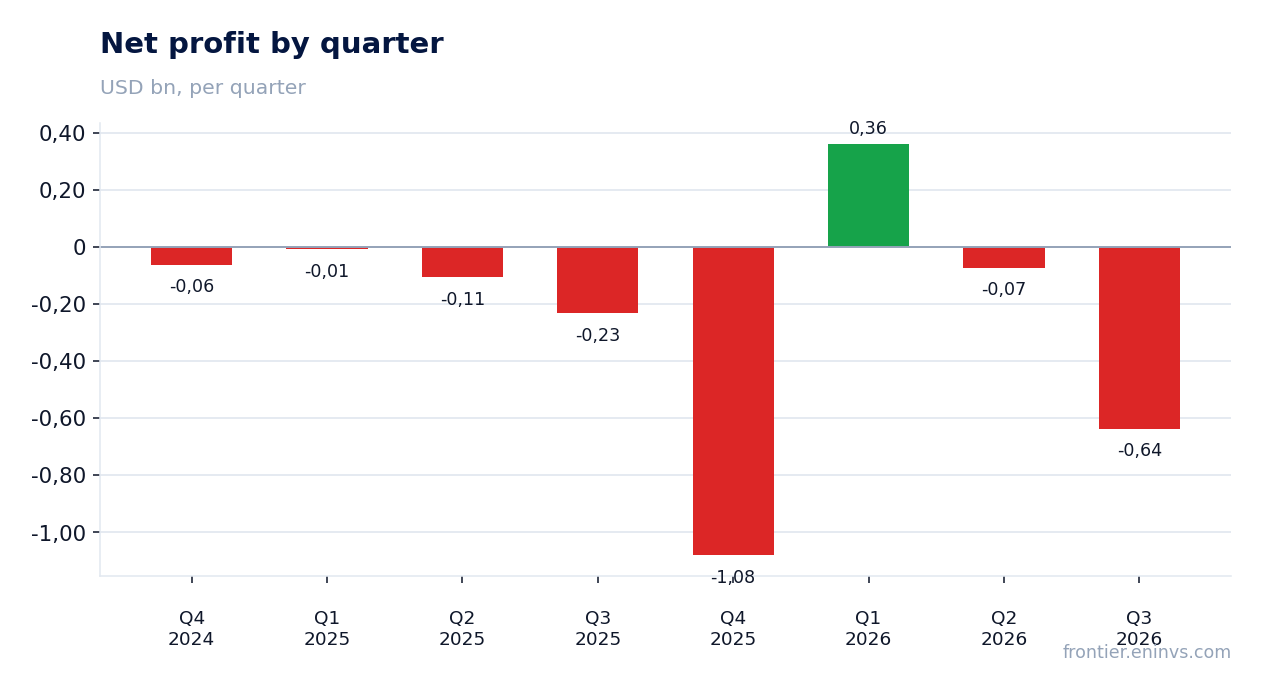
The net loss for the third quarter of 2026 was $637.7m against $232.8m a year earlier. Almost the entire amount is a $637.9m impairment on assets held for sale disclosed in the report. Without this one-off item the quarter would have been close to break-even.
Operations remain profitable: operating cash flow for the quarter was $341.8m and $1,187.8m for the trailing twelve months. Adjusted FFO per share was $1.54 against $2.22 a year earlier – a 31% decline, but still positive.
The impairment is tied to the decision to sell 421 Park Drive in Boston and the Stanford project, which the company classified as held for sale at 30 September. The 421 Park Drive sale is expected to close in the fourth quarter and cut future construction spending by about $136m.
Revenue has fallen for six straight quarters, but the pace of decline slowed from 13.0% to 10.7%
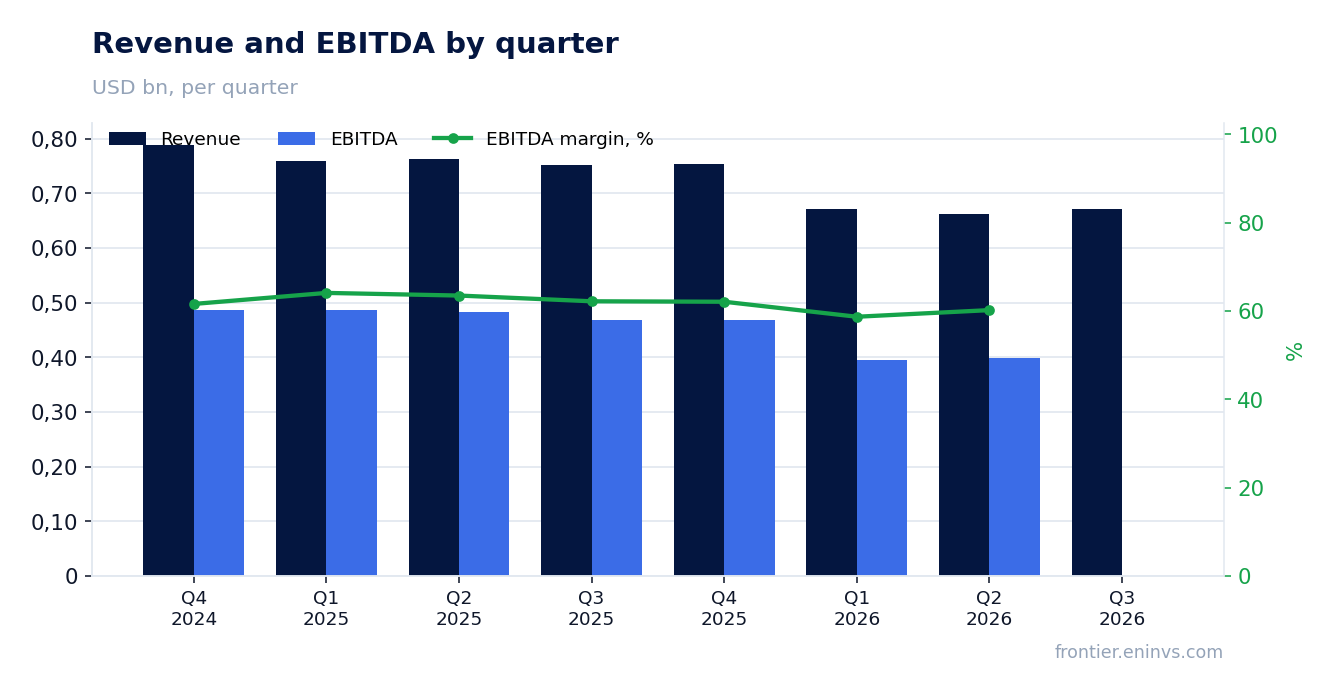
Third-quarter 2026 revenue was $671.2m, 10.7% below a year earlier. This is the sixth consecutive quarterly decline: the fall was 4.4% in Q4 2025, 11.5% in Q1 2026 and 13.0% in Q2. The narrowing from 13.0% to 10.7% is the first sign of stabilisation, but growth is still some way off.
Trailing-twelve-month revenue was $2,800.0m. The decline comes from asset disposals and falling occupancy: the company is selling non-core properties and losing tenants at some assets. Quarterly revenue has stayed in a narrow $662–671m range for three quarters running.
The company reaffirmed year-end 2026 occupancy guidance of 86.2–87.8% and same-property NOI decline guidance of 8.5–10.5%. Management does not expect the trend to reverse before 2027.
Occupancy of 87.1% drags NOI down: the same property pool lost 6.7% of operating profit
Occupancy of operating properties at 30 September was 87.1%, or 90.8% including signed but not yet commenced leases. A year earlier same-property average occupancy was 91.7%, now 88.1%. The 3.6 percentage-point gap explains most of the 6.7% same-property NOI decline.
The company names the cause: large leases totalling 282,878 sq ft expired in the third quarter and 1.2m sq ft over nine months, and some space is still vacant. At the same time 1.3m sq ft is already leased but not yet occupied – this will add 3.7 pp to occupancy and about $52m of annual rental revenue, on average by June 2027.
Renewal rents are falling: down 2.4% in the third quarter and 5.1% over nine months. Even as occupancy recovers, revenue per square foot will be lower than under the old contracts.
Debt of $12.4bn against $4.6bn of liquidity and an 11.6-year maturity profile leaves room for manoeuvre
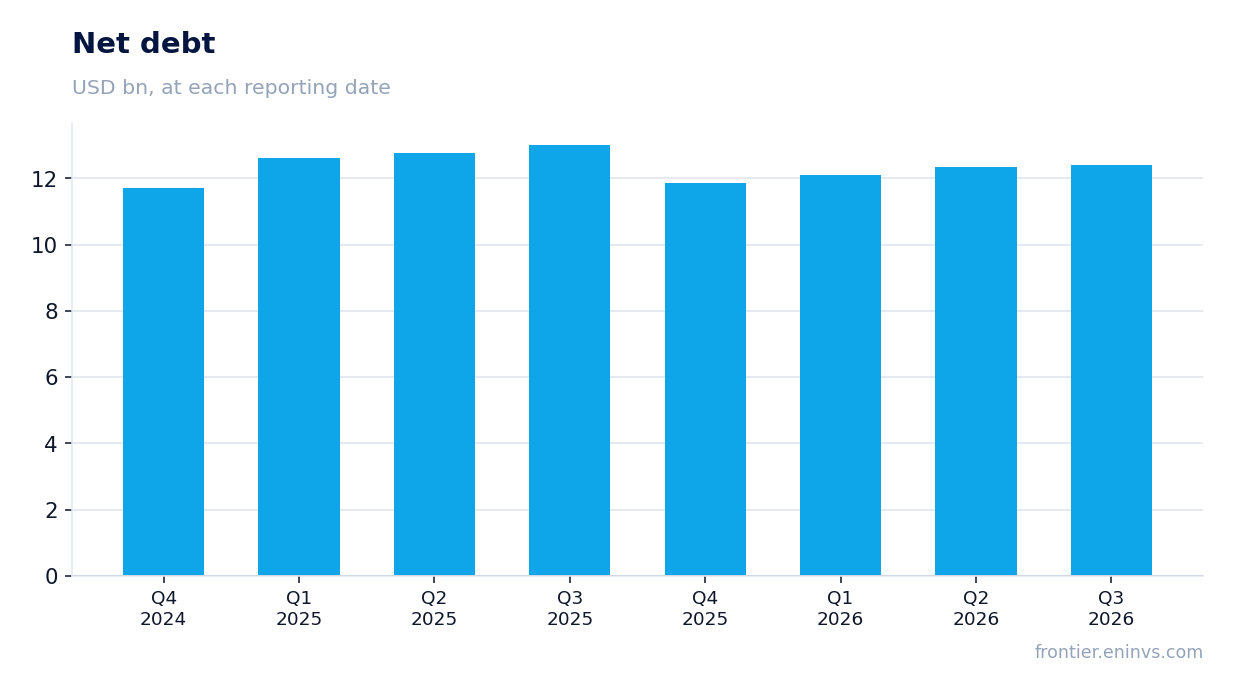
Net debt at 30 September 2026 was $12.4bn against $13.0bn a year earlier and $12.3bn at 30 June. Over the year debt fell by $0.6bn; over the quarter it rose by $0.0bn. The company holds $4.6bn of liquidity and extended its $5.0bn credit line to 2032.
The weighted-average remaining debt term is 11.6 years, the longest among S&P 500 REITs. Only 6% of debt matures before 2028. The average rate is 4.33% and 95.5% of debt is fixed-rate. That shields against rising interest costs, although in August the company issued $1.0bn of perpetual notes at 7.25% – above the average level.
Net debt and preferred stock to adjusted EBITDA was 6.9x annualised in the third quarter, with a Q4 target of 5.6–6.2x. Ratings are BBB+ stable from S&P and Baa2 from Moody's. Leverage is high, but the maturity schedule and liquidity buy time for a recovery.
The $0.72 dividend yields 6.1% on a payout of just 47% of FFO
For the third quarter of 2026 the company declared a dividend of $0.72 per share, unchanged from the prior quarter. At the 30 September price the dividend yield is 6.1% and the payout ratio is 47% of adjusted FFO. That is a moderate burden on cash flow.
Our estimate for the 2026 dividend is about $2.88 per share, based on four quarters at $0.72. Against FFO guidance of $6.38–6.42 per share, the payout stays within 45–46%. The company does not plan to issue common equity in 2026 and retains a $500m buyback programme that has not yet been used.
The risk to the dividend is a further fall in FFO. If occupancy does not recover before 2027 and renewal rates keep declining, the payout ratio will rise. But the current payout level and $4.6bn of liquidity make a dividend cut unlikely over the next year.
Leasing of 1.2m sq ft in the quarter is the best since Q4 2024, but renewal rates are still below prior levels
Leasing volume in the third quarter was 1,236,030 sq ft, 26% above the Q1 2025–Q2 2026 quarterly average of 980k sq ft and the best since Q4 2024. Of that, 451k sq ft was leasing of previously vacant space, the second-highest quarterly figure in company history.
The average term of leases signed over nine months was 10.9 years, 21% above the 2017–2025 average of 9.0 years. That supports long-term revenue stability. However, renewal and re-leasing rates are falling: down 2.4% in the third quarter and 5.1% over nine months, or down 3.3% and 6.9% on a cash basis respectively.
The company expects fourth-quarter leasing volume of about 647k sq ft – less than in the third quarter. That is a cautious forecast which may limit the occupancy recovery in early 2027.
Valuation on the latest reported figures
| Metric | Value |
|---|---|
| Operating cash flow (LTM) | 1.19 bn |
| ROE | -5.6% |
Bottom line
The strong part of the report is cash flow: $341.8m for the quarter and $1,187.8m for twelve months, plus the highest leasing volume since Q4 2024. The weak part is revenue, which has fallen for six straight quarters, and occupancy of 87.1% against 91.7% a year earlier. The $637.7m loss is a write-down, not an operating loss, and it does not change the cash-flow picture. The key question for a holder is when occupancy turns: 1.3m sq ft of already-leased space will only add to occupancy by mid-2027. With a 6.1% yield and a 47% payout of FFO the dividend looks protected, but capital growth needs an occupancy inflection.
Open the company's financial profile ARE →
See also: market overview · valuation map · stock screeners