ASML: revenue up 55.2%, but the cushion is already priced in
ASML reported third-quarter 2026 revenue of EUR 11,662.0 mn, EBITDA of EUR 5,435.7 mn and net profit of EUR 4,960.4 mn – growth accelerated, with revenue up 55.2% year on year versus 21.3% a quarter earlier. The EBITDA margin reached 46.6% against 36.5% a year earlier, and net debt remains negative – at 30 September 2026 the company holds EUR 6,067.9 mn of net cash. Yet the share trades at EV/EBITDA LTM of 34.9, above its own three-year average of 31.2, and the verdict is 'rather attractive': growth and cash flow are strong, but the valuation already reflects much of it.
Key takeaways
— Revenue rose 55.2% year on year, and growth accelerated from 21.3% a quarter earlier
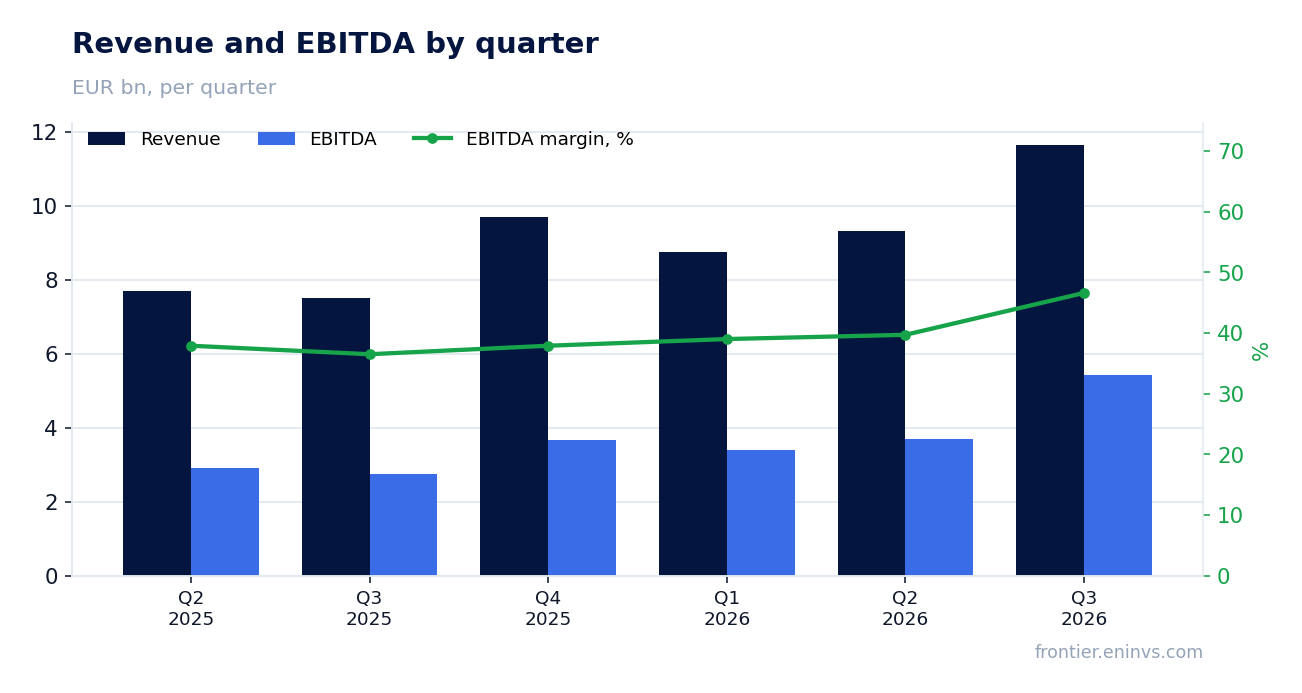
— EBITDA rose 98.2%, lifting the margin to 46.6% from 36.5% a year earlier
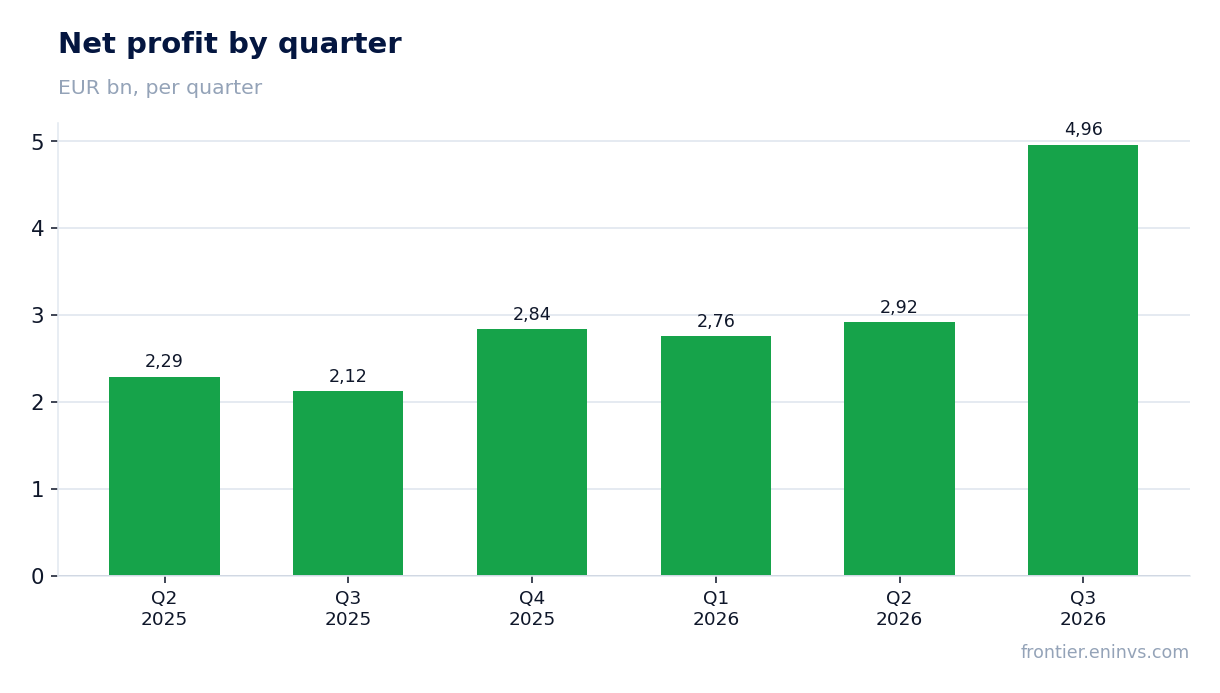
— Net profit rose 133.5%, with the margin reaching 42.5% against 28.3%
— Operating cash flow for the quarter was EUR 11,797.6 mn – more than quarterly revenue
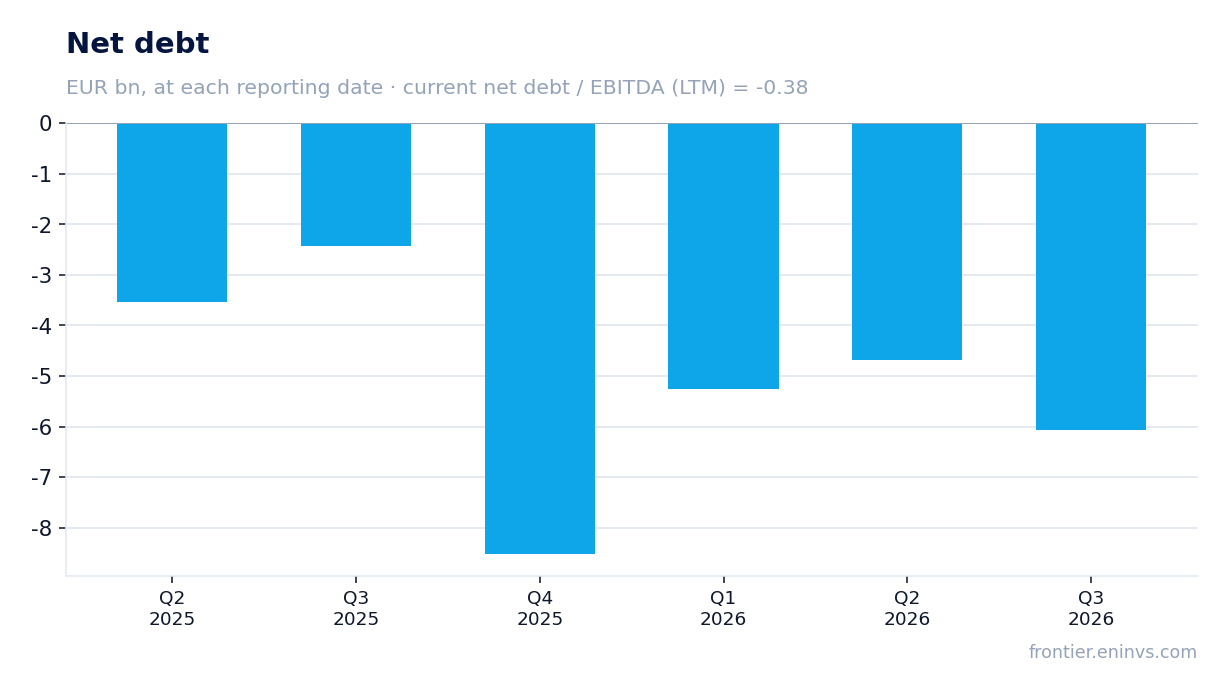
— Net cash rose to EUR 6,067.9 mn from EUR 4,687.5 mn at the end of June
— EV/EBITDA LTM of 34.9 is 12% above its own three-year average of 31.2
— Trailing dividend yield is just 0.54% – the payout plays no role in the valuation
Attractiveness
Key figures, EUR bn
| Metric | Q3 2025 | Q3 2026 | Change |
|---|---|---|---|
| Revenue | 7.52 | 11.7 | +55.2% |
| EBITDA | 2.74 | 5.44 | +98.2% |
| Operating profit | 2.47 | 5.17 | +109.6% |
| Net profit | 2.12 | 4.96 | +133.5% |
| Operating cash flow | 0.56 | 11.8 | +2010.1% |
| Capex | 0.32 | — | — |
| EBITDA margin | 36.5% | 46.6% | +10.1 pp |
| Net margin | 28.3% | 42.5% | +14.2 pp |
Revenue rose 55.2% year on year, and growth accelerated from 21.3% a quarter earlier
Third-quarter 2026 revenue was EUR 11,662.0 mn, up 55.2% year on year. In the second quarter growth was 21.3%, so the pace more than doubled. This is not a seasonal adjustment: revenue also rose quarter on quarter, from EUR 9,326.5 mn in the second quarter to EUR 11,662.0 mn in the third.
The acceleration coincided with a sharp improvement in profitability: EBITDA rose 98.2% year on year, almost twice as fast as revenue. That ratio means revenue growth came with a disproportionately small increase in costs – operating leverage worked in full. Operating profit for the quarter was EUR 5,172.8 mn.
For a holder, what matters is not the figure itself but its durability. One quarter at 55.2% does not yet make a trend, but it shows that demand for the company's equipment remains high and utilisation supports a high margin. The next report will show whether this level holds.
EBITDA rose 98.2%, lifting the margin to 46.6% from 36.5% a year earlier
EBITDA for the third quarter of 2026 was EUR 5,435.7 mn against EUR 2,743.0 mn a year earlier. The EBITDA margin rose to 46.6% from 36.5% – an increase of 10.1 percentage points. Such a jump on 55.2% revenue growth means almost all of the incremental revenue reached EBITDA.
Operating profit rose to EUR 5,172.8 mn, and the gap between EBITDA and operating profit is small – depreciation takes a modest share. This distinguishes the company from software developers, where capitalised development costs flatter EBITDA; here EBITDA reflects the real operating economics.
The high margin is the main argument for the quality of the business. But it is also the main risk: if demand for equipment weakens, operating leverage works in reverse, and the margin will compress faster than revenue.
Net profit rose 133.5%, with the margin reaching 42.5% against 28.3%
Net profit for the third quarter of 2026 was EUR 4,960.4 mn, up 133.5% from EUR 2,124.5 mn a year earlier. The net margin rose to 42.5% from 28.3%. Profit grew faster than EBITDA, which means that below the operating line costs did not eat into the gain.
The gap between EBITDA growth (98.2%) and net profit growth (133.5%) means financial and other items worked in favour of the result. The details of those items are not disclosed in the facts, so we limit ourselves to stating that net profit grew faster than operating profit.
For valuation the base matters: over the last twelve months net profit was EUR 13,474.3 mn. That figure, not the quarterly one, underpins the P/E LTM of 42.5 – and it also shows how far the quarterly profit exceeds the average level for the year.
Operating cash flow for the quarter was EUR 11,797.6 mn – more than quarterly revenue
Operating cash flow for the third quarter of 2026 was EUR 11,797.6 mn – more than quarterly revenue (EUR 11,662.0 mn). Such a result implies a large working-capital inflow: the company collected cash for shipments made earlier. Over the last twelve months operating cash flow was EUR 22,725.4 mn.
One-off inflows in the cash flow must be separated from sustainable generation. Quarterly flow of EUR 11,797.6 mn against EUR 1,703.1 mn in the second quarter is a jump unlikely to repeat every quarter. But it confirms that the business can convert profit into cash.
Capital expenditure for the third quarter is not disclosed in the facts, so we do not calculate free cash flow. In previous quarters capex was small relative to revenue – EUR 386.1 mn in the second quarter of 2026, EUR 470.4 mn in the fourth quarter of 2025. At that level of capital intensity cash flow goes almost entirely to shareholders and the balance sheet.
Net cash rose to EUR 6,067.9 mn from EUR 4,687.5 mn at the end of June
At 30 September 2026 ASML's net debt was negative – minus EUR 6,067.9 mn, meaning the company holds a net cash position. At 30 June 2026 it was minus EUR 4,687.5 mn, at 30 September 2025 – minus EUR 2,421.8 mn. Over the year the cash cushion grew by EUR 3,646.1 mn.
Net debt to EBITDA LTM is minus 0.38 – a level at which there is no debt burden and the balance sheet serves as a source of liquidity. The direction of change in this ratio is not disclosed in the facts, so we state the level only: the company funds itself from its own resources.
A strong balance sheet is insurance against a downturn in demand. With an EBITDA margin of 46.6% and negative net debt, the company can weather several weak quarters without threatening its financial stability.
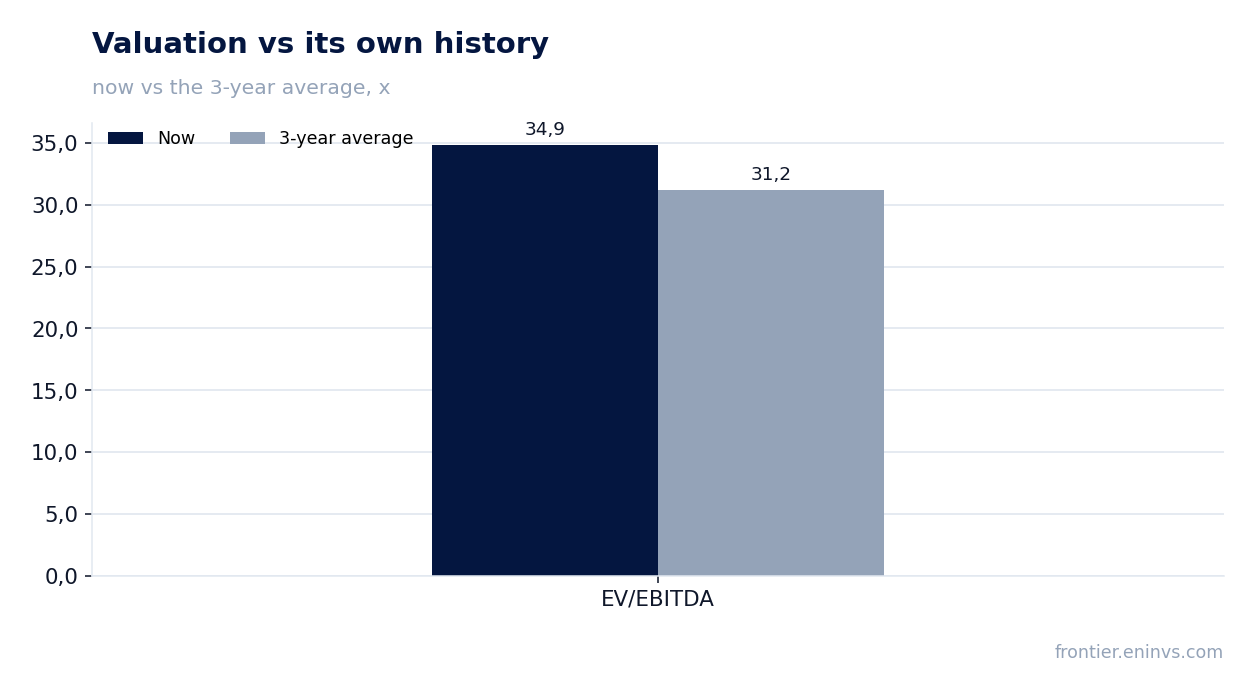
EV/EBITDA LTM of 34.9 is 12% above its own three-year average of 31.2
On EV/EBITDA LTM of 34.9, ASML's share trades above its own three-year average of 31.2 – by 12%. This means the market values current profit more expensively than on average over the past three years. P/E LTM is 42.5 on trailing twelve-month net profit of EUR 13,474.3 mn.
The high valuation rests on accelerating growth: revenue rose 55.2% year on year, EBITDA 98.2%, net profit 133.5%. If that pace holds, the multiple will normalise quickly through growth in the denominator. If the pace slows, the current premium to its own history will prove undeserved.
On the portal's model, the share's fair value is 31% above the current market price. This is our own estimate, built on EBITDA growth and a target multiple, not a market consensus. It shows that if current dynamics persist, the share retains room to grow.
Trailing dividend yield is just 0.54% – the payout plays no role in the valuation
ASML's trailing twelve-month dividend yield is 0.54% – with a market capitalisation of EUR 572,155.4 mn, payouts to shareholders are negligible relative to the company's value. For comparison, the eurozone key rate is not given in the facts, but even without it, the dividend is clearly not a reason to hold the share.
The company prefers to direct free funds into buybacks and development rather than dividends. With operating cash flow of EUR 22,725.4 mn over twelve months and capital expenditure of a few hundred million per quarter, ASML has the resources for more generous payouts, but the policy remains conservative.
For an investor this means the share's return will be driven by capitalisation growth, not dividends. At the current valuation of EV/EBITDA 34.9 and P/E 42.5, the main bet is on continued profit growth.
Valuation on the latest reported figures
| Metric | Value |
|---|---|
| Market cap | 572 bn EUR |
| P/E (LTM) | 42.5 |
| EV/EBITDA (LTM) | 34.9 |
| P/B | 29.17 |
| Net debt / EBITDA (LTM) | -0.38 |
| Operating cash flow (LTM) | 22.7 bn |
| ROE | 90.4% |
| Dividend yield (12m) | 0.5% |
| EV/EBITDA, 3-year average | 31.2 |
Bottom line
The quarter was exceptionally strong: revenue rose 55.2%, EBITDA 98.2%, net profit 133.5%, and the EBITDA margin reached 46.6%. The company holds a net cash position of EUR 6,067.9 mn and generates operating cash flow exceeding revenue. However, part of that flow is a one-off working-capital inflow, and the EV/EBITDA valuation of 34.9 is already above its own three-year average of 31.2. The verdict is 'rather attractive': the business is strong, but the share is not cheap, and to stay attractive the company must confirm the durability of its growth pace in the next report.
Open the company's financial profile ASML →
See also: market overview · valuation map · stock screeners