Bloom Energy Corp: revenue up 2.4-fold, but free cash flow turned negative
Contents
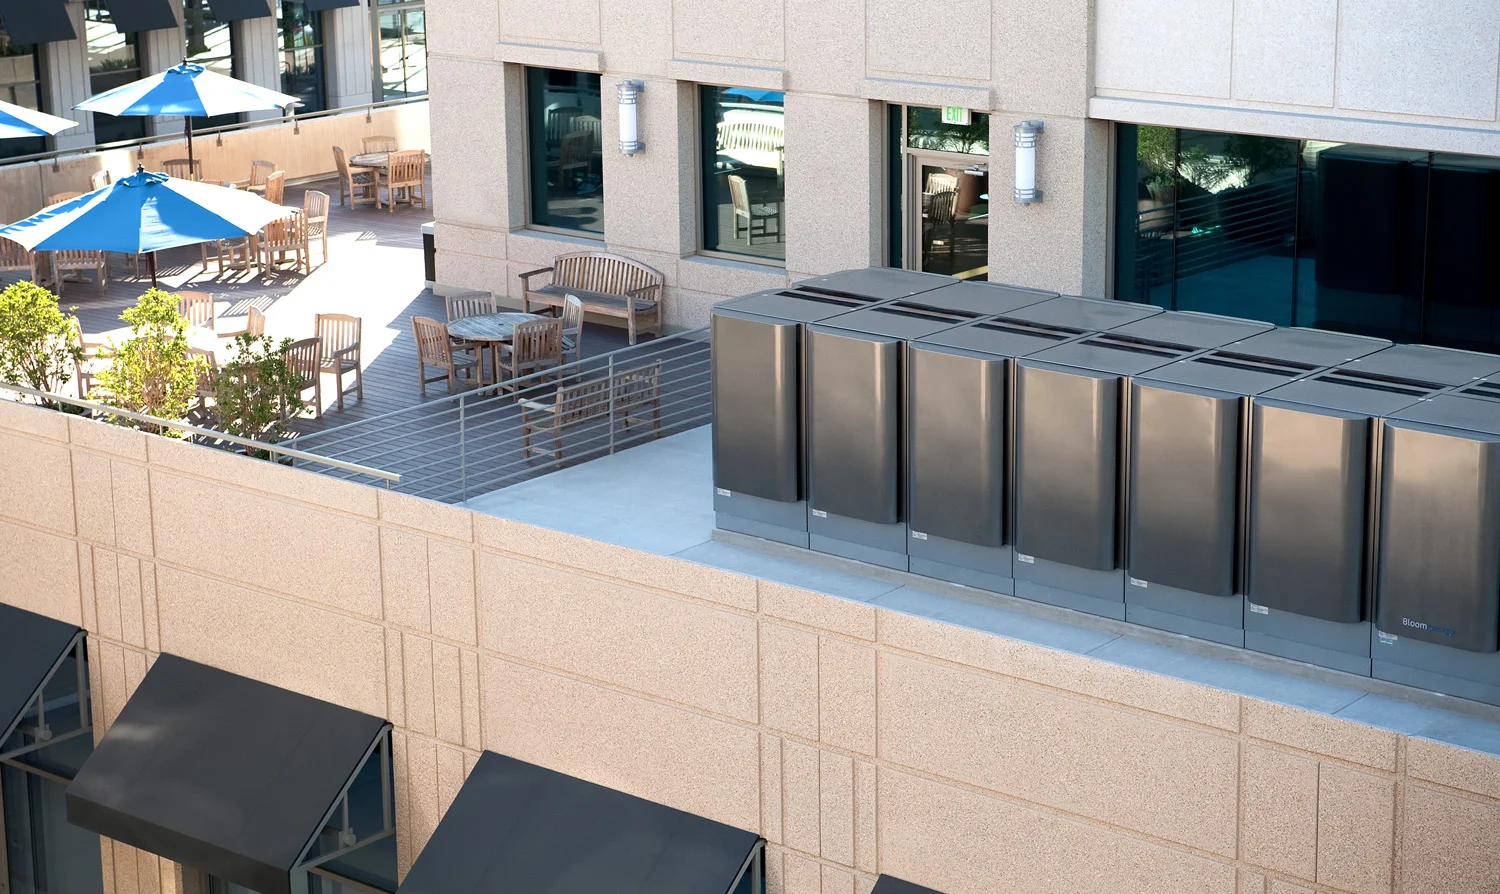
On 22 October, Bloom Energy Corp released its third-quarter 2026 results. Revenue reached $1,231.0 million, up 137.2% year on year, EBITDA came in at $239.3 million with a margin of 19.4% versus 4.0% a year earlier, and net profit was $249.0 million. However, operating cash flow was negative at -$27.1 million, and capital expenditure rose to $153.5 million. Our conclusion: rather unattractive – on the portal's model, the upside to fair value is -13%. Our view: the share is rather unattractive at the current price; upside on the portal model -13%.
Our view: is there upside
Our view in numbers
| Metric | Our read |
|---|---|
| Verdict | Rather unattractive |
| Upside on the portal model | -13% |
| How the model works | fundamental value-creation model: EBITDA growth times the target multiple, against market cap |
| Net debt / EBITDA | 0.28 – low leverage |
| Strongest case for | Revenue is growing 137.2%, and the company raised its 2026 guidance to $4.4–4.6 billion. |
| Strongest case against | Valuation is extremely high: LTM EV/EBITDA 102.6, and the portal model's upside is -13%. |
| What would change the view | If operating cash flow turns sustainably positive and revenue growth accelerates, the verdict could improve by one notch. |
Key takeaways
— Revenue grew 137.2% on product sales, but growth decelerated from 164.4% in the second quarter
— EBITDA margin rose to 19.4% as gross margin expanded to 33.8%
— Net profit of $249.0 million includes one-off items that inflated the result
— Operating cash flow turned negative at -$27.1 million due to working capital growth
— Leverage is low: net debt of $148.1 million against LTM EBITDA of $537.7 million
— Valuation is extremely high: EV/EBITDA LTM 102.6, P/E LTM 122.1
Key figures, USD bn
| Metric | Q3 2025 | Q3 2026 | Change |
|---|---|---|---|
| Revenue | 0.52 | 1.23 | +137.2% |
| EBITDA | 0.02 | 0.24 | +1058.8% |
| Operating profit | 0.01 | 0.23 | +2773.4% |
| Net profit | -0.02 | 0.25 | to profit |
| Operating cash flow | 0.02 | -0.03 | -238.0% |
| Capex | 0.01 | 0.15 | +1147.8% |
| EBITDA margin | 4.0% | 19.4% | +15.4 pp |
| Net margin | -4.4% | 20.2% | +24.6 pp |
Revenue grew 137.2% on product sales, but growth decelerated from 164.4% in the second quarter
Revenue for the third quarter of 2026 was $1,231.0 million, up 137.2% year on year. Product revenue was the main driver at $1,073.6 million, up 179.4%. Installation and service grew more modestly: installation brought in $84.9 million, service $67.6 million.
Growth decelerated from the second quarter, when revenue rose 164.4%. The slowdown reflects a higher base: a year earlier, third-quarter revenue was $519.0 million versus $401.2 million in the second quarter of 2025.
The company raised its full-year 2026 revenue guidance to $4.4–4.6 billion, implying 122% growth at the midpoint. This is the third guidance increase this year.
Revenue and EBITDA by quarter
| Period | Measure | bn USD |
|---|---|---|
| Q4 2024 | Revenue | 0.572393 |
| Q1 2025 | Revenue | 0.326021 |
| Q2 2025 | Revenue | 0.40124200000000004 |
| Q3 2025 | Revenue | 0.519048 |
| Q4 2025 | Revenue | 0.777683 |
| Q1 2026 | Revenue | 0.751054 |
| Q2 2026 | Revenue | 1.0607460000000002 |
| Q3 2026 | Revenue | 1.231028 |
| Q4 2024 | EBITDA | 0.118589 |
| Q1 2025 | EBITDA | −0.007084 |
| Q2 2025 | EBITDA | 0.009093 |
| Q3 2025 | EBITDA | 0.020646 |
| Q4 2025 | EBITDA | 0.100713 |
| Q1 2026 | EBITDA | 0.08546899999999999 |
| Q2 2026 | EBITDA | 0.195983 |
| Q3 2026 | EBITDA | 0.23925400000000002 |
EBITDA margin
| Period | Measure | % |
|---|---|---|
| Q4 2024 | EBITDA margin | 20.7 |
| Q1 2025 | EBITDA margin | −2.2 |
| Q2 2025 | EBITDA margin | 2.3 |
| Q3 2025 | EBITDA margin | 4.0 |
| Q4 2025 | EBITDA margin | 13.0 |
| Q1 2026 | EBITDA margin | 11.4 |
| Q2 2026 | EBITDA margin | 18.5 |
| Q3 2026 | EBITDA margin | 19.4 |
EBITDA margin rose to 19.4% as gross margin expanded to 33.8%
EBITDA for the third quarter was $239.3 million, with an EBITDA margin of 19.4% versus 4.0% a year earlier. Gross margin rose to 33.8% from 29.2%, mainly driven by the product segment, where margin reached 37.9%.
Operating profit was $225.4 million at an 18.2% margin. Operating expenses rose to $191.7 million, but their share of revenue declined. Adjusted EBITDA, as defined by the company, was $299.5 million, higher than the GAAP figure due to the exclusion of stock-based compensation and other items.
Net profit by quarter
| Period | Measure | bn USD |
|---|---|---|
| Q4 2024 | Net profit | 0.1052 |
| Q1 2025 | Net profit | −0.023414 |
| Q2 2025 | Net profit | −0.042192 |
| Q3 2025 | Net profit | −0.02296 |
| Q4 2025 | Net profit | 0.001426000000000002 |
| Q1 2026 | Net profit | 0.073691 |
| Q2 2026 | Net profit | 0.198856 |
| Q3 2026 | Net profit | 0.248976 |
Net profit of $249.0 million includes one-off items that inflated the result
Net profit was $249.0 million versus a loss of $23.0 million a year earlier. However, the profit includes one-off items: a gain on revaluation of embedded derivatives of $10 thousand and other income. In addition, non-GAAP net profit was $302.8 million, higher than GAAP profit, as the company excluded stock-based compensation ($60.1 million) and other items.
Thus, GAAP profit was understated by one-off charges rather than inflated. The main contribution to profit came from operations, not one-off factors.
Operating cash flow turned negative at -$27.1 million due to working capital growth
Operating cash flow for the third quarter was negative at -$27.1 million versus positive $19.7 million a year earlier. The reason is a significant working capital outflow: accounts receivable rose by $175.2 million, contract assets by $430.3 million, inventories by $170.4 million. This was partly offset by an increase in accounts payable of $184.7 million and deferred revenue of $309.3 million.
Capital expenditure rose to $153.5 million from $12.3 million a year earlier. Free cash flow was therefore negative. The company is investing in capacity expansion.
Leverage is low: net debt of $148.1 million against LTM EBITDA of $537.7 million
Net debt as of 30 September 2026 was $148.1 million. The ratio of net debt to LTM EBITDA is 0.28. This is a low level. Cash and equivalents stand at $2,486.7 million, significantly exceeding debt.
Interest expense for the quarter was $7.5 million, interest income $22.1 million. The company is a net interest creditor.
Share price, three years
close, last point 2026-11-10
| Period | Measure | USD per share |
|---|---|---|
| 2025-11-10 | Closing price | 139.22999572753906 |
| 2025-11-11 | Closing price | 127.06999969482422 |
| 2025-11-12 | Closing price | 126.72000122070312 |
| 2025-11-13 | Closing price | 103.55000305175781 |
| 2025-11-14 | Closing price | 111.88999938964844 |
| 2025-11-17 | Closing price | 107.11000061035156 |
| 2025-11-18 | Closing price | 104.97000122070312 |
| 2025-11-19 | Closing price | 108.93000030517578 |
| 2025-11-20 | Closing price | 93.37999725341797 |
| 2025-11-21 | Closing price | 89.98999786376953 |
| 2025-11-24 | Closing price | 95.55999755859375 |
| 2025-11-25 | Closing price | 94.29000091552734 |
| 2025-11-26 | Closing price | 101.13999938964844 |
| 2025-11-28 | Closing price | 109.23999786376953 |
| 2025-12-01 | Closing price | 98.93000030517578 |
| 2025-12-02 | Closing price | 105.0 |
| 2025-12-03 | Closing price | 102.5 |
| 2025-12-04 | Closing price | 118.08999633789062 |
| 2025-12-05 | Closing price | 119.18000030517578 |
| 2025-12-08 | Closing price | 111.79000091552734 |
| 2025-12-09 | Closing price | 109.44000244140625 |
| 2025-12-10 | Closing price | 101.29000091552734 |
| 2025-12-11 | Closing price | 108.98999786376953 |
| 2025-12-12 | Closing price | 94.9800033569336 |
| 2025-12-15 | Closing price | 89.58000183105469 |
| 2025-12-16 | Closing price | 87.61000061035156 |
| 2025-12-17 | Closing price | 76.97000122070312 |
| 2025-12-18 | Closing price | 80.20999908447266 |
| 2025-12-19 | Closing price | 88.81999969482422 |
| 2025-12-22 | Closing price | 92.26000213623047 |
| 2025-12-23 | Closing price | 91.43000030517578 |
| 2025-12-24 | Closing price | 91.87999725341797 |
| 2025-12-26 | Closing price | 90.18000030517578 |
| 2025-12-29 | Closing price | 88.41000366210938 |
| 2025-12-30 | Closing price | 87.26000213623047 |
| 2025-12-31 | Closing price | 86.88999938964844 |
| 2026-01-02 | Closing price | 98.69000244140625 |
| 2026-01-05 | Closing price | 103.87000274658203 |
| 2026-01-06 | Closing price | 103.05000305175781 |
| 2026-01-07 | Closing price | 108.0 |
| 2026-01-08 | Closing price | 121.83999633789062 |
| 2026-01-09 | Closing price | 134.07000732421875 |
| 2026-01-12 | Closing price | 136.8699951171875 |
| 2026-01-13 | Closing price | 139.77000427246094 |
| 2026-01-14 | Closing price | 133.4600067138672 |
| 2026-01-15 | Closing price | 139.1699981689453 |
| 2026-01-16 | Closing price | 149.5 |
| 2026-01-20 | Closing price | 151.75 |
| 2026-01-21 | Closing price | 150.55999755859375 |
| 2026-01-22 | Closing price | 145.6300048828125 |
| 2026-01-23 | Closing price | 144.88999938964844 |
| 2026-01-26 | Closing price | 139.6199951171875 |
| 2026-01-27 | Closing price | 152.30999755859375 |
| 2026-01-28 | Closing price | 165.38999938964844 |
| 2026-01-29 | Closing price | 156.50999450683594 |
| 2026-01-30 | Closing price | 151.3699951171875 |
| 2026-02-02 | Closing price | 156.1300048828125 |
| 2026-02-03 | Closing price | 168.88999938964844 |
| 2026-02-04 | Closing price | 147.35000610351562 |
| 2026-02-05 | Closing price | 136.60000610351562 |
| 2026-02-06 | Closing price | 143.02999877929688 |
| 2026-02-09 | Closing price | 155.1699981689453 |
| 2026-02-10 | Closing price | 148.6999969482422 |
| 2026-02-11 | Closing price | 155.5399932861328 |
| 2026-02-12 | Closing price | 139.02999877929688 |
| 2026-02-13 | Closing price | 139.74000549316406 |
| 2026-02-17 | Closing price | 145.32000732421875 |
| 2026-02-18 | Closing price | 157.27000427246094 |
| 2026-02-19 | Closing price | 159.0 |
| 2026-02-20 | Closing price | 147.5500030517578 |
| 2026-02-23 | Closing price | 160.27999877929688 |
| 2026-02-24 | Closing price | 166.1999969482422 |
| 2026-02-25 | Closing price | 174.77000427246094 |
| 2026-02-26 | Closing price | 168.57000732421875 |
| 2026-02-27 | Closing price | 155.6699981689453 |
| 2026-03-02 | Closing price | 166.0 |
| 2026-03-03 | Closing price | 153.02000427246094 |
| 2026-03-04 | Closing price | 164.77999877929688 |
| 2026-03-05 | Closing price | 159.99000549316406 |
| 2026-03-06 | Closing price | 135.19000244140625 |
| 2026-03-09 | Closing price | 151.32000732421875 |
| 2026-03-10 | Closing price | 154.0 |
| 2026-03-11 | Closing price | 159.2100067138672 |
| 2026-03-12 | Closing price | 157.1699981689453 |
| 2026-03-13 | Closing price | 154.50999450683594 |
| 2026-03-16 | Closing price | 153.67999267578125 |
| 2026-03-17 | Closing price | 160.0500030517578 |
| 2026-03-18 | Closing price | 156.5800018310547 |
| 2026-03-19 | Closing price | 166.69000244140625 |
| 2026-03-20 | Closing price | 150.1199951171875 |
| 2026-03-23 | Closing price | 141.3300018310547 |
| 2026-03-24 | Closing price | 145.8800048828125 |
| 2026-03-25 | Closing price | 150.22000122070312 |
| 2026-03-26 | Closing price | 133.52000427246094 |
| 2026-03-27 | Closing price | 133.24000549316406 |
| 2026-03-30 | Closing price | 119.51000213623047 |
| 2026-03-31 | Closing price | 135.49000549316406 |
| 2026-04-01 | Closing price | 132.4499969482422 |
| 2026-04-02 | Closing price | 135.6300048828125 |
| 2026-04-06 | Closing price | 135.0 |
| 2026-04-07 | Closing price | 135.91000366210938 |
| 2026-04-08 | Closing price | 146.77999877929688 |
| 2026-04-09 | Closing price | 160.1300048828125 |
| 2026-04-10 | Closing price | 166.6999969482422 |
| 2026-04-13 | Closing price | 176.6699981689453 |
| 2026-04-14 | Closing price | 219.02999877929688 |
| 2026-04-15 | Closing price | 213.83999633789062 |
| 2026-04-16 | Closing price | 210.05999755859375 |
| 2026-04-17 | Closing price | 207.86000061035156 |
| 2026-04-20 | Closing price | 218.27000427246094 |
| 2026-04-21 | Closing price | 220.91000366210938 |
| 2026-04-22 | Closing price | 229.75 |
| 2026-04-23 | Closing price | 237.57000732421875 |
| 2026-04-24 | Closing price | 231.1699981689453 |
| 2026-04-27 | Closing price | 234.67999267578125 |
| 2026-04-28 | Closing price | 226.3699951171875 |
| 2026-04-29 | Closing price | 287.9700012207031 |
| 2026-04-30 | Closing price | 283.3599853515625 |
| 2026-05-01 | Closing price | 290.5199890136719 |
| 2026-05-04 | Closing price | 288.6400146484375 |
| 2026-05-05 | Closing price | 295.25 |
| 2026-05-06 | Closing price | 285.4700012207031 |
| 2026-05-07 | Closing price | 258.6400146484375 |
| 2026-05-08 | Closing price | 261.0299987792969 |
| 2026-05-11 | Closing price | 283.9200134277344 |
| 2026-05-12 | Closing price | 280.69000244140625 |
| 2026-05-13 | Closing price | 289.760009765625 |
| 2026-05-14 | Closing price | 303.4100036621094 |
| 2026-05-15 | Closing price | 275.95001220703125 |
| 2026-05-18 | Closing price | 258.7099914550781 |
| 2026-05-19 | Closing price | 261.3399963378906 |
| 2026-05-20 | Closing price | 282.30999755859375 |
| 2026-05-21 | Closing price | 307.8800048828125 |
| 2026-05-22 | Closing price | 302.489990234375 |
| 2026-05-26 | Closing price | 302.3999938964844 |
| 2026-05-27 | Closing price | 293.79998779296875 |
| 2026-05-28 | Closing price | 290.010009765625 |
| 2026-05-29 | Closing price | 285.0 |
| 2026-06-01 | Closing price | 273.510009765625 |
| 2026-06-02 | Closing price | 302.8500061035156 |
| 2026-06-03 | Closing price | 287.32000732421875 |
| 2026-06-04 | Closing price | 291.3699951171875 |
| 2026-06-05 | Closing price | 263.6099853515625 |
| 2026-06-08 | Closing price | 253.57000732421875 |
| 2026-06-09 | Closing price | 259.6099853515625 |
| 2026-06-10 | Closing price | 234.22999572753906 |
| 2026-06-11 | Closing price | 248.8800048828125 |
| 2026-06-12 | Closing price | 260.2200012207031 |
| 2026-06-15 | Closing price | 274.5 |
| 2026-06-16 | Closing price | 280.8800048828125 |
| 2026-06-17 | Closing price | 284.989990234375 |
| 2026-06-18 | Closing price | 328.9100036621094 |
| 2026-06-22 | Closing price | 345.8500061035156 |
| 2026-06-23 | Closing price | 321.9800109863281 |
| 2026-06-24 | Closing price | 326.19000244140625 |
| 2026-06-25 | Closing price | 309.17999267578125 |
| 2026-06-26 | Closing price | 252.02000427246094 |
| 2026-06-29 | Closing price | 275.010009765625 |
| 2026-06-30 | Closing price | 302.70001220703125 |
| 2026-07-01 | Closing price | 289.5 |
| 2026-07-02 | Closing price | 270.8900146484375 |
| 2026-07-06 | Closing price | 295.04998779296875 |
| 2026-07-07 | Closing price | 269.57000732421875 |
| 2026-07-08 | Closing price | 254.2899932861328 |
| 2026-07-09 | Closing price | 257.0199890136719 |
| 2026-07-10 | Closing price | 244.61000061035156 |
| 2026-07-13 | Closing price | 233.49000549316406 |
| 2026-07-14 | Closing price | 243.39999389648438 |
| 2026-07-15 | Closing price | 239.3800048828125 |
| 2026-07-16 | Closing price | 206.72999572753906 |
| 2026-07-17 | Closing price | 214.9600067138672 |
| 2026-07-20 | Closing price | 197.05999755859375 |
| 2026-07-21 | Closing price | 226.25999450683594 |
| 2026-07-22 | Closing price | 218.22000122070312 |
| 2026-07-23 | Closing price | 217.3000030517578 |
| 2026-07-24 | Closing price | 184.88999938964844 |
| 2026-07-27 | Closing price | 188.17999267578125 |
| 2026-07-28 | Closing price | 166.83999633789062 |
| 2026-07-29 | Closing price | 163.75 |
| 2026-07-30 | Closing price | 207.1199951171875 |
| 2026-07-31 | Closing price | 205.80999755859375 |
| 2026-08-03 | Closing price | 218.32000732421875 |
| 2026-08-04 | Closing price | 228.11000061035156 |
| 2026-08-05 | Closing price | 234.3300018310547 |
| 2026-08-06 | Closing price | 228.9600067138672 |
| 2026-08-07 | Closing price | 219.33999633789062 |
| 2026-08-10 | Closing price | 210.6300048828125 |
| 2026-08-11 | Closing price | 211.2100067138672 |
| 2026-08-12 | Closing price | 237.16000366210938 |
| 2026-08-13 | Closing price | 236.22000122070312 |
| 2026-08-14 | Closing price | 229.94000244140625 |
| 2026-08-17 | Closing price | 232.16000366210938 |
| 2026-08-18 | Closing price | 209.00999450683594 |
| 2026-08-19 | Closing price | 206.6300048828125 |
| 2026-08-20 | Closing price | 202.47999572753906 |
| 2026-08-21 | Closing price | 201.4499969482422 |
| 2026-08-24 | Closing price | 204.02000427246094 |
| 2026-08-25 | Closing price | 217.4499969482422 |
| 2026-08-26 | Closing price | 218.2100067138672 |
| 2026-08-27 | Closing price | 217.8300018310547 |
| 2026-08-28 | Closing price | 210.77000427246094 |
| 2026-08-31 | Closing price | 206.3000030517578 |
| 2026-09-01 | Closing price | 213.6300048828125 |
| 2026-09-02 | Closing price | 217.27999877929688 |
| 2026-09-03 | Closing price | 235.5500030517578 |
| 2026-09-04 | Closing price | 252.8699951171875 |
| 2026-09-08 | Closing price | 277.2200012207031 |
| 2026-09-09 | Closing price | 269.2799987792969 |
| 2026-09-10 | Closing price | 258.489990234375 |
| 2026-09-11 | Closing price | 275.75 |
| 2026-09-14 | Closing price | 257.04998779296875 |
| 2026-09-15 | Closing price | 259.3500061035156 |
| 2026-09-16 | Closing price | 270.0199890136719 |
| 2026-09-17 | Closing price | 280.760009765625 |
| 2026-09-18 | Closing price | 265.6300048828125 |
| 2026-09-21 | Closing price | 272.8900146484375 |
| 2026-09-22 | Closing price | 276.5299987792969 |
| 2026-09-23 | Closing price | 275.19000244140625 |
| 2026-09-24 | Closing price | 266.6499938964844 |
| 2026-09-25 | Closing price | 288.70001220703125 |
| 2026-09-28 | Closing price | 262.8699951171875 |
| 2026-09-29 | Closing price | 291.25 |
| 2026-09-30 | Closing price | 276.9800109863281 |
| 2026-10-01 | Closing price | 277.5799865722656 |
| 2026-10-02 | Closing price | 289.1499938964844 |
| 2026-10-05 | Closing price | 286.6499938964844 |
| 2026-10-06 | Closing price | 295.7799987792969 |
| 2026-10-07 | Closing price | 291.2900085449219 |
| 2026-10-08 | Closing price | 272.82000732421875 |
| 2026-10-09 | Closing price | 280.5 |
| 2026-10-12 | Closing price | 262.2799987792969 |
| 2026-10-13 | Closing price | 263.45001220703125 |
| 2026-10-14 | Closing price | 239.33999633789062 |
| 2026-10-15 | Closing price | 236.3000030517578 |
| 2026-10-16 | Closing price | 221.30999755859375 |
| 2026-10-19 | Closing price | 226.22000122070312 |
| 2026-10-20 | Closing price | 222.64999389648438 |
| 2026-10-21 | Closing price | 238.52999877929688 |
| 2026-10-22 | Closing price | 217.77000427246094 |
| 2026-10-23 | Closing price | 193.3000030517578 |
| 2026-10-26 | Closing price | 203.9199981689453 |
| 2026-10-27 | Closing price | 218.5 |
| 2026-10-28 | Closing price | 228.0800018310547 |
| 2026-10-29 | Closing price | 222.3000030517578 |
| 2026-10-30 | Closing price | 203.1699981689453 |
| 2026-11-02 | Closing price | 196.25 |
| 2026-11-03 | Closing price | 214.00999450683594 |
| 2026-11-04 | Closing price | 200.39999389648438 |
| 2026-11-05 | Closing price | 167.52000427246094 |
| 2026-11-06 | Closing price | 173.24000549316406 |
| 2026-11-09 | Closing price | 193.8800048828125 |
| 2026-11-10 | Closing price | 185.5449981689453 |
Valuation is extremely high: EV/EBITDA LTM 102.6, P/E LTM 122.1
LTM EV/EBITDA is 102.6, P/E is 122.1. These are very high multiples that imply significant future growth. Market capitalisation is $54.9 billion.
On the portal's model, the upside to fair value is -13%. This means the share is valued above our estimate of fair value. Following the release, the share fell 8.7%, and from the release to 10 November it fell 22.2%.
Valuation on the latest reported figures
| Metric | Value |
|---|---|
| Market cap | 54.9 bn USD |
| P/E (LTM) | 122.1 |
| EV/EBITDA (LTM) | 102.6 |
| Net debt / EBITDA (LTM) | 0.28 |
| Operating cash flow (LTM) | 0.62 bn |
| ROE | 18.7% |
Bottom line
Bloom Energy Corp delivered strong revenue and profit growth, but the quality of earnings is questionable: operating cash flow is negative and capital expenditure is rising. The valuation is extremely high, leaving no margin for error. Our conclusion: rather unattractive – the portal model's upside is -13%. Our view: the share is rather unattractive at the current price; upside on the portal model -13%.