BXP: revenue accelerated to +4.6%, but profit rests on one-offs rather than rent

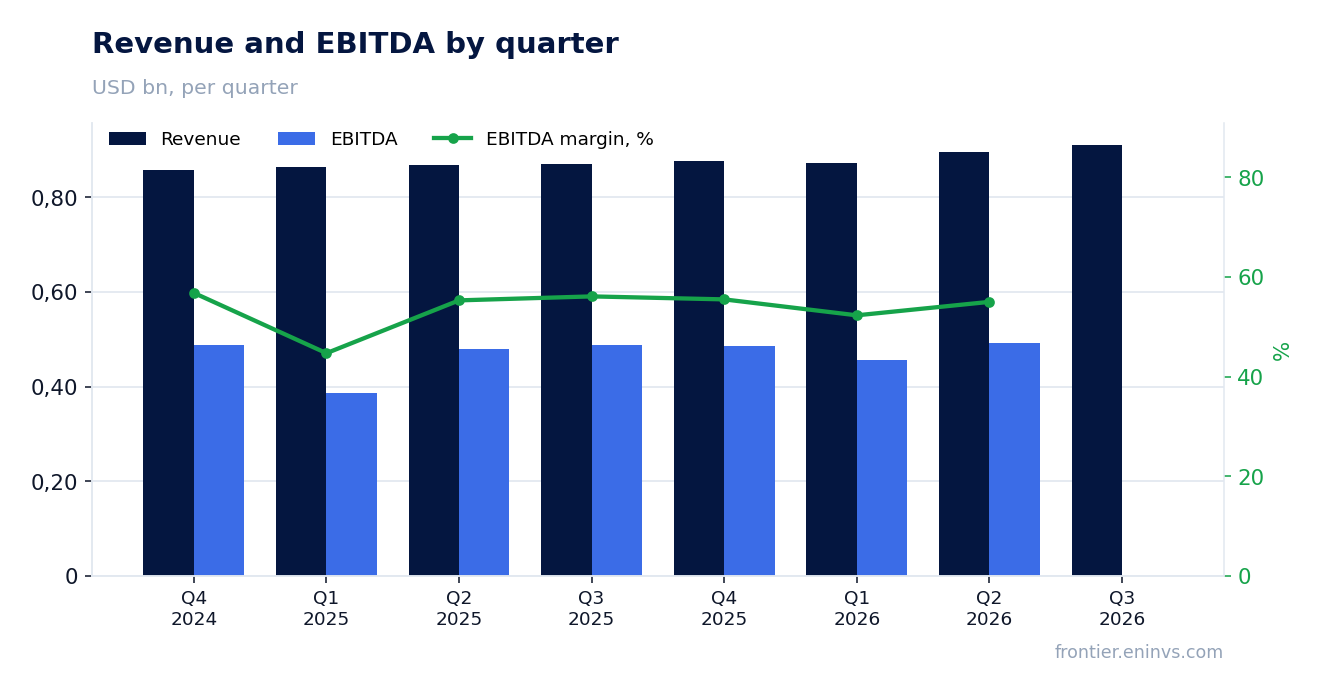
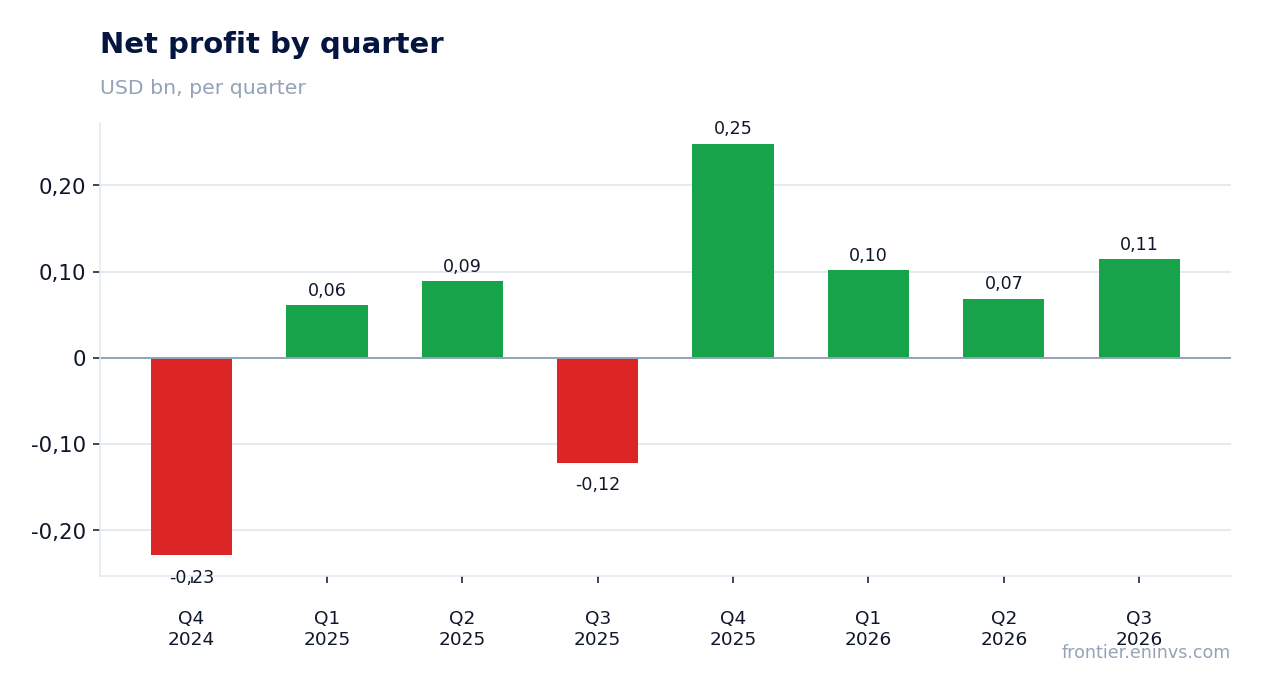
On 27 October BXP reported results for the third quarter of 2026. Revenue came in at $911.4 million, up 4.6% year on year versus 3.1% a quarter earlier, and net income reached $114.5 million at a 12.6% margin against a loss a year earlier. The acceleration is real, but profit was supported by property sales and a swing in investment marks rather than by rental flow; with $16.6 billion of debt and a 4.6% dividend yield, the share looks neutral – growth is there, but it does not yet convert into sustainable earnings.
Key takeaways
— Revenue accelerated to +4.6% on rent, not on one-off items
— The $114.5 million profit is half assembled from property sales and investment revaluation
— The 12.6% margin against a loss a year earlier is a base reversal, not a rise in rental profitability
— Debt rose to $16.6 billion, and interest expense eats $159.1 million a quarter
— The $0.70 quarterly dividend is covered by distributable flow only at 76%
— Occupancy of 89.4% and leased 91.9% are the main argument for the durability of rental flow
Attractiveness
Key figures, USD bn
| Metric | Q3 2025 | Q3 2026 | Change |
|---|---|---|---|
| Revenue | 0.87 | 0.91 | +4.6% |
| EBITDA | 0.56 | — | — |
| Operating profit | 0.25 | — | — |
| Net profit | -0.12 | 0.11 | to profit |
| Operating cash flow | 0.27 | — | — |
| Capex | 0.00 | — | — |
| EBITDA margin | 64.0% | — | — |
| Net margin | -14.0% | 12.6% | +26.6 pp |
Revenue accelerated to +4.6% on rent, not on one-off items
Third-quarter 2026 revenue came in at $911.4 million, up 4.6% year on year versus 3.1% in the second quarter. An acceleration of 1.5 percentage points is rare for a rental business, where growth is usually measured in tenths. Rent provided the main contribution: $846.2 million of the total, with the rest from parking, hotel and management services.
The driver is visible in the structure: rental revenue grew against the prior year, not one-off items. Occupancy in in-service properties rose to 89.4% from 88.4% a quarter earlier, and leased space to 91.9% from 91.3%. That means the revenue acceleration is supported by physical absorption, not only by rent indexation.
For a rental REIT such a pace signals that demand for premier offices across six gateway markets is recovering. But quarterly growth of 4.6% is still below what is needed to cover the cost of capital at the current debt load. The durability of the acceleration will be tested next quarter: if occupancy keeps rising, revenue should hold the pace.
The $114.5 million profit is half assembled from property sales and investment revaluation
Net income for the quarter was $114.5 million, or $0.71 per diluted share. Inside it, property sales brought $10.4 million, revaluation of securities added $0.7 million, and an unrealised gain on non-real-estate investments contributed $0.4 million. Without these items profit would have been noticeably thinner.
The sale closed on 5 August 2026: the company disposed of its leasehold interest in Sumner Square in Washington, DC. A quarter earlier an impairment of $18.0 million had been recognised on that property, and now it has left the base. This is classic capital recycling, not an operating result, and next quarter such support may be absent.
Earnings per share of $0.71 against $0.43 a quarter earlier looks like a strong improvement, but the comparison is distorted by one-offs. For durability, FFO matters more – $302.2 million, or $1.89 per share – which excludes sales and revaluations. It is FFO, not net income, that reflects a REIT's ability to pay dividends.
The 12.6% margin against a loss a year earlier is a base reversal, not a rise in rental profitability
The net margin in the third quarter of 2026 was 12.6% against minus 14.0% a year earlier. The reversal is explained not by rising operating efficiency but by the comparison base: a year ago the quarter closed with a loss due to a $68.9 million impairment. Now there is no impairment, and profit has returned to positive territory.
Operating margin [(rental revenue – rental expense) / rental revenue] rose to 62.1% from 61.3% a quarter earlier. That is a modest improvement, and it reflects control over operating costs rather than pricing power. Real estate taxes and operating expenses stayed almost flat against the prior quarter – $192.3 million and $142.0 million respectively.
General and administrative expenses fell to $37.6 million from $50.4 million a quarter earlier, but part of the drop is a reversal of compensation items, not headcount reduction. Margin durability will depend on whether occupancy holds above 89% and whether impairment charges return at the next portfolio rotation.
Debt rose to $16.6 billion, and interest expense eats $159.1 million a quarter
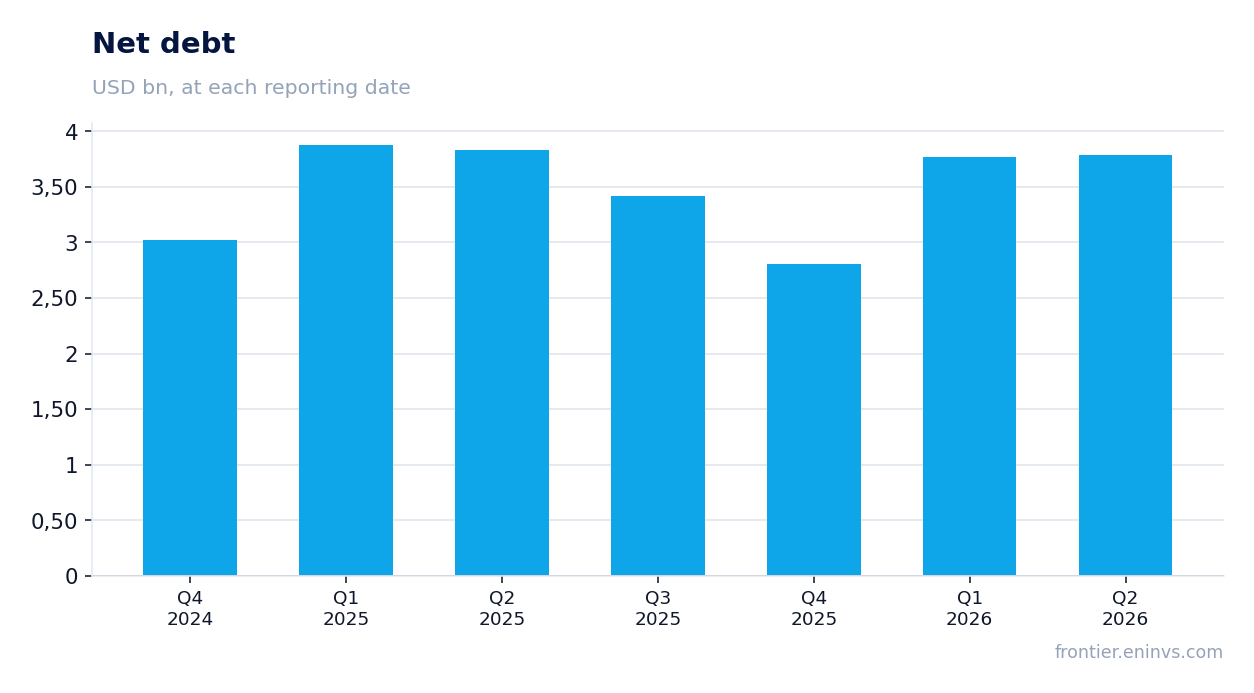
Consolidated debt at the end of the third quarter of 2026 was $16.6 billion against $15.6 billion a quarter earlier. The $1.0 billion increase was funded partly by a $247.0 million draw on the credit line and a senior notes issuance. Net debt on the latest annual balance sheet is $2.8 billion, but that is a different basis and cannot be mixed with the quarterly figure.
Interest expense for the quarter was $159.1 million, which against revenue of $911.4 million is about 17% of revenue. The interest coverage ratio is 2.98 excluding capitalised interest and 2.73 including it. That is below what is comfortable for a BBB-rated REIT and leaves little room to manoeuvre if rates rise.
The ratio of net debt to EBITDA re on a share basis is 7.52 against 7.94 a quarter earlier. The ratio fell while absolute debt rose because EBITDA re grew, not because borrowings shrank. For a holder this means leverage remains high, and any slowdown in rental flow would quickly show up in interest coverage.
The $0.70 quarterly dividend is covered by distributable flow only at 76%
For the third quarter of 2026 BXP paid a dividend of $0.70 per share, or $2.80 annualised. At the quarter-end price of $61.11 the yield is 4.6%. That is above most REITs but not above the policy rate, and the risk premium here is modest.
Dividend coverage by funds available for distribution (FAD) is 76.11% against 87.54% a quarter earlier. FAD was $163.4 million against distributions of $124.4 million. Coverage improved on higher FAD, but part of that increase is non-cash items, including straight-line rent of $46.5 million.
Our estimate for the 2026 dividend is $2.80 per share, i.e. maintenance of the current quarterly level. It rests on FAD coverage and on the absence of large one-off write-downs. If FAD falls below $150 million a quarter or interest expense rises, the payout ratio would approach 90%, and the board could revise the pace of increases.
Occupancy of 89.4% and leased 91.9% are the main argument for the durability of rental flow
Occupancy in in-service properties rose to 89.4% from 88.4% a quarter earlier, and leased space to 91.9% from 91.3%. The 2.5 percentage point gap between the two means part of signed leases has not yet begun to generate revenue. That is a growth reserve for coming quarters.
The portfolio totals 162 properties and 50.6 million square feet, including six under construction or redevelopment. Concentration in six gateway markets – Boston, Los Angeles, New York, San Francisco, Seattle and Washington, DC – supports demand but also ties the company to the fortunes of those cities.
Growth in leased space matters more than one-off profit items: it determines whether revenue holds above $900 million a quarter. If the gap between leased and occupied space closes, revenue gets an additional push without new property investment.
Bottom line
The strong side of the quarter was revenue: $911.4 million and acceleration to 4.6% year on year, supported by occupancy rising to 89.4%. The weak side was earnings quality: $114.5 million is half assembled from the Sumner Square sale and investment revaluation, and the 12.6% margin reflects a base reversal rather than rising profitability. Debt rose to $16.6 billion, and interest coverage of 2.98 is below a comfortable level. The $0.70 quarterly dividend is covered at 76.11%, and that is the main argument for holding the share in the portfolio. The verdict is neutral: revenue acceleration is there, but it does not yet convert into sustainable earnings, and leverage limits room for dividend growth.
Open the company's financial profile BXP →
See also: market overview · valuation map · stock screeners