CALIX, INC: record revenue but falling profit – growth slowed to 13.7% and margin compressed on memory costs
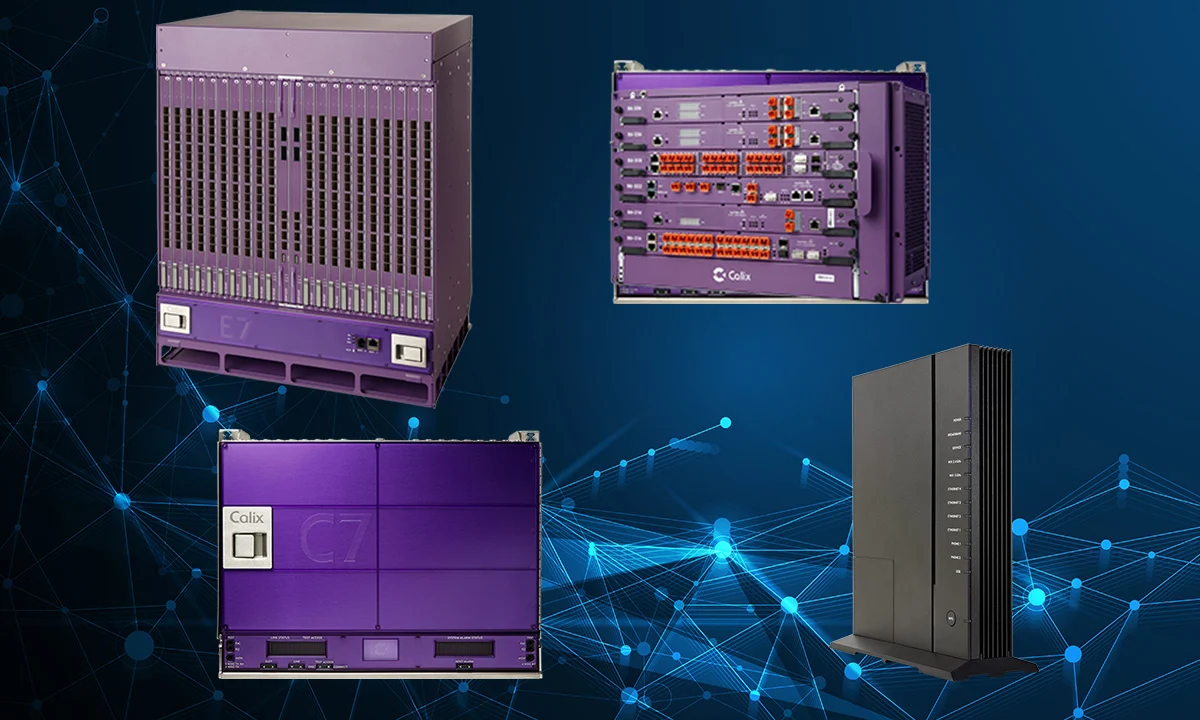
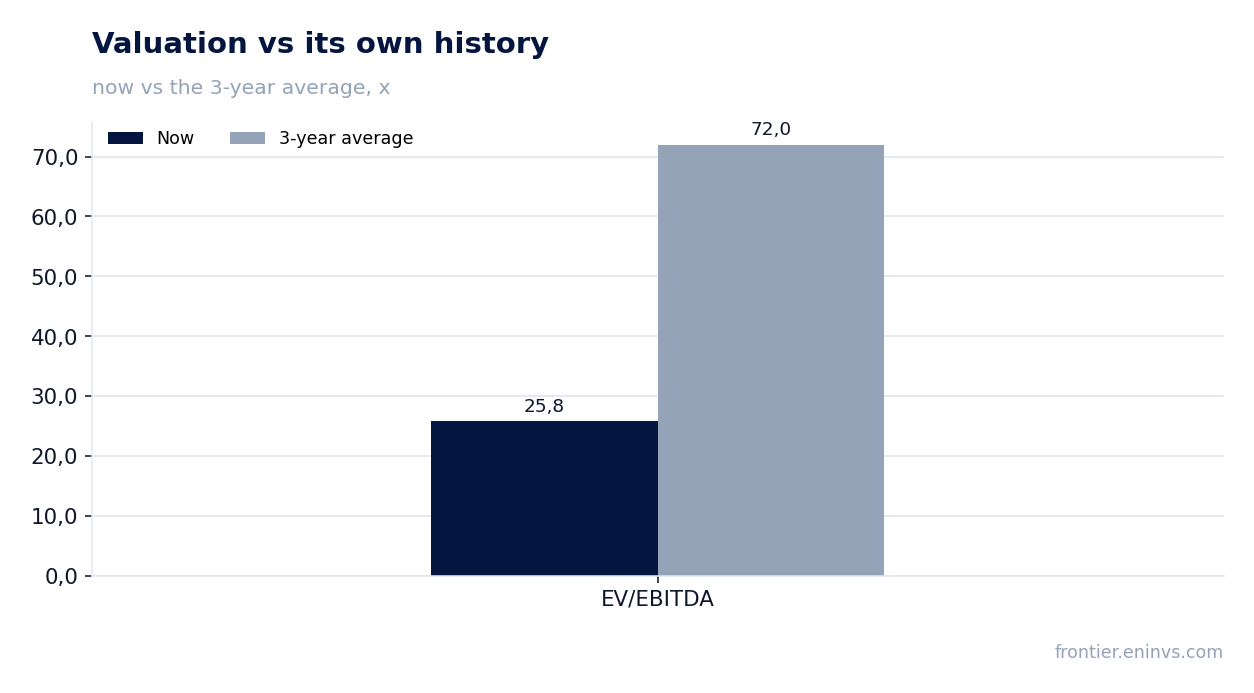
On 2 November CALIX, INC reported third-quarter 2026 results. Revenue reached a record $301.7 million (+13.7% year over year), but adjusted EBITDA fell 4.9% to $21.0 million and net profit dropped 34.7% to $10.2 million. Growth slowed from 21.3% in the second quarter to 13.7%, and the EBITDA margin compressed from 8.3% to 7.0% on higher memory costs. At an EV/EBITDA of 25.8 against its own three-year average of 72.0 the share looks cheaper than its history, but slowing growth and margin pressure leave the assessment neutral.
Key takeaways
— Revenue grew 13.7% to a record $301.7 million, but the pace slowed from 21.3% a quarter earlier
— EBITDA margin compressed to 7.0% from 8.3% on higher memory costs, only partly offset by surcharges
— Net profit fell 34.7% to $10.2 million, though non-GAAP EPS of $0.44 stayed near the top of guidance
— Free cash flow was $3.4 million on operating cash flow of $6.3 million and capex of $2.9 million
— The company repurchased $50.0 million of shares in the quarter, and the board added $100 million to the buyback programme
— EV/EBITDA of 25.8 is below its own three-year average of 72.0, and the portal model implies +27% upside to fair value
Attractiveness
Key figures, USD bn
| Metric | Q3 2025 | Q3 2026 | Change |
|---|---|---|---|
| Revenue | 0.27 | 0.30 | +13.7% |
| EBITDA | 0.02 | 0.02 | -4.9% |
| Operating profit | 0.02 | 0.02 | -4.9% |
| Net profit | 0.02 | 0.01 | -34.7% |
| Operating cash flow | 0.03 | 0.01 | -80.5% |
| Capex | 0.01 | 0.00 | -48.9% |
| EBITDA margin | 8.3% | 7.0% | -1.3 pp |
| Net margin | 5.9% | 3.4% | -2.5 pp |
Revenue grew 13.7% to a record $301.7 million, but the pace slowed from 21.3% a quarter earlier
Third-quarter 2026 revenue was $301.7 million, up 13.7% year over year and 3% sequentially. Year-over-year growth slowed: it was 21.3% in the second quarter and 27.1% in the first. The slowdown comes even as absolute revenue set a record.
Appliances drove the bulk: appliance revenue reached a record $249.8 million, up 13% year over year and 3% sequentially. Software and service revenue rose 19% to a record $51.9 million, with non-GAAP software and service gross margin at a record 67.2%.
Geography was little changed: the US accounted for 95% of revenue, US revenue rose 15% year over year, while international revenue fell 14%. One customer represented 11% of revenue. The company reaffirmed full-year 2026 revenue growth of about 19%, at the top of its 15–20% range.
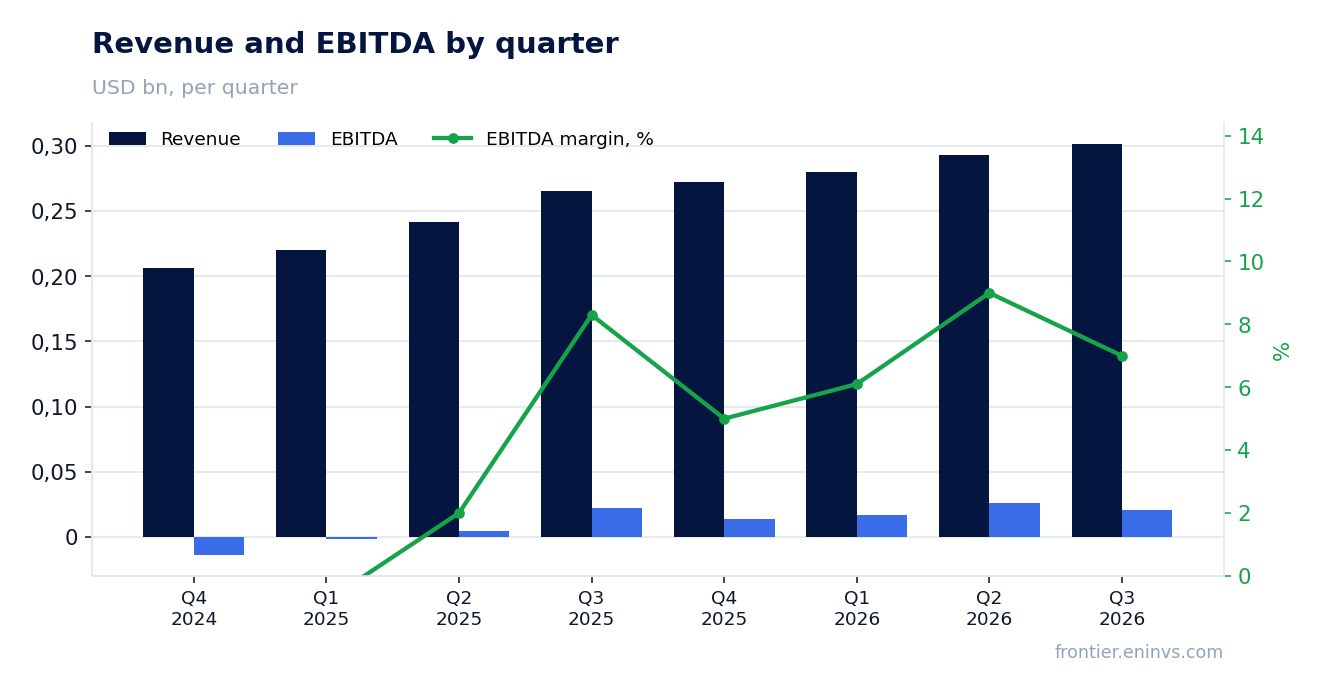
EBITDA margin compressed to 7.0% from 8.3% on higher memory costs, only partly offset by surcharges
Third-quarter EBITDA was $21.0 million, down 4.9% year over year even as revenue rose 13.7%. The EBITDA margin fell to 7.0% from 8.3%. Operating profit was $16.6 million versus $17.4 million a year earlier.
Margin pressure came from appliance cost of revenue: appliance GAAP gross margin fell to 50.6% from 56.1% a year earlier. The company names the cause directly – a rapid industry-wide rise in memory costs driven by AI data-centre construction. Memory surcharges were introduced, but they only partly offset the increase and are expected to be neutral to gross profit over time while remaining a headwind to margin.
Total GAAP gross margin fell to 53.3% from 57.3%, and non-GAAP to 53.5% from 57.7%. Software and service margin of 67.2% provided support. Non-GAAP operating expenses were $124.0 million, or 41% of revenue versus 42% a quarter earlier.
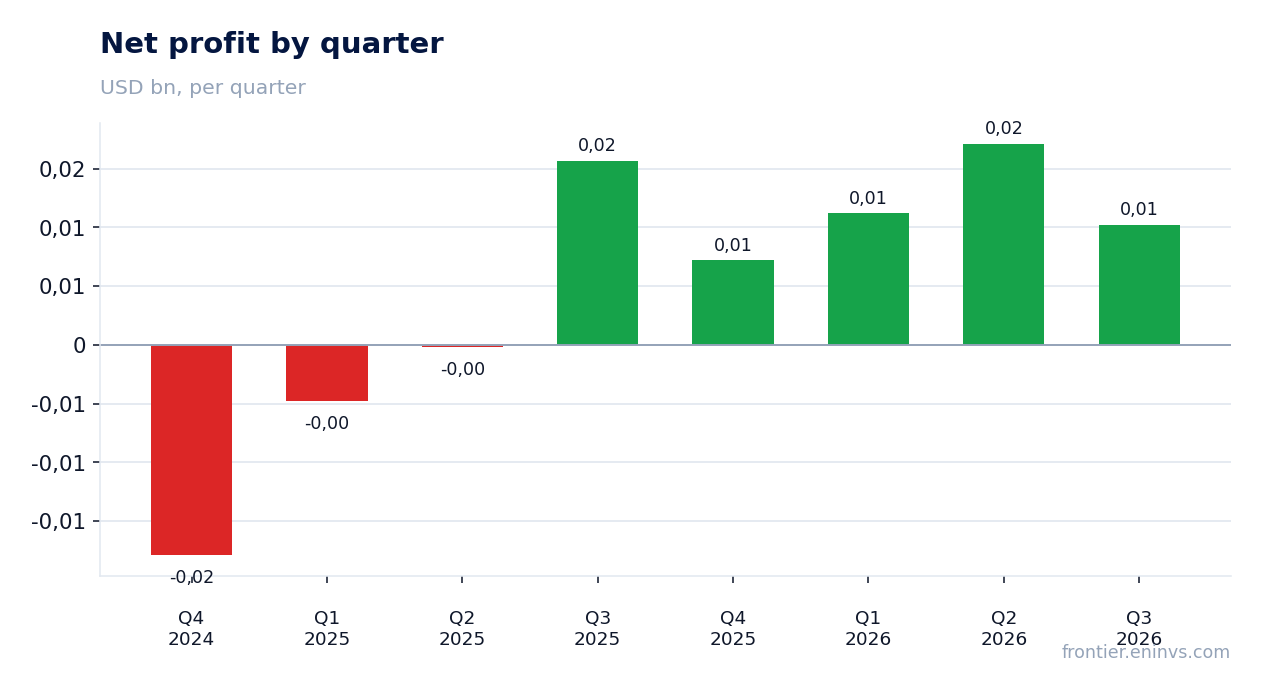
Net profit fell 34.7% to $10.2 million, though non-GAAP EPS of $0.44 stayed near the top of guidance
GAAP net profit was $10.2 million versus $15.7 million a year earlier, a 34.7% decline. The net margin fell to 3.4% from 5.9%. Diluted EPS was $0.16.
One-off items are visible in the profit: stock-based compensation was $21.0 million versus $16.7 million a quarter earlier. Excluding it, non-GAAP net profit was $28.5 million, down $2.1 million both sequentially and year over year, and non-GAAP EPS was $0.44, near the top of the $0.37–0.45 guidance range.
The company attributes the non-GAAP decline to the same cause – lower appliance gross margin on memory costs. The tax rate rose: income tax was $7.8 million versus $4.7 million a year earlier.
Free cash flow was $3.4 million on operating cash flow of $6.3 million and capex of $2.9 million
Third-quarter operating cash flow was $6.3 million, capex $2.9 million, and free cash flow $3.4 million. A quarter earlier operating cash flow was $16.5 million and free cash flow $11.9 million.
Cash flow was held back by inventory build: the company increased component and finished-goods inventory by $14.6 million to ensure supply continuity. Over nine months inventory rose $54.1 million. Inventory turns fell to 2.8 from 3.8 a year earlier, and the cash conversion cycle lengthened to 126 days from 108.
Cash and investments at quarter-end were $154.8 million, down $39.5 million sequentially. The decline reflects $50.0 million of share repurchases and capex, partly offset by operating inflows and $7.2 million of proceeds from employee benefit plans.
The company repurchased $50.0 million of shares in the quarter, and the board added $100 million to the buyback programme
In the third quarter CALIX, INC repurchased 1.4 million shares for $50.0 million. Year to date it has bought 6.3 million shares for $290.2 million. In October the board added $100 million to the buyback, bringing the remaining authorisation to $144 million.
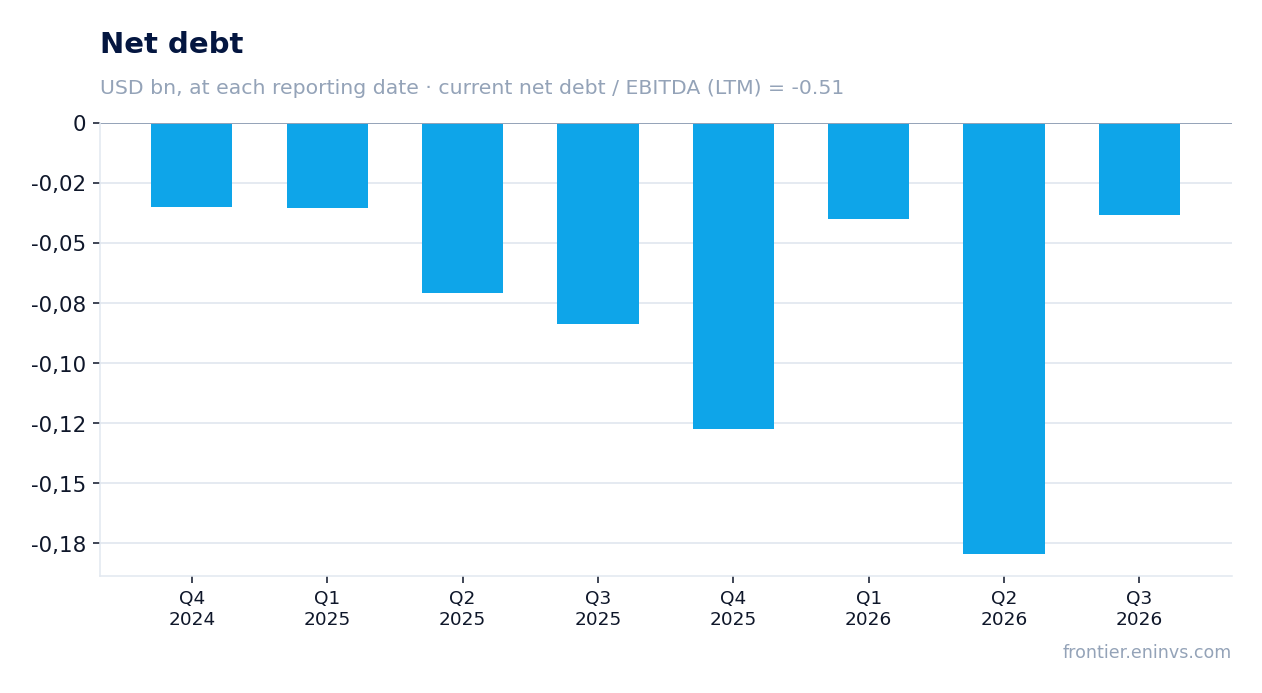
The buyback is funded from own resources: net debt at 26 September 2026 was -$38.3 million, meaning cash exceeds debt. Net debt to LTM EBITDA is -0.51. From 27 June net debt moved from -$0.2 billion to -$0.0 billion (+$0.1 billion).
The company pays no dividends and returns capital through buybacks. With quarterly free cash flow of $3.4 million, the $50.0 million buyback exceeds it but is covered by the cash cushion. The company expects operating and free cash flow to remain positive even with further inventory investment.
EV/EBITDA of 25.8 is below its own three-year average of 72.0, and the portal model implies +27% upside to fair value
With a market cap of $2,057.1 million, the LTM EV/EBITDA multiple is 25.8 against its own three-year average of 72.0 – 64% below. On this multiple the share is cheaper than its history. The LTM P/E is 45.0 and return on equity is 5.8%.
The portal model, which compares EBITDA growth times a target multiple against market cap, implies +27% upside to fair value. This is our own estimate, not a market consensus.
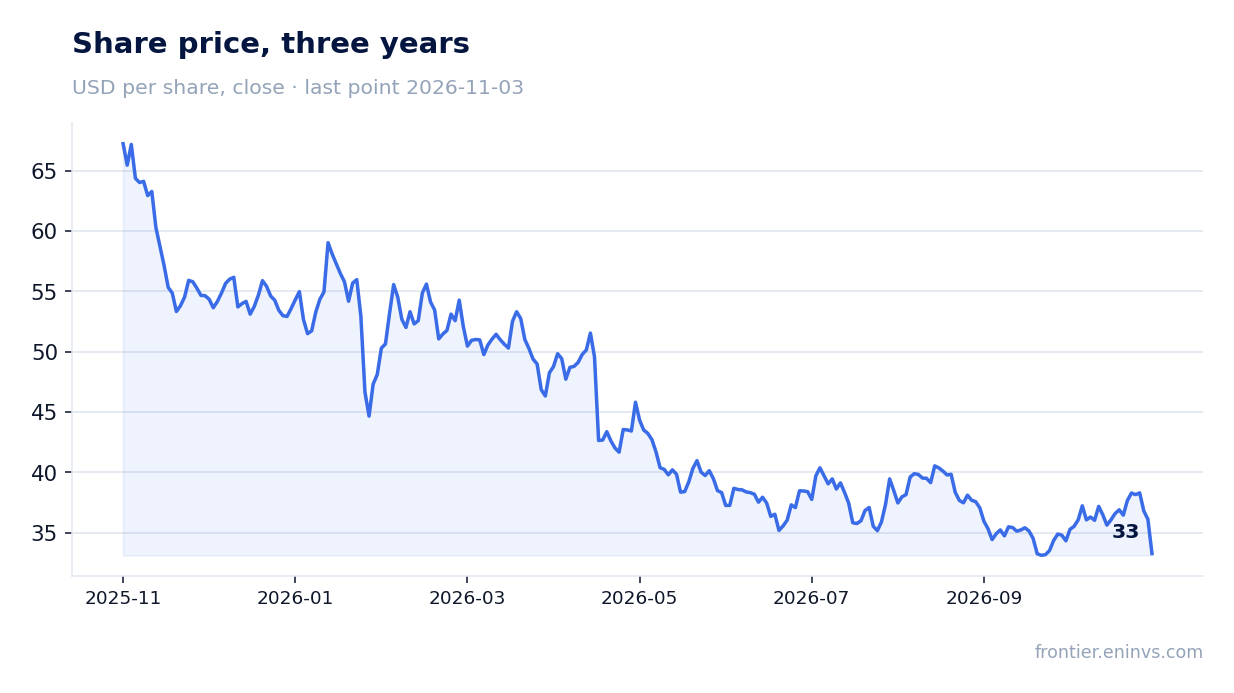
The lower multiple reflects both slowing revenue growth and margin compression. Since the report the share has fallen 9.6%, and on the report day it fell 1.9%. The market is repricing the company toward slower growth and a lower margin.
Valuation on the latest reported figures
| Metric | Value |
|---|---|
| Market cap | 2.06 bn USD |
| P/E (LTM) | 45.0 |
| EV/EBITDA (LTM) | 25.8 |
| P/B | 2.39 |
| Net debt / EBITDA (LTM) | -0.51 |
| Operating cash flow (LTM) | 0.08 bn |
| ROE | 5.8% |
| EV/EBITDA, 3-year average | 72.0 |
Bottom line
The quarter's strength remains record revenue of $301.7 million and record software and service revenue at a 67.2% margin. The weakness is the EBITDA margin compressing to 7.0% and net profit falling 34.7% on higher memory costs. The $50.0 million buyback supports the share but exceeds free cash flow. The question for a holder now is whether the company can hold the margin as growth slows to 13.7%. At a multiple of 25.8 against a historical 72.0 the share looks cheaper than its history, but slowing growth and margin pressure leave the assessment neutral.
Open the company's financial profile CALX →
See also: market overview · valuation map · stock screeners