CATERPILLAR INC: revenue up 17.3% but the share fell 9.3% – the market is looking at deceleration and the price
On 29 October CATERPILLAR INC reported third-quarter 2026 results: revenue of $20,682m (+17.3% year on year), operating profit of $4,214m and net profit of $3,287m (+43.0%). The net margin rose to 15.9% from 13.0% a year earlier, but top-line growth decelerated from 24.0% in the second quarter to 17.3% in the third, and the share lost 9.3% on the release day. At an EV/EBITDA of 22.0 against its own three-year average of 15.1 and with the portal model pointing to +25% upside, the share looks rather attractive, but on the strength of profit and cash flow rather than a cheap multiple.
Key takeaways
— Revenue added 17.3% on volume and price, but growth decelerated from 24.0% a quarter earlier
— The operating margin rose to 20.4% from 17.3% – volume and price did the work, not cost cuts
— The quarter's profit contains one-offs: $128m of IEEPA tariff recoveries and $41m of restructuring costs
— Operating cash flow for the quarter was $4,400m, and $1.9bn of it went to buybacks and dividends
— Leverage of 1.8x EBITDA LTM is a level, not a trend: the facts do not allow a comparison with the prior period
— A dividend yield of 0.97% on $0.7bn paid in the quarter is thin protection against a drawdown
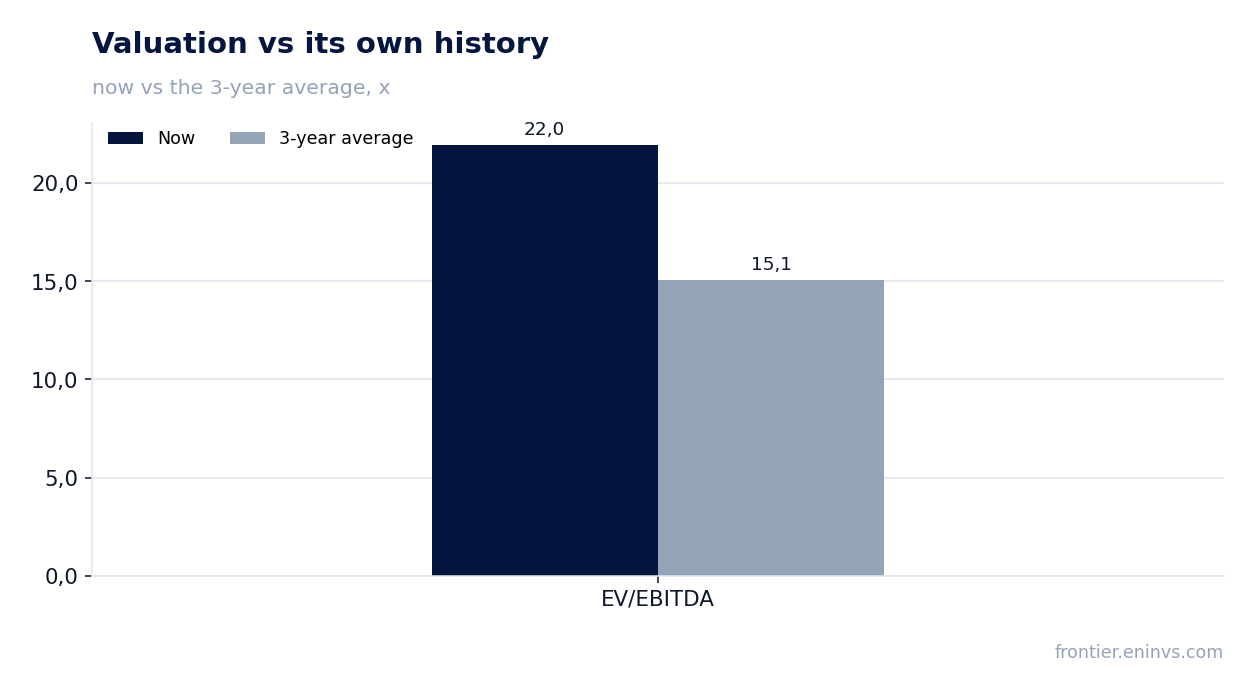
— EV/EBITDA of 22.0 against its own three-year average of 15.1 – the share is 46% more expensive than its own history
Attractiveness
Key figures, USD bn
| Metric | Q3 2025 | Q3 2026 | Change |
|---|---|---|---|
| Revenue | 17.6 | 20.7 | +17.3% |
| EBITDA | 3.62 | — | — |
| Operating profit | 3.05 | 4.21 | +38.1% |
| Net profit | 2.30 | 3.29 | +43.0% |
| Operating cash flow | 3.74 | 4.40 | +17.7% |
| Capex | 0.66 | — | — |
| EBITDA margin | 20.5% | — | — |
| Net margin | 13.0% | 15.9% | +2.9 pp |
Revenue added 17.3% on volume and price, but growth decelerated from 24.0% a quarter earlier
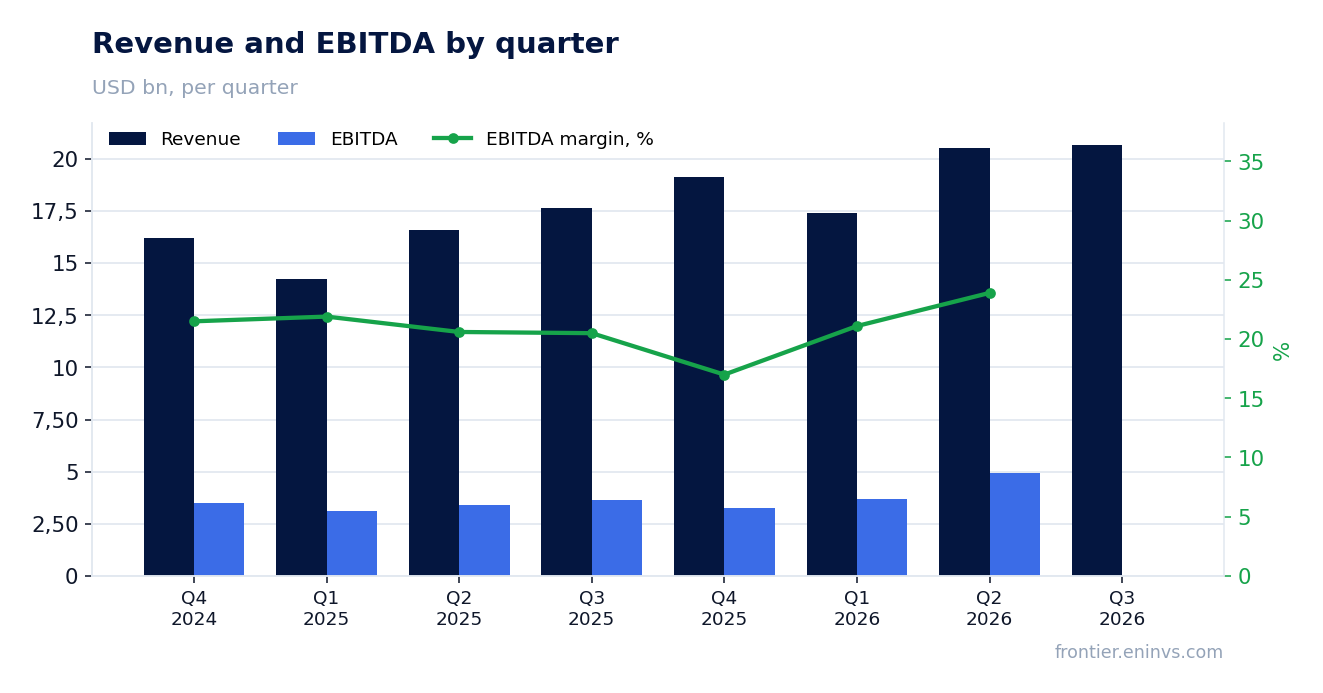
Third-quarter 2026 revenue was $20,682m against $17,638m a year earlier. The increase came from volume – up $2.2bn – and favourable price realisation, which added $663m. All three primary segments grew: Power & Energy by 18%, Construction Industries by 18% and Resource Industries by 15%.
The main engine is Power & Energy: power generation sales rose 30% on turbines and large reciprocating engines for data-centre applications. Construction Industries added 18% on equipment sales to end users, strongest in North America (+23%) and Latin America (+26%). Resource Industries grew 15%, but rail fell 5% on lower international locomotive deliveries.
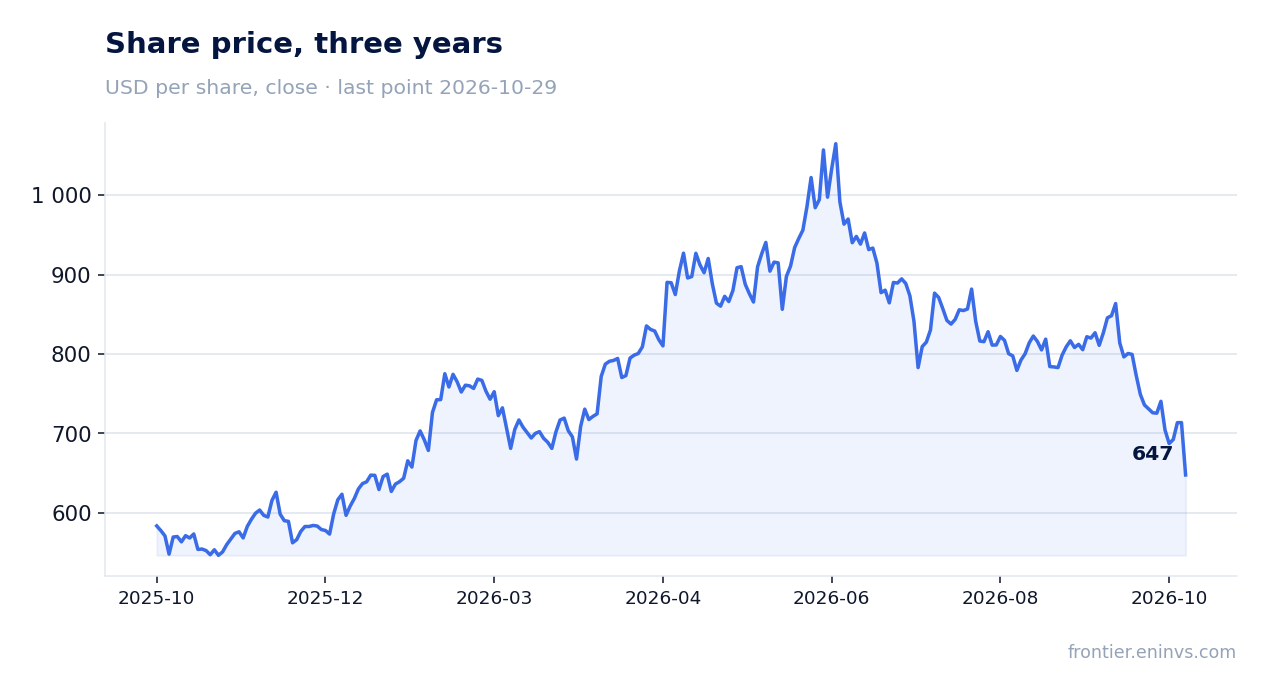
The deceleration is visible in the comparison: revenue grew 24.0% in the second quarter and 17.3% in the third. That is still double-digit growth, but the market marked the share down 9.3% on the release day, and deceleration is one of the reasons. The next quarter will show whether this was a one-off base effect or the start of a slower trajectory.
The operating margin rose to 20.4% from 17.3% – volume and price did the work, not cost cuts
Operating profit for the quarter was $4,214m against $3,052m a year earlier, up 38%. The margin rose to 20.4% from 17.3%. Cost of goods sold increased to $13,332m from $11,673m, while SG&A actually fell to $1,797m from $1,822m.
The margin gain came not from cost control but from operating leverage: volume and price added more than costs did. In Construction Industries segment profit rose 33% at a 22.9% margin against 20.4%; in Power & Energy it rose 31% at a 24.4% margin against 21.9%. Resource Industries stood still: a 13.5% margin against 13.6%, with profit up only 14% on 15% revenue growth.
The weak spot is manufacturing cost. In Construction Industries unfavourable costs were $252m, including higher freight; in Resource Industries $208m, mainly materials and tariffs. If commodity prices and tariffs stay high, the margin will rest on price rather than efficiency.
The quarter's profit contains one-offs: $128m of IEEPA tariff recoveries and $41m of restructuring costs
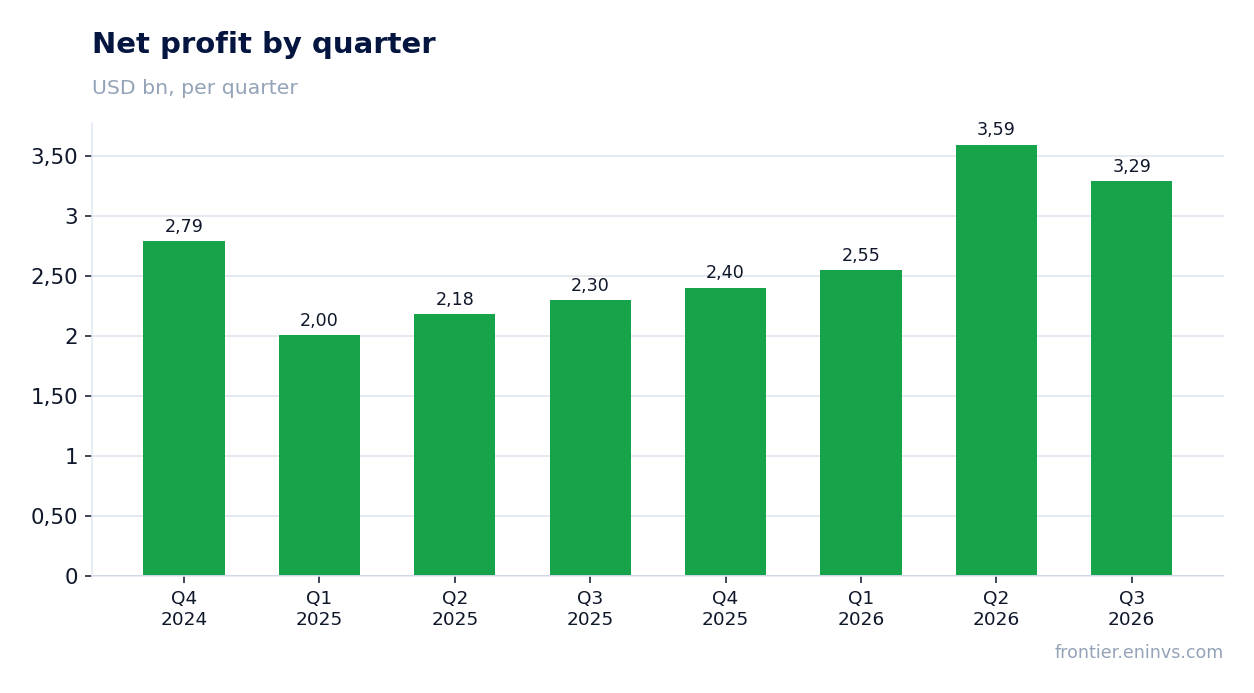
Net profit for the quarter was $3,287m against $2,300m a year earlier, up 43.0%. The net margin rose to 15.9% from 13.0%. Part of that gain is one-off items that will not repeat automatically.
Operating profit includes $128m of IEEPA tariff recoveries – income, not a result of core operations. At the same time the company booked $41m of restructuring costs, excluded from adjusted profit: adjusted earnings per share were $7.20 against $7.13 on a GAAP basis.
Another factor is the tax rate: the effective rate fell to 22.9% from 26.7%. A year earlier the base contained one-off tax items of $54m and $41m that are absent now. Without the tariff recoveries and at a normal rate, profit growth would have been more modest than 43.0%, and that is worth keeping in mind when judging the durability of the result.
Operating cash flow for the quarter was $4,400m, and $1.9bn of it went to buybacks and dividends
Operating cash flow for the third quarter was $4,400m. The company ended the quarter with $7.9bn of cash. For the nine months operating cash flow was $10,593m against $8,148m a year earlier, but inside it inventories rose $4,118m and trade receivables $3,761m – working capital absorbed part of the profit.
Buybacks took $1.2bn in the quarter and dividends $0.7bn. Over nine months buybacks were $7,745m against $4,850m a year earlier: the company is returning capital faster than a year ago. Nine-month capital expenditure was $2,012m excluding equipment leased to others, with a further $1,214m spent on leased equipment.
Cash flow covers both investment and payouts, but inventory growth is the thing to watch. If demand slows while the stock stays large, operating cash flow will compress faster than profit.
Leverage of 1.8x EBITDA LTM is a level, not a trend: the facts do not allow a comparison with the prior period
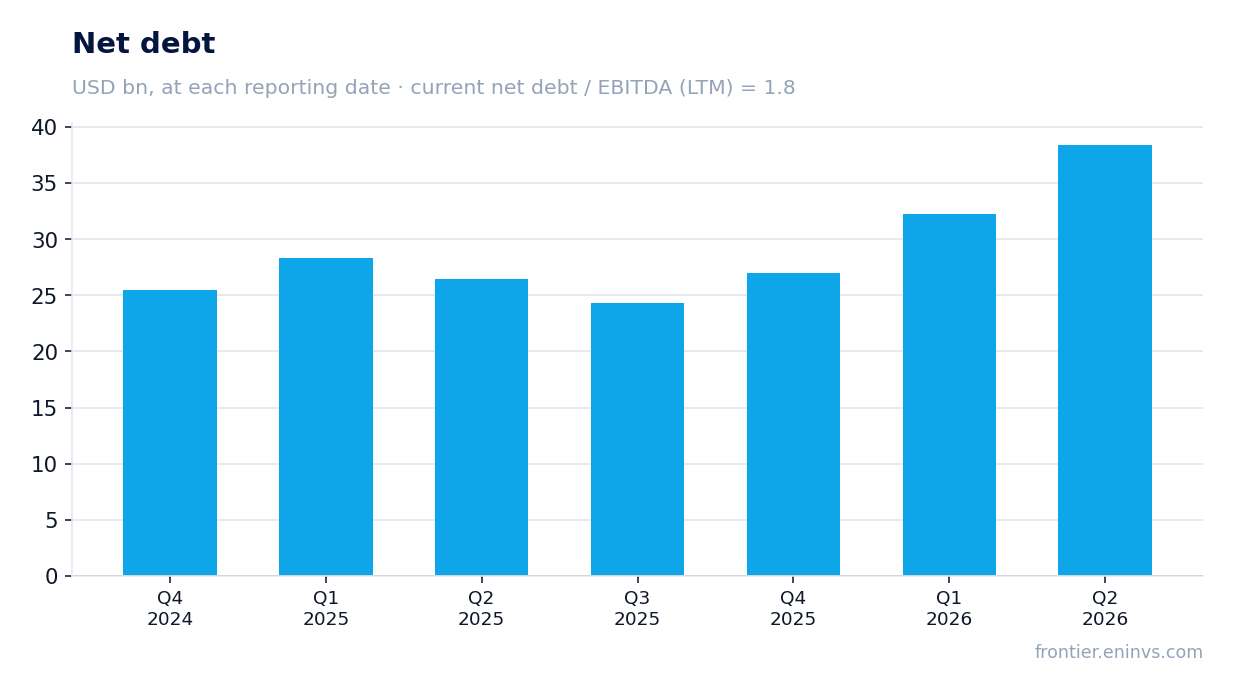
Net debt at the latest annual balance-sheet date was $26,958m, or 1.8x EBITDA over the last twelve months. That is moderate for an equipment maker with a finance arm, but the facts do not allow a comparison with the prior period, so this is a level only.
The finance arm is a separate story: its long-term debt rose to $21,552m from $20,018m at end-2025, with short-term borrowings of $4,855m. That funds the lease portfolio, not the industrial business. Machinery, Power & Energy debt is $10,614m long-term and $36m short-term, and it has barely moved since end-2025.
Interest expense outside the finance arm was $129m for the quarter, slightly below a year earlier. At this level of debt and interest, leverage does not look like a constraint on investment or buybacks.
A dividend yield of 0.97% on $0.7bn paid in the quarter is thin protection against a drawdown
Dividends took $0.7bn in the third quarter and $2,148m over nine months against $2,043m a year earlier. The trailing twelve-month dividend yield is 0.97%. That is a modest payout for a company earning $3,287m in a quarter: the payout ratio is low, and the dividend is not the main channel for returning capital.
The main channel is buybacks: $1.2bn in the quarter and $7,745m over nine months. Our estimate for the current year's dividend assumes the quarterly payout stays near $0.7bn; it hinges on profit and on how much capital the company directs to buybacks rather than the dividend.
A 0.97% yield does not protect against the 9.3% drawdown the share showed on the release day. For an investor holding the stock for the dividend, that is a weak argument: the payout is small relative to the price, and its growth depends on profit that contained one-off items.
EV/EBITDA of 22.0 against its own three-year average of 15.1 – the share is 46% more expensive than its own history
On the trailing twelve-month EV/EBITDA of 22.0, the share trades 46% above its own three-year average of 15.1. P/E LTM is 25.5. This is not a cheap valuation: the market is paying a premium to what the issuer itself commanded over the past three years.
At the same time the portal model, which sets EBITDA growth against a target multiple and market capitalisation, puts upside to fair value at +25%. That is our own estimate, not a market consensus. It rests on EBITDA growth and the current price, not on a re-rating back to the average.
The gap between the expensive multiple and the model's upside is simple: the model works from growth, the market from the multiple. If revenue growth keeps decelerating from 24.0% to 17.3% and below, the premium to history will compress. If growth holds at a double-digit pace, the current price will find support.
Valuation on the latest reported figures
| Metric | Value |
|---|---|
| Market cap | 301 bn USD |
| P/E (LTM) | 25.5 |
| EV/EBITDA (LTM) | 22.0 |
| P/B | 14.13 |
| Net debt / EBITDA (LTM) | 1.80 |
| Operating cash flow (LTM) | 14.3 bn |
| ROE | 75.5% |
| Dividend yield (12m) | 1.0% |
| EV/EBITDA, 3-year average | 15.1 |
Bottom line
What was genuinely strong was not just the headline: revenue grew 17.3%, the operating margin rose to 20.4% from 17.3%, and operating cash flow of $4,400m covered both investment and payouts. But part of the 43.0% profit gain came from the one-off $128m of tariff recoveries and the lower tax rate, while revenue growth decelerated from 24.0% to 17.3%. The real question for a holder is whether double-digit growth holds, because at an EV/EBITDA of 22.0 against its own 15.1 average the valuation leaves no room for error. The portal model's +25% upside is the only argument for the current price; without it the share would look expensive.
Open the company's financial profile CAT →
See also: market overview · valuation map · stock screeners