Chord Energy: revenue up 30%, but the entire profit gain was absorbed by debt rising to $2.2bn
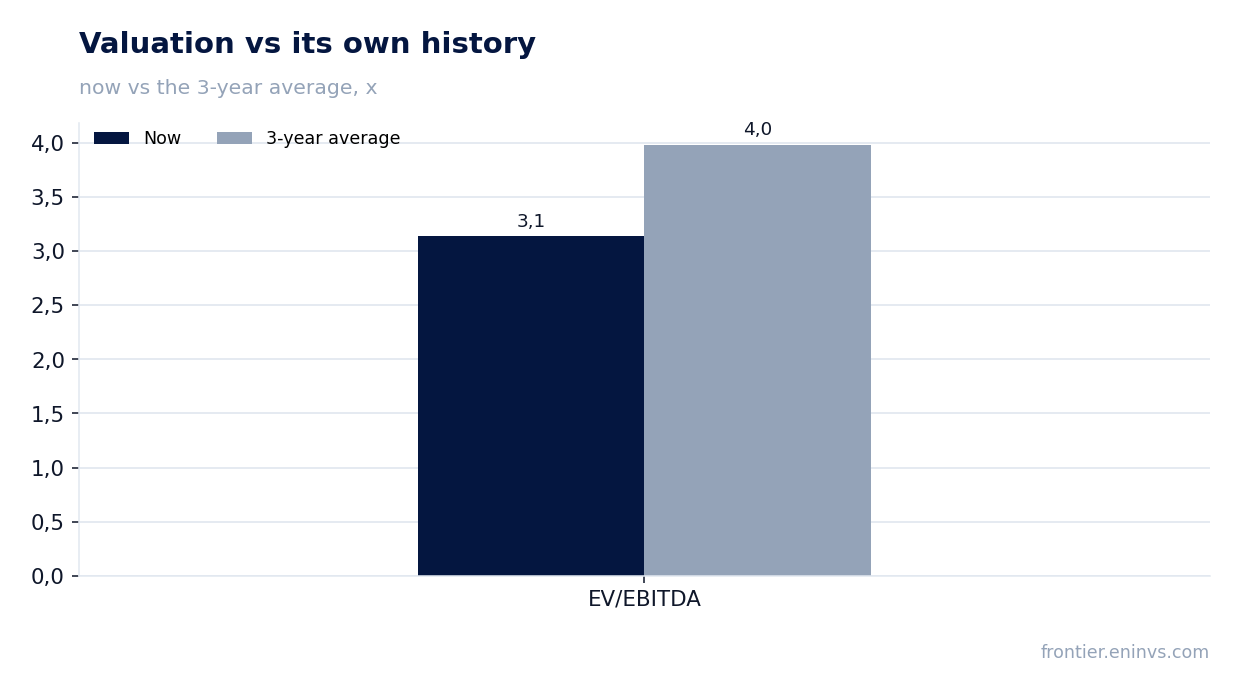
Chord Energy Corporation reported results for the third quarter of 2026. Revenue came in at $1,705.9m, EBITDA at $895.8m, and net profit at $181.6m. Year on year, revenue grew 30.0%, EBITDA 64.1%, and net profit 39.5%, while the EBITDA margin rose to 52.5% from 41.6%. At the same time, net debt reached $2,201.7m at the end of September, up from $1,004.1m on 30 June, and that is the main counterpoint of the report. The share looks rather attractive: the EV/EBITDA multiple of 3.1 is below its own three-year average of 4.0, leverage at 0.82x EBITDA is moderate, and a dividend yield of 3.9% supports the valuation.
Key takeaways
— Revenue grew 30.0% year on year, but the pace decelerated from 84.0% in the second quarter
— The EBITDA margin rose to 52.5% from 41.6% a year earlier
— Net profit added 39.5%, but its growth lagged EBITDA growth because of interest costs
— Net debt rose to $2,201.7m from $1,004.1m on 30 June
— Leverage at 0.82x EBITDA remains moderate
— The dividend yield of 3.9% rests on a payout backed by trailing-twelve-month profit
— EV/EBITDA of 3.1 is below its own three-year average of 4.0 – the share is cheaper than its own history
Attractiveness
Key figures, USD bn
| Metric | Q3 2025 | Q3 2026 | Change |
|---|---|---|---|
| Revenue | 1.31 | 1.71 | +30.0% |
| EBITDA | 0.55 | 0.90 | +64.1% |
| Operating profit | 0.17 | 0.51 | +195.7% |
| Net profit | 0.13 | 0.18 | +39.5% |
| Operating cash flow | 0.56 | — | — |
| Capex | 0.34 | — | — |
| EBITDA margin | 41.6% | 52.5% | +10.9 pp |
| Net margin | 9.9% | 10.6% | +0.7 pp |
Revenue grew 30.0% year on year, but the pace decelerated from 84.0% in the second quarter
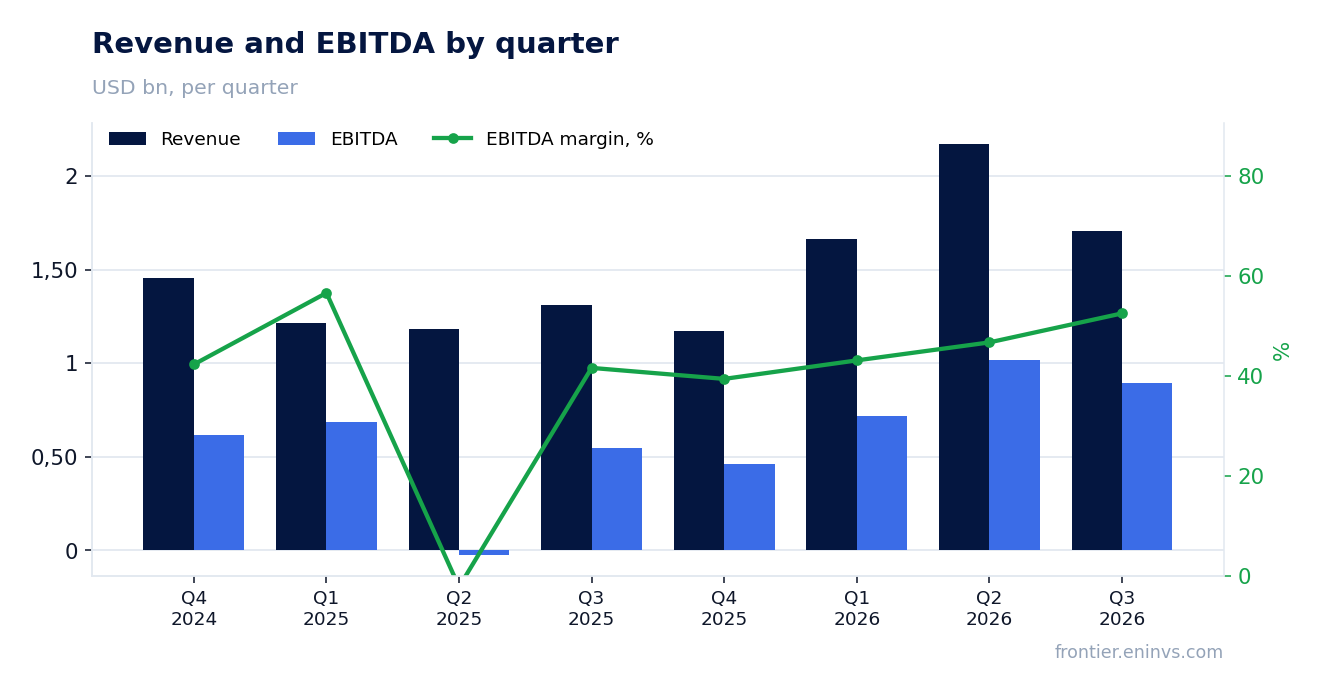
Third-quarter 2026 revenue came in at $1,705.9m, 30.0% higher than a year earlier. That is solid growth, but it is more modest than the 84.0% seen in the second quarter – the pace decelerated. The deceleration is explained by the high base of the second quarter, when revenue reached $2,172.7m.
The sequential comparison shows revenue declining from the second quarter, even though it is still growing year on year. For assessing sustainability, it matters that the company held revenue above $1.7bn for a second consecutive quarter – a level not seen in 2025.
The facts do not disclose what drove the increase: there is no data on production, realised prices or sales mix. We therefore limit ourselves to stating that revenue grew 30.0% but the pace decelerated, and the next report will show whether the second quarter was a one-off peak or a new level.
The EBITDA margin rose to 52.5% from 41.6% a year earlier
Third-quarter EBITDA came in at $895.8m, 64.1% higher than a year earlier. The EBITDA margin reached 52.5% against 41.6% a year earlier – an increase of almost 11 percentage points. Such a jump in margin on 30.0% revenue growth means costs grew more slowly than revenue.
Operating profit was $505.0m, and the gap between EBITDA and operating profit – about $390m – is depreciation. That is a typical structure for an extractive company with large assets, and it does not change the conclusion about a strong margin.
The sustainability of the 52.5% margin is the key question. The facts contain no cost breakdown, so it is impossible to say which component drove the increase. If the margin holds above 50%, it will support both profit and the dividend; if it is a one-off effect, next quarter's profit will be lower.
Net profit added 39.5%, but its growth lagged EBITDA growth because of interest costs
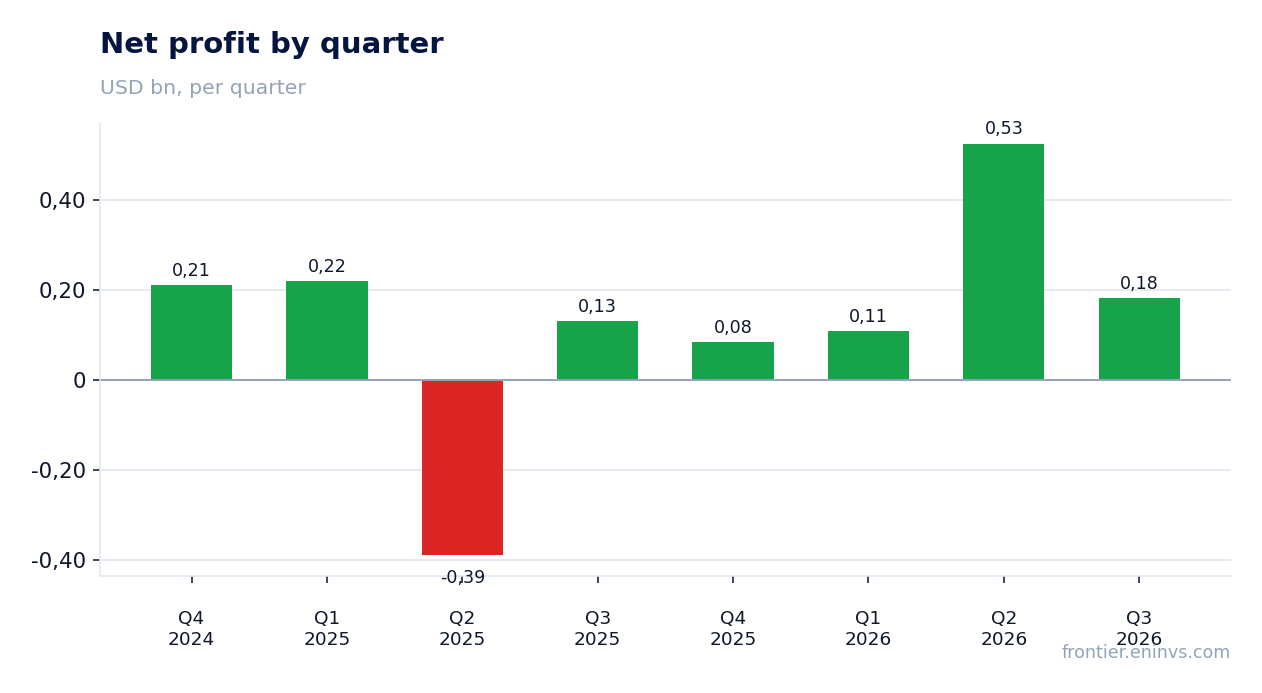
Third-quarter net profit came in at $181.6m, 39.5% higher than a year earlier. The growth is solid, but it noticeably lags EBITDA growth of 64.1%. The reason is interest costs: with net debt of $2,201.7m, debt servicing absorbs part of the operating result.
The net margin rose to 10.6% from 9.9% a year earlier. The gap between the 52.5% EBITDA margin and the 10.6% net margin is explained by depreciation, interest and taxes – a structure typical of capital-intensive extraction.
Over the trailing twelve months, net profit was $899.8m. That base matters for the dividend: the payout rests on profit, not EBITDA, and interest costs directly reduce what is available to shareholders.
Net debt rose to $2,201.7m from $1,004.1m on 30 June
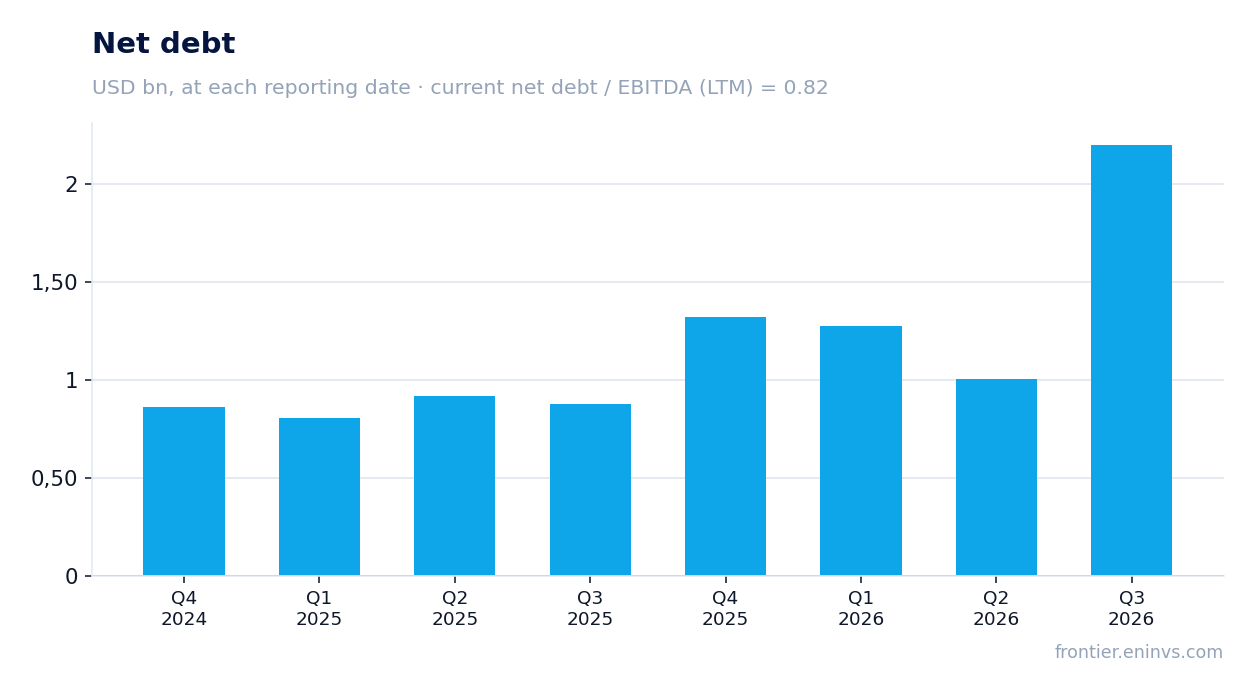
Net debt at 30 September 2026 was $2,201.7m against $1,004.1m on 30 June – an increase of $1.2bn over the quarter. A year earlier, on 30 September 2025, net debt was $880.0m, so over 12 months it rose by $1.3bn. This is the most notable change in the report.
A $1.2bn increase in net debt over a quarter, against EBITDA of $895.8m, means the company raised funds comparable to quarterly EBITDA. The facts do not disclose the purpose of the borrowing – it could be acquisition financing, working-capital replenishment or refinancing. Without that data, the cause cannot be named.
Leverage nevertheless remains moderate: net debt to trailing-twelve-month EBITDA is 0.82. That is a comfortable level that leaves room for manoeuvre. But the absolute $1.2bn increase in debt over the quarter is a signal to watch in the next report.
Leverage at 0.82x EBITDA remains moderate
The ratio of net debt to trailing-twelve-month EBITDA is 0.82. With trailing-twelve-month EBITDA of $2,699.9m and net debt of $2,201.7m, this means the company could repay its debt in less than a year of operating profit.
Moderate leverage matters for the dividend: it means interest costs do not consume all profit and there is room for payouts. At the same time, a $1.2bn increase in debt over the quarter is a move towards higher leverage, even if the current level is comfortable.
The facts do not contain an earlier value of this ratio, so it cannot be claimed that leverage rose or fell. One can only state the level of 0.82 and that absolute debt increased. Assessing the trend requires the next report.
The dividend yield of 3.9% rests on a payout backed by trailing-twelve-month profit
The trailing-twelve-month dividend yield is 3.9%. The payout rests on profit: over the trailing twelve months net profit was $899.8m, and the dividend is financed from it. With a market capitalisation of $7,227.2m, dividends paid over the year amount to about $284m – consistent with a 3.9% yield.
Our estimate for the current year's dividend is a yield of about 3.9%, and it hinges on two things: trailing-twelve-month profit and the payout ratio the company maintains. If quarterly profit of $181.6m turns out below the base for coming quarters, the payout could shrink. Rising interest costs on $2,201.7m of debt are the main risk to the dividend.
A 3.9% yield is more modest than what risk-free instruments offer, but for an extractive company with moderate leverage of 0.82x EBITDA it is an adequate level. The dividend is not the main argument for the share – rather a support for the valuation.
What would make the payout smaller: further growth in debt, if it leads to higher interest costs, and a margin falling below 50%. If the margin holds and debt stabilises, the dividend will stay at its current level.
EV/EBITDA of 3.1 is below its own three-year average of 4.0 – the share is cheaper than its own history
The trailing-twelve-month EV/EBITDA multiple is 3.1 against its own three-year average of 4.0 – 21% below. This means the share trades cheaper than it usually has over the past three years. The trailing-twelve-month P/E is 8.0, which looks inexpensive given net profit of $899.8m and a market capitalisation of $7,227.2m.
The lower multiple relative to history is explained by EBITDA growth: over the trailing twelve months it was $2,699.9m, and the denominator grew faster than the market valuation. At the same time, the rise in debt to $2,201.7m increases EV and partly offsets the effect.
Return on equity is 8.7%, which is not high, but for capital-intensive extraction it is a normal level. The main argument for the valuation is the multiple below its own history; the main risk is further debt growth, which would increase EV and lift the multiple.
Valuation on the latest reported figures
| Metric | Value |
|---|---|
| Market cap | 7.23 bn USD |
| P/E (LTM) | 8.0 |
| EV/EBITDA (LTM) | 3.1 |
| P/B | 0.89 |
| Net debt / EBITDA (LTM) | 0.82 |
| ROE | 8.7% |
| Dividend yield (12m) | 3.9% |
| EV/EBITDA, 3-year average | 4.0 |
Bottom line
The strong side of the report is the margin: EBITDA grew 64.1% and the margin rose to 52.5% from 41.6%. The weak side is debt: net debt rose to $2,201.7m from $1,004.1m on 30 June, absorbing part of the profit growth. Net profit grew 39.5% but lagged EBITDA because of interest costs. The valuation supports the share: EV/EBITDA of 3.1 is below its own three-year average of 4.0, leverage at 0.82x EBITDA is moderate, and the dividend yield is 3.9%. The key question for a holder is whether the margin holds above 50% and whether debt growth stops; the answer will determine whether the share stays cheap.
Open the company's financial profile CHRD →
See also: market overview · valuation map · stock screeners