Canadian Natural Resources: oil rose 31.7%, yet EBITDA came in 6.6% below what the price implied
Contents
On 11 November Canadian Natural Resources Limited released its third-quarter 2026 results. The average WTI price in the period was USD 85.4 against USD 64.9 a year earlier (+31.7%), which at unchanged volumes and costs would have produced revenue of 8,795.5m and EBITDA of 4,650.6m on our calculation. The company reported revenue of 9,006.3m, EBITDA of 4,345.8m and net profit of 2,109.9m: it beat the price-implied revenue by 2.4% but fell 6.6% short on EBITDA. Our conclusion: rather unattractive – on the portal's spot model the share trades 12% above its modelled fair value. Our view: the share is rather unattractive at the current price; upside on the portal model -12%.
Our view: is there upside
Our view in numbers
| Metric | Our read |
|---|---|
| Verdict | Rather unattractive |
| Upside on the portal model | -12% |
| How the model works | spot model: EBITDA re-priced to current commodity prices at the target EV/EBITDA, against market cap |
| EV/EBITDA now and 3-year average | 6.7 vs 6.4 – a 6% premium to its history |
| Dividend yield, 12m | 2.8% |
| Net debt / EBITDA | 0.51 – low leverage |
| Strongest case for | The balance sheet withstands a pullback: debt at 0.51x LTM EBITDA and quarterly operating cash flow of 4,935.0m cover both dividends and production maintenance. |
| Strongest case against | With oil 31.7% more expensive year on year, EBITDA trailed the price-implied level by 6.6%, and the spot model shows minus 12% to fair value. |
| What would change the view | The verdict would improve by one step if EBITDA stopped trailing the price-implied model – for instance through lower unit costs or oil sustainably above USD 90. |
Key takeaways
— Oil averaged USD 85.4 a barrel in the quarter against USD 64.9 a year earlier, but was 7.9% cheaper than in the previous quarter
— Revenue beat the price-implied model by 2.4%, while EBITDA fell 6.6% short – costs and realisations ate the gap
— Quarter on quarter revenue came in 9.6% below the price-implied level and EBITDA missed it by 14.4%
— The EBITDA margin rose to 48.3% from 39.8%, but that is the consequence of expensive oil, not of efficiency gains
— Net profit rose 4.9-fold to 2,109.9m, and it contains no one-off items that would need stripping out
— Leverage of 0.51x LTM EBITDA is a level that holds both at today's prices and through a pullback
— A 2.8% dividend yield on a 10.0x LTM P/E leaves no cushion: on EV/EBITDA the share is 6% above its own three-year history
Key figures, USD bn
| Metric | Q3 2025 | Q3 2026 | Change |
|---|---|---|---|
| Revenue | 6.89 | 9.01 | +30.7% |
| EBITDA | 2.74 | 4.35 | +58.3% |
| Operating profit | 0.42 | 2.90 | +591.6% |
| Net profit | 0.43 | 2.11 | +385.7% |
| Operating cash flow | 2.85 | 4.94 | +73.0% |
| EBITDA margin | 39.8% | 48.3% | +8.5 pp |
| Net margin | 6.3% | 23.4% | +17.1 pp |
Oil averaged USD 85.4 a barrel in the quarter against USD 64.9 a year earlier, but was 7.9% cheaper than in the previous quarter
Price is the main driver of this report. Average WTI in the third quarter of 2026 was USD 85.4 against USD 64.9 a year earlier, up 31.7%. Oil accounts for 89% of revenue in the portal's model, so this shift alone explains most of the year-on-year move.
The sequence matters more than the annual comparison. In the second quarter a barrel cost USD 92.8, so over three months oil fell 7.9%. That, not a deterioration in operations, sits behind the quarterly decline in revenue and EBITDA.
US gas averaged USD 2.893 per MMBtu against USD 3.083 a year earlier, down 6.2%, and was almost flat against the previous quarter. Gas accounts for 8% of revenue, so its effect on the overall result is small.
As of 11 November WTI trades at USD 86.6, 1.5% above the reported-period average, and Henry Hub at USD 3.31, 14.4% higher. The price backdrop has not worsened since the release, but it offers no fresh impulse either.
Commodity prices: period average and now
| Benchmark | Year ago | Q3 2026 | YoY | Spot 2026-11-11 |
|---|---|---|---|---|
| WTI, USD | 64,9 | 85,4 | +31,7% | 86,6 |
| Henry Hub, USD | 3,08 | 2,89 | -6,2% | 3,31 |
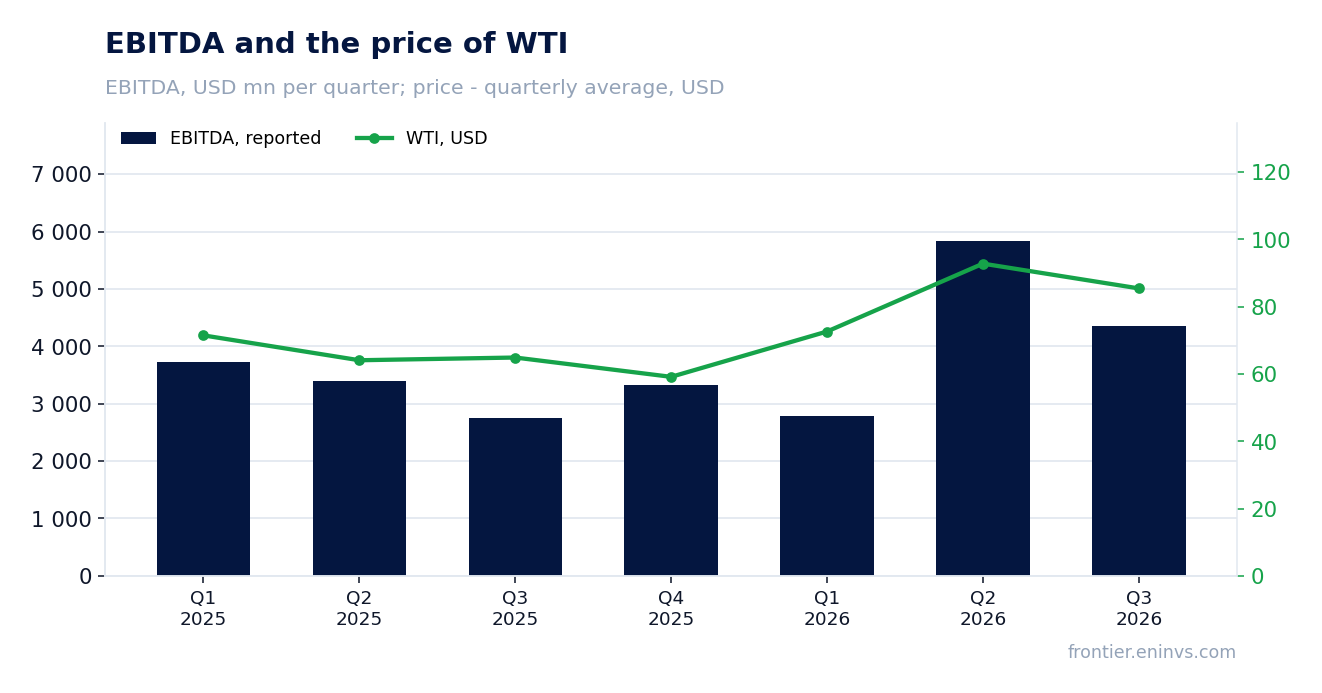
Revenue beat the price-implied model by 2.4%, while EBITDA fell 6.6% short – costs and realisations ate the gap
Holding third-quarter 2025 volumes and non-commodity costs and moving only prices, revenue would have been 8,795.5m and EBITDA 4,650.6m. The company actually reported 9,006.3m and 4,345.8m: plus 210.8m on revenue, minus 304.8m on EBITDA.
That combination means the company sold more than the price alone implied but earned less per unit. The facts do not disclose the causes: it could be realisations below benchmark WTI, higher unit costs, or both. There is no basis to assert one of them.
The annual dynamics look strong: revenue +30.7%, EBITDA +58.3%, net profit +385.7%. But this is primarily a base effect – a year earlier oil cost USD 64.9 and the quarter was weak.
What matters to an investor is the gap to the price-implied model. When the price rises 31.7% and EBITDA trails the price-implied level by 6.6%, the company gives up part of the price premium, and a repeat would cap profit growth in the next cycle.
What the prices implied and what the company earned
| Base (Q3 2025) | Implied at period prices | Reported | Reported vs implied | |
|---|---|---|---|---|
| Revenue, USD mn | 6 890 | 8 796 | 9 006 | +2,4% |
| EBITDA, USD mn | 2 745 | 4 651 | 4 346 | -6,6% |
Revenue and EBITDA by quarter
| Period | Measure | bn USD |
|---|---|---|
| Q1 2025 | Revenue | 7.810446 |
| Q2 2025 | Revenue | 6.253862 |
| Q3 2025 | Revenue | 6.889584 |
| Q4 2025 | Revenue | 6.889653 |
| Q1 2026 | Revenue | 7.653479999999999 |
| Q2 2026 | Revenue | 10.731448 |
| Q3 2026 | Revenue | 9.006272000000001 |
| Q1 2025 | EBITDA | 3.73065 |
| Q2 2025 | EBITDA | 3.4023280000000002 |
| Q3 2025 | EBITDA | 2.7446840000000003 |
| Q4 2025 | EBITDA | 3.3283270000000003 |
| Q1 2026 | EBITDA | 2.7788999999999997 |
| Q2 2026 | EBITDA | 5.844384 |
| Q3 2026 | EBITDA | 4.345791999999999 |
EBITDA margin
| Period | Measure | % |
|---|---|---|
| Q1 2025 | EBITDA margin | 47.8 |
| Q2 2025 | EBITDA margin | 54.4 |
| Q3 2025 | EBITDA margin | 39.8 |
| Q4 2025 | EBITDA margin | 48.3 |
| Q1 2026 | EBITDA margin | 36.3 |
| Q2 2026 | EBITDA margin | 54.5 |
| Q3 2026 | EBITDA margin | 48.3 |
Quarter on quarter revenue came in 9.6% below the price-implied level and EBITDA missed it by 14.4%
The quarterly dynamics are more telling than the annual ones. At second-quarter volumes and costs and third-quarter prices, revenue would have been 9,963.3m and EBITDA 5,076.2m. Actuals were 9,006.3m and 4,345.8m, i.e. minus 957.0m and minus 730.4m.
Part of that gap is the price itself: oil fell 7.9%, and the price effect in the model is negative – minus 768.2m of revenue. But EBITDA fell more than a price shift alone implies – 14.4% against the benchmark.
Year on year revenue grew 30.7% after 71.6% in the second quarter. That is a deceleration, and an expected one: the quarters compare against different bases, and the second quarter of 2026 had a higher price.
The quarterly decline is not a warning signal in itself – it is mostly price. But the fact that EBITDA trails the price benchmark in the quarterly comparison too confirms the issue is in unit economics, not only in the market.
The EBITDA margin rose to 48.3% from 39.8%, but that is the consequence of expensive oil, not of efficiency gains
The EBITDA margin in the reported quarter was 48.3% against 39.8% a year earlier. The 8.5 percentage-point gain is a direct consequence of oil rising 31.7% while production and preparation costs do not scale with the price.
The net margin rose to 23.4% from 6.3%. The effect is stronger here because a year earlier profit was depressed by a low price, and operating leverage at an upstream producer is high.
The margin does not show that the company became more efficient. On the contrary, EBITDA trailed the price-implied level by 6.6% – meaning unit costs or realisations consumed part of the price gain. The margin rose because the price rose, not because the economics of a barrel improved.
For the next quarter this means: if oil stays near USD 86.6, the margin will hold at a high level but will not improve. Further gains can only come from unit costs.
Net profit rose 4.9-fold to 2,109.9m, and it contains no one-off items that would need stripping out
Net profit in the third quarter of 2026 was 2,109.9m against 434.4m a year earlier, a 4.9-fold increase. Operating profit was 2,904.0m and EBITDA 4,345.8m, with depreciation of 1,441.8m separating the two.
The gap between operating and net profit – 794.1m – comes from items below the operating line: interest, other income and expenses, taxes. These are outside EBITDA, so the 4.9-fold profit growth is primarily an operating result, not one-off income.
The year-ago base was weak: in the third quarter of 2025 net profit was only 434.4m on revenue of 6,889.6m. The low price then compressed the margin to 6.3%, and the current 4.9-fold rise is a recovery, not a new level.
Over the trailing twelve months net profit was 10,144.7m. That is a level earned with oil averaging above USD 80, and if the price falls it will compress faster than revenue.
Valuation vs its own history
now vs the 3-year average
| Period | Measure | × |
|---|---|---|
| EV/EBITDA | Now | 6.732814993929866 |
| EV/EBITDA | 3-year average | 6.351576399315313 |
Leverage of 0.51x LTM EBITDA is a level that holds both at today's prices and through a pullback
Net debt at 30 September 2026 was 8,530.4m against trailing-twelve-month EBITDA of 16,728.3m. The ratio is 0.51, a low level for an upstream producer: annual EBITDA covers debt almost twice over.
Operating cash flow was 4,935.0m in the reported quarter and 14,927.5m over twelve months. That comfortably covers debt service, dividends and production maintenance.
On the portal's spot model at current prices EBITDA would be 18,691.2m and the debt ratio 0.46. Even on a higher base debt stays small, and at a price pullback to USD 65 the ratio would not exceed 1.0.
Leverage creates no risk for the shareholder. But it creates no upside either: it is not the lever that can re-rate the share.
Share price, three years
close, last point 2026-11-10
| Period | Measure | USD per share |
|---|---|---|
| 2025-11-11 | Closing price | 32.38999938964844 |
| 2025-11-12 | Closing price | 32.439998626708984 |
| 2025-11-13 | Closing price | 32.54999923706055 |
| 2025-11-14 | Closing price | 33.56999969482422 |
| 2025-11-17 | Closing price | 33.33000183105469 |
| 2025-11-18 | Closing price | 34.04999923706055 |
| 2025-11-19 | Closing price | 34.0 |
| 2025-11-20 | Closing price | 33.970001220703125 |
| 2025-11-21 | Closing price | 33.43000030517578 |
| 2025-11-24 | Closing price | 32.93000030517578 |
| 2025-11-25 | Closing price | 33.2400016784668 |
| 2025-11-26 | Closing price | 33.31999969482422 |
| 2025-11-28 | Closing price | 33.77000045776367 |
| 2025-12-01 | Closing price | 34.04999923706055 |
| 2025-12-02 | Closing price | 33.54999923706055 |
| 2025-12-03 | Closing price | 34.130001068115234 |
| 2025-12-04 | Closing price | 34.459999084472656 |
| 2025-12-05 | Closing price | 34.65999984741211 |
| 2025-12-08 | Closing price | 34.06999969482422 |
| 2025-12-09 | Closing price | 33.72999954223633 |
| 2025-12-10 | Closing price | 33.720001220703125 |
| 2025-12-11 | Closing price | 33.13999938964844 |
| 2025-12-12 | Closing price | 32.9900016784668 |
| 2025-12-15 | Closing price | 32.41999816894531 |
| 2025-12-16 | Closing price | 31.25 |
| 2025-12-17 | Closing price | 31.860000610351562 |
| 2025-12-18 | Closing price | 31.489999771118164 |
| 2025-12-19 | Closing price | 31.899999618530273 |
| 2025-12-22 | Closing price | 32.33000183105469 |
| 2025-12-23 | Closing price | 32.83000183105469 |
| 2025-12-24 | Closing price | 32.970001220703125 |
| 2025-12-26 | Closing price | 32.790000915527344 |
| 2025-12-29 | Closing price | 33.18000030517578 |
| 2025-12-30 | Closing price | 33.90999984741211 |
| 2025-12-31 | Closing price | 33.849998474121094 |
| 2026-01-02 | Closing price | 34.31999969482422 |
| 2026-01-05 | Closing price | 32.22999954223633 |
| 2026-01-06 | Closing price | 31.59000015258789 |
| 2026-01-07 | Closing price | 30.59000015258789 |
| 2026-01-08 | Closing price | 31.549999237060547 |
| 2026-01-09 | Closing price | 32.08000183105469 |
| 2026-01-12 | Closing price | 32.29999923706055 |
| 2026-01-13 | Closing price | 33.150001525878906 |
| 2026-01-14 | Closing price | 34.619998931884766 |
| 2026-01-15 | Closing price | 34.099998474121094 |
| 2026-01-16 | Closing price | 34.349998474121094 |
| 2026-01-20 | Closing price | 34.43000030517578 |
| 2026-01-21 | Closing price | 35.970001220703125 |
| 2026-01-22 | Closing price | 35.4900016784668 |
| 2026-01-23 | Closing price | 36.13999938964844 |
| 2026-01-26 | Closing price | 36.04999923706055 |
| 2026-01-27 | Closing price | 36.66999816894531 |
| 2026-01-28 | Closing price | 37.099998474121094 |
| 2026-01-29 | Closing price | 37.869998931884766 |
| 2026-01-30 | Closing price | 37.209999084472656 |
| 2026-02-02 | Closing price | 36.5 |
| 2026-02-03 | Closing price | 37.47999954223633 |
| 2026-02-04 | Closing price | 38.529998779296875 |
| 2026-02-05 | Closing price | 37.88999938964844 |
| 2026-02-06 | Closing price | 39.099998474121094 |
| 2026-02-09 | Closing price | 39.16999816894531 |
| 2026-02-10 | Closing price | 39.09000015258789 |
| 2026-02-11 | Closing price | 40.630001068115234 |
| 2026-02-12 | Closing price | 39.9900016784668 |
| 2026-02-13 | Closing price | 40.68000030517578 |
| 2026-02-17 | Closing price | 40.59000015258789 |
| 2026-02-18 | Closing price | 41.65999984741211 |
| 2026-02-19 | Closing price | 42.5 |
| 2026-02-20 | Closing price | 42.400001525878906 |
| 2026-02-23 | Closing price | 42.34000015258789 |
| 2026-02-24 | Closing price | 42.59000015258789 |
| 2026-02-25 | Closing price | 42.56999969482422 |
| 2026-02-26 | Closing price | 43.09000015258789 |
| 2026-02-27 | Closing price | 43.77000045776367 |
| 2026-03-02 | Closing price | 44.349998474121094 |
| 2026-03-03 | Closing price | 44.130001068115234 |
| 2026-03-04 | Closing price | 44.18000030517578 |
| 2026-03-05 | Closing price | 45.31999969482422 |
| 2026-03-06 | Closing price | 46.310001373291016 |
| 2026-03-09 | Closing price | 46.2400016784668 |
| 2026-03-10 | Closing price | 45.720001220703125 |
| 2026-03-11 | Closing price | 47.2599983215332 |
| 2026-03-12 | Closing price | 48.560001373291016 |
| 2026-03-13 | Closing price | 48.439998626708984 |
| 2026-03-16 | Closing price | 48.790000915527344 |
| 2026-03-17 | Closing price | 48.97999954223633 |
| 2026-03-18 | Closing price | 49.099998474121094 |
| 2026-03-19 | Closing price | 50.54999923706055 |
| 2026-03-20 | Closing price | 49.02000045776367 |
| 2026-03-23 | Closing price | 48.380001068115234 |
| 2026-03-24 | Closing price | 49.02000045776367 |
| 2026-03-25 | Closing price | 49.18000030517578 |
| 2026-03-26 | Closing price | 48.66999816894531 |
| 2026-03-27 | Closing price | 50.09000015258789 |
| 2026-03-30 | Closing price | 49.369998931884766 |
| 2026-03-31 | Closing price | 48.72999954223633 |
| 2026-04-01 | Closing price | 46.560001373291016 |
| 2026-04-02 | Closing price | 47.529998779296875 |
| 2026-04-06 | Closing price | 48.25 |
| 2026-04-07 | Closing price | 49.15999984741211 |
| 2026-04-08 | Closing price | 46.43000030517578 |
| 2026-04-09 | Closing price | 45.70000076293945 |
| 2026-04-10 | Closing price | 46.349998474121094 |
| 2026-04-13 | Closing price | 46.849998474121094 |
| 2026-04-14 | Closing price | 45.650001525878906 |
| 2026-04-15 | Closing price | 45.77000045776367 |
| 2026-04-16 | Closing price | 46.310001373291016 |
| 2026-04-17 | Closing price | 43.0 |
| 2026-04-20 | Closing price | 43.29999923706055 |
| 2026-04-21 | Closing price | 44.279998779296875 |
| 2026-04-22 | Closing price | 44.68000030517578 |
| 2026-04-23 | Closing price | 45.43000030517578 |
| 2026-04-24 | Closing price | 44.2400016784668 |
| 2026-04-27 | Closing price | 45.02000045776367 |
| 2026-04-28 | Closing price | 46.36000061035156 |
| 2026-04-29 | Closing price | 47.209999084472656 |
| 2026-04-30 | Closing price | 47.689998626708984 |
| 2026-05-01 | Closing price | 46.959999084472656 |
| 2026-05-04 | Closing price | 47.58000183105469 |
| 2026-05-05 | Closing price | 47.849998474121094 |
| 2026-05-06 | Closing price | 45.630001068115234 |
| 2026-05-07 | Closing price | 44.7400016784668 |
| 2026-05-08 | Closing price | 44.529998779296875 |
| 2026-05-11 | Closing price | 45.189998626708984 |
| 2026-05-12 | Closing price | 46.91999816894531 |
| 2026-05-13 | Closing price | 47.20000076293945 |
| 2026-05-14 | Closing price | 47.56999969482422 |
| 2026-05-15 | Closing price | 47.97999954223633 |
| 2026-05-18 | Closing price | 48.95000076293945 |
| 2026-05-19 | Closing price | 49.41999816894531 |
| 2026-05-20 | Closing price | 48.779998779296875 |
| 2026-05-21 | Closing price | 48.689998626708984 |
| 2026-05-22 | Closing price | 48.61000061035156 |
| 2026-05-26 | Closing price | 46.83000183105469 |
| 2026-05-27 | Closing price | 45.75 |
| 2026-05-28 | Closing price | 45.810001373291016 |
| 2026-05-29 | Closing price | 45.369998931884766 |
| 2026-06-01 | Closing price | 45.959999084472656 |
| 2026-06-02 | Closing price | 47.209999084472656 |
| 2026-06-03 | Closing price | 47.689998626708984 |
| 2026-06-04 | Closing price | 47.65999984741211 |
| 2026-06-05 | Closing price | 45.70000076293945 |
| 2026-06-08 | Closing price | 46.290000915527344 |
| 2026-06-09 | Closing price | 44.810001373291016 |
| 2026-06-10 | Closing price | 45.52000045776367 |
| 2026-06-11 | Closing price | 45.439998626708984 |
| 2026-06-12 | Closing price | 45.29999923706055 |
| 2026-06-15 | Closing price | 44.0099983215332 |
| 2026-06-16 | Closing price | 43.29999923706055 |
| 2026-06-17 | Closing price | 42.41999816894531 |
| 2026-06-18 | Closing price | 41.04999923706055 |
| 2026-06-22 | Closing price | 41.790000915527344 |
| 2026-06-23 | Closing price | 41.02000045776367 |
| 2026-06-24 | Closing price | 39.380001068115234 |
| 2026-06-25 | Closing price | 39.599998474121094 |
| 2026-06-26 | Closing price | 39.4900016784668 |
| 2026-06-29 | Closing price | 39.310001373291016 |
| 2026-06-30 | Closing price | 39.5 |
| 2026-07-01 | Closing price | 38.91999816894531 |
| 2026-07-02 | Closing price | 39.63999938964844 |
| 2026-07-06 | Closing price | 39.349998474121094 |
| 2026-07-07 | Closing price | 40.689998626708984 |
| 2026-07-08 | Closing price | 42.43000030517578 |
| 2026-07-09 | Closing price | 41.880001068115234 |
| 2026-07-10 | Closing price | 41.810001373291016 |
| 2026-07-13 | Closing price | 43.04999923706055 |
| 2026-07-14 | Closing price | 42.619998931884766 |
| 2026-07-15 | Closing price | 42.72999954223633 |
| 2026-07-16 | Closing price | 42.86000061035156 |
| 2026-07-17 | Closing price | 43.88999938964844 |
| 2026-07-20 | Closing price | 43.95000076293945 |
| 2026-07-21 | Closing price | 44.900001525878906 |
| 2026-07-22 | Closing price | 45.810001373291016 |
| 2026-07-23 | Closing price | 47.0099983215332 |
| 2026-07-24 | Closing price | 46.439998626708984 |
| 2026-07-27 | Closing price | 44.790000915527344 |
| 2026-07-28 | Closing price | 44.189998626708984 |
| 2026-07-29 | Closing price | 46.45000076293945 |
| 2026-07-30 | Closing price | 47.279998779296875 |
| 2026-07-31 | Closing price | 47.68000030517578 |
| 2026-08-03 | Closing price | 46.36000061035156 |
| 2026-08-04 | Closing price | 46.18000030517578 |
| 2026-08-05 | Closing price | 44.75 |
| 2026-08-06 | Closing price | 45.45000076293945 |
| 2026-08-07 | Closing price | 45.5099983215332 |
| 2026-08-10 | Closing price | 47.25 |
| 2026-08-11 | Closing price | 47.61000061035156 |
| 2026-08-12 | Closing price | 47.56999969482422 |
| 2026-08-13 | Closing price | 47.599998474121094 |
| 2026-08-14 | Closing price | 47.970001220703125 |
| 2026-08-17 | Closing price | 49.27000045776367 |
| 2026-08-18 | Closing price | 49.59000015258789 |
| 2026-08-19 | Closing price | 49.5 |
| 2026-08-20 | Closing price | 51.029998779296875 |
| 2026-08-21 | Closing price | 51.400001525878906 |
| 2026-08-24 | Closing price | 50.68000030517578 |
| 2026-08-25 | Closing price | 49.59000015258789 |
| 2026-08-26 | Closing price | 49.63999938964844 |
| 2026-08-27 | Closing price | 49.77000045776367 |
| 2026-08-28 | Closing price | 48.9900016784668 |
| 2026-08-31 | Closing price | 50.06999969482422 |
| 2026-09-01 | Closing price | 51.810001373291016 |
| 2026-09-02 | Closing price | 51.810001373291016 |
| 2026-09-03 | Closing price | 51.13999938964844 |
| 2026-09-04 | Closing price | 50.459999084472656 |
| 2026-09-08 | Closing price | 50.900001525878906 |
| 2026-09-09 | Closing price | 51.349998474121094 |
| 2026-09-10 | Closing price | 50.79999923706055 |
| 2026-09-11 | Closing price | 50.06999969482422 |
| 2026-09-14 | Closing price | 50.31999969482422 |
| 2026-09-15 | Closing price | 51.54999923706055 |
| 2026-09-16 | Closing price | 50.06999969482422 |
| 2026-09-17 | Closing price | 50.619998931884766 |
| 2026-09-18 | Closing price | 49.63999938964844 |
| 2026-09-21 | Closing price | 48.279998779296875 |
| 2026-09-22 | Closing price | 47.77000045776367 |
| 2026-09-23 | Closing price | 47.63999938964844 |
| 2026-09-24 | Closing price | 47.93000030517578 |
| 2026-09-25 | Closing price | 47.40999984741211 |
| 2026-09-28 | Closing price | 47.54999923706055 |
| 2026-09-29 | Closing price | 47.16999816894531 |
| 2026-09-30 | Closing price | 47.06999969482422 |
| 2026-10-01 | Closing price | 47.790000915527344 |
| 2026-10-02 | Closing price | 48.439998626708984 |
| 2026-10-05 | Closing price | 48.310001373291016 |
| 2026-10-06 | Closing price | 48.099998474121094 |
| 2026-10-07 | Closing price | 47.5 |
| 2026-10-08 | Closing price | 49.04999923706055 |
| 2026-10-09 | Closing price | 49.650001525878906 |
| 2026-10-12 | Closing price | 50.5 |
| 2026-10-13 | Closing price | 52.13999938964844 |
| 2026-10-14 | Closing price | 51.81999969482422 |
| 2026-10-15 | Closing price | 51.95000076293945 |
| 2026-10-16 | Closing price | 53.79999923706055 |
| 2026-10-19 | Closing price | 54.119998931884766 |
| 2026-10-20 | Closing price | 54.18000030517578 |
| 2026-10-21 | Closing price | 54.2400016784668 |
| 2026-10-22 | Closing price | 53.91999816894531 |
| 2026-10-23 | Closing price | 55.060001373291016 |
| 2026-10-26 | Closing price | 55.11000061035156 |
| 2026-10-27 | Closing price | 54.06999969482422 |
| 2026-10-28 | Closing price | 54.810001373291016 |
| 2026-10-29 | Closing price | 55.09000015258789 |
| 2026-10-30 | Closing price | 56.11000061035156 |
| 2026-11-02 | Closing price | 53.63999938964844 |
| 2026-11-03 | Closing price | 53.599998474121094 |
| 2026-11-04 | Closing price | 49.63999938964844 |
| 2026-11-05 | Closing price | 48.91999816894531 |
| 2026-11-06 | Closing price | 48.54999923706055 |
| 2026-11-09 | Closing price | 48.040000915527344 |
| 2026-11-10 | Closing price | 48.23500061035156 |
A 2.8% dividend yield on a 10.0x LTM P/E leaves no cushion: on EV/EBITDA the share is 6% above its own three-year history
The trailing-twelve-month dividend yield is 2.8%. For an upstream producer that is modest: with oil at USD 85 and a 23.4% net margin one might expect more. Judging by the yield, the payout is conservative, which is a plus for resilience rather than a minus.
The LTM P/E is 10.0 and LTM EV/EBITDA 6.7. The three-year average EV/EBITDA is 6.4, so the share trades 6% above its own history. That is a small premium, but it means the market has already priced in high oil.
On the portal's spot model at current prices EV/EBITDA is 5.9 and EBITDA 18,691.2m against 16,297.4m in the LTM model. So at current prices the share looks cheaper than on historical ones, yet the model still shows minus 12% to fair value.
The gap between the two yardsticks is simple: LTM earnings were made with oil averaging above USD 80, while the spot model already uses today's USD 86.6 and still sees no upside. For this share the second yardstick decides – it shows that even at a good price the cushion is negative.
Valuation on the latest reported figures
| Metric | Value |
|---|---|
| Market cap | 101 bn USD |
| P/E (LTM) | 10.0 |
| EV/EBITDA (LTM) | 6.7 |
| P/B | 3.18 |
| Net debt / EBITDA (LTM) | 0.51 |
| Operating cash flow (LTM) | 14.9 bn |
| ROE | 25.2% |
| Dividend yield (12m) | 2.8% |
| EV/EBITDA, 3-year average | 6.4 |
Net profit by quarter
| Period | Measure | bn USD |
|---|---|---|
| Q1 2025 | Net profit | 1.755012 |
| Q2 2025 | Net profit | 1.768021 |
| Q3 2025 | Net profit | 0.43439999999999995 |
| Q4 2025 | Net profit | 3.802251 |
| Q1 2026 | Net profit | 0.954384 |
| Q2 2026 | Net profit | 3.278184 |
| Q3 2026 | Net profit | 2.1098879999999998 |
Bottom line
The strong side of the report is the balance sheet: debt at 0.51x LTM EBITDA and quarterly operating cash flow of 4,935.0m is a level that withstands a price pullback. The weak side is that with oil 31.7% more expensive year on year, EBITDA trailed the price-implied level by 6.6%, and by 14.4% against the previous quarter. Net profit of 2,109.9m rose 4.9-fold, but that is a recovery from a low base, not a new level. The question for a holder now is whether to pay 6.7x EBITDA against a 6.4x historical average and a 2.8% yield when the spot model shows minus 12%. Our conclusion: rather unattractive – on the portal's spot model the share trades 12% above its modelled fair value. Our view: the share is rather unattractive at the current price; upside on the portal model -12%.