CNX Resources Corporation: revenue accelerated to +28.3%, but profit fell 18.2% as margin compressed from 44.7% to 28.5%

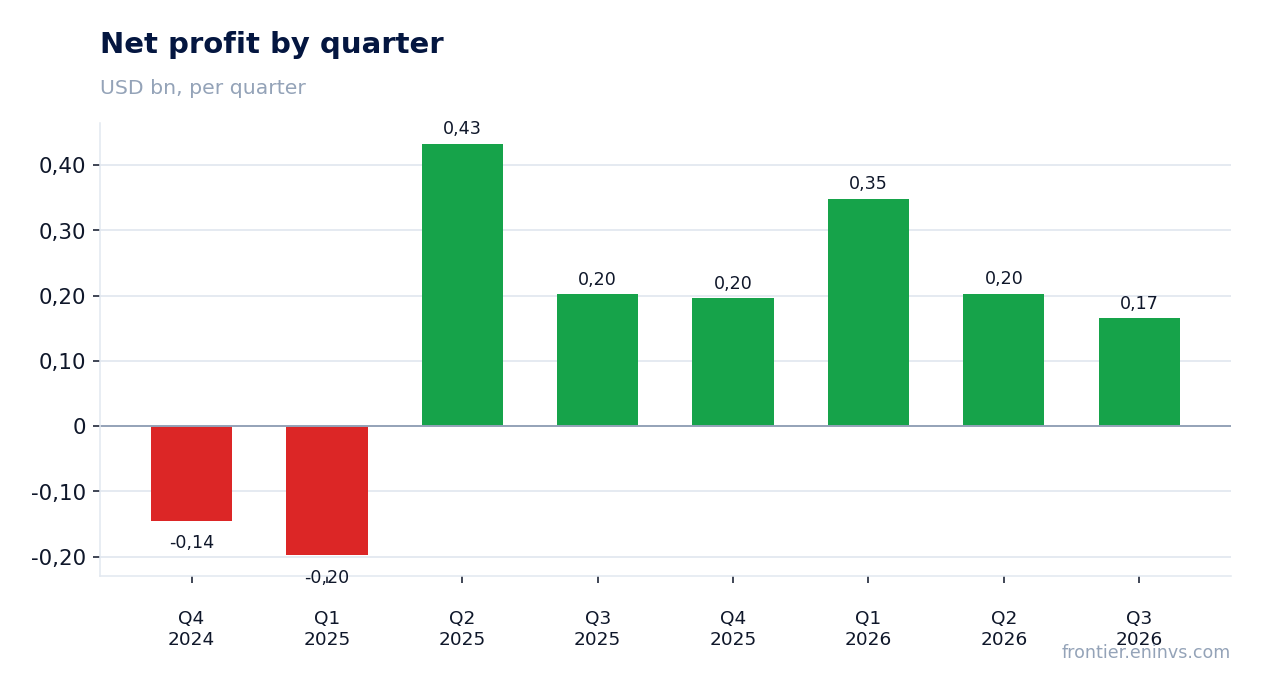
On 29 October CNX Resources Corporation reported results for the third quarter of 2026. Revenue came in at USD 580.0 mn, up 28.3% year on year after a 18.3% decline a quarter earlier; net profit was USD 165.2 mn (–18.2% YoY) and operating cash flow USD 253.5 mn against capital expenditures of USD 139.2 mn. Profit fell while revenue rose: the net margin dropped from 44.7% to 28.5%, and that gap defines the report. On EV/EBITDA of 4.8 the share is cheaper than its own three-year history (6.8), but the portal's model puts the upside to fair value at –49%, so the stock looks rather unattractive at the current price.
Key takeaways
— Revenue accelerated to +28.3% YoY after –18.3% a quarter earlier, yet profit for the same quarter fell 18.2%
— The net margin compressed from 44.7% to 28.5% – revenue growth did not reach profit
— Operating cash flow of USD 253.5 mn covered capital expenditures of USD 139.2 mn with room to spare
— Net debt fell from USD 2.8 bn on 30 September 2025 to USD 2.3 bn on 30 September 2026
— Leverage of 1.33x LTM EBITDA is moderate for the sector
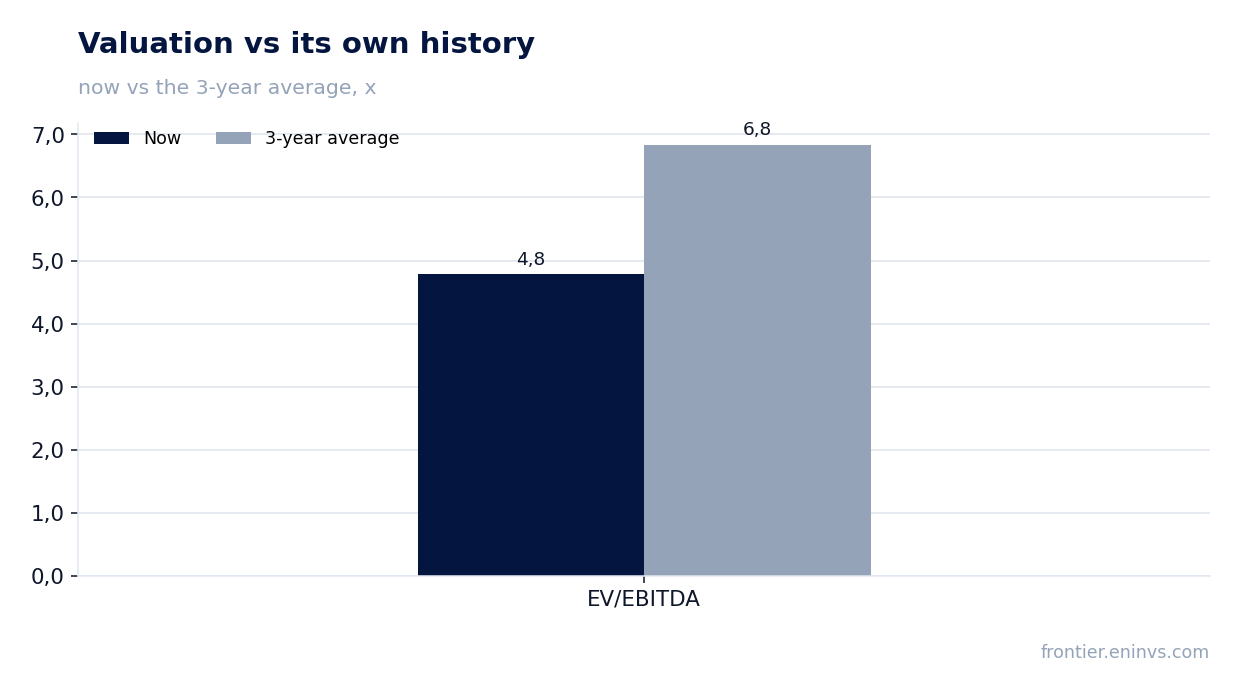
— EV/EBITDA of 4.8 against its own three-year average of 6.8 – the share is 30% cheaper than its history
— The portal's model puts the upside to fair value at –49%, which outweighs the cheap multiple
Attractiveness
Key figures, USD bn
| Metric | Q3 2025 | Q3 2026 | Change |
|---|---|---|---|
| Revenue | 0.45 | 0.58 | +28.3% |
| EBITDA | 0.28 | — | — |
| Operating profit | 0.13 | — | — |
| Net profit | 0.20 | 0.17 | -18.2% |
| Operating cash flow | 0.23 | 0.25 | +8.5% |
| Capex | 0.08 | 0.14 | +84.2% |
| EBITDA margin | 62.7% | — | — |
| Net margin | 44.7% | 28.5% | -16.2 pp |
Revenue accelerated to +28.3% YoY after –18.3% a quarter earlier, yet profit for the same quarter fell 18.2%
In the third quarter of 2026 revenue was USD 580.0 mn, 28.3% more than a year earlier. That is a marked acceleration: in the second quarter revenue was shrinking at 18.3% YoY. The reversal happened within a single quarter.
Net profit for the same period was USD 165.2 mn, 18.2% less than in the third quarter of 2025. Revenue growth did not translate into profit growth: the company sold more but earned less.
The gap between revenue and profit is the central fact of the report. It means either costs rose or the prior-year profit contained a one-off component that did not repeat. The facts contain no cost breakdown, so the specific cause cannot be named, but the gap itself is clear.
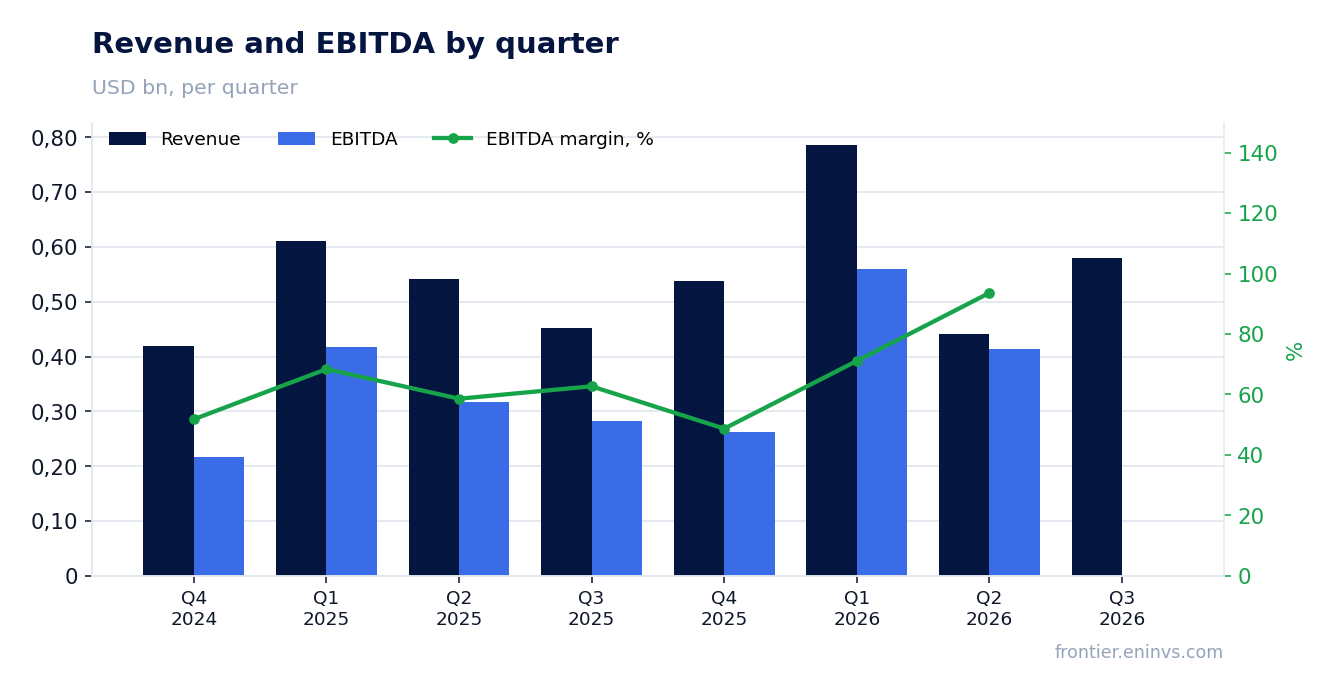
The net margin compressed from 44.7% to 28.5% – revenue growth did not reach profit
The net margin in the third quarter of 2026 was 28.5% against 44.7% a year earlier. A fall of 16.2 percentage points is not a fluctuation but a change in the level of profitability.
At revenue of USD 580.0 mn, a 28.5% margin yields profit of USD 165.2 mn. Had profitability stayed at 44.7%, profit would have been materially higher on the same revenue. All of the revenue growth went into costs or into the comparison base.
For a shareholder this means operating leverage worked in reverse this quarter: scale did not pay off. Until the margin recovers, revenue growth alone will not drive profit.
Operating cash flow of USD 253.5 mn covered capital expenditures of USD 139.2 mn with room to spare
Operating cash flow in the third quarter of 2026 was USD 253.5 mn, capital expenditures USD 139.2 mn. The USD 114.3 mn difference remained at the company's disposal after investment.
That is a healthy ratio: cash flow is nearly double capital spending. Even with the compressed margin, the business generates enough funds to finance investment from its own resources.
Over the last twelve months operating cash flow was USD 1,107.6 mn on revenue of USD 2,300.0 mn. That confirms the quarter was not an anomaly in cash generation, despite weak profit.
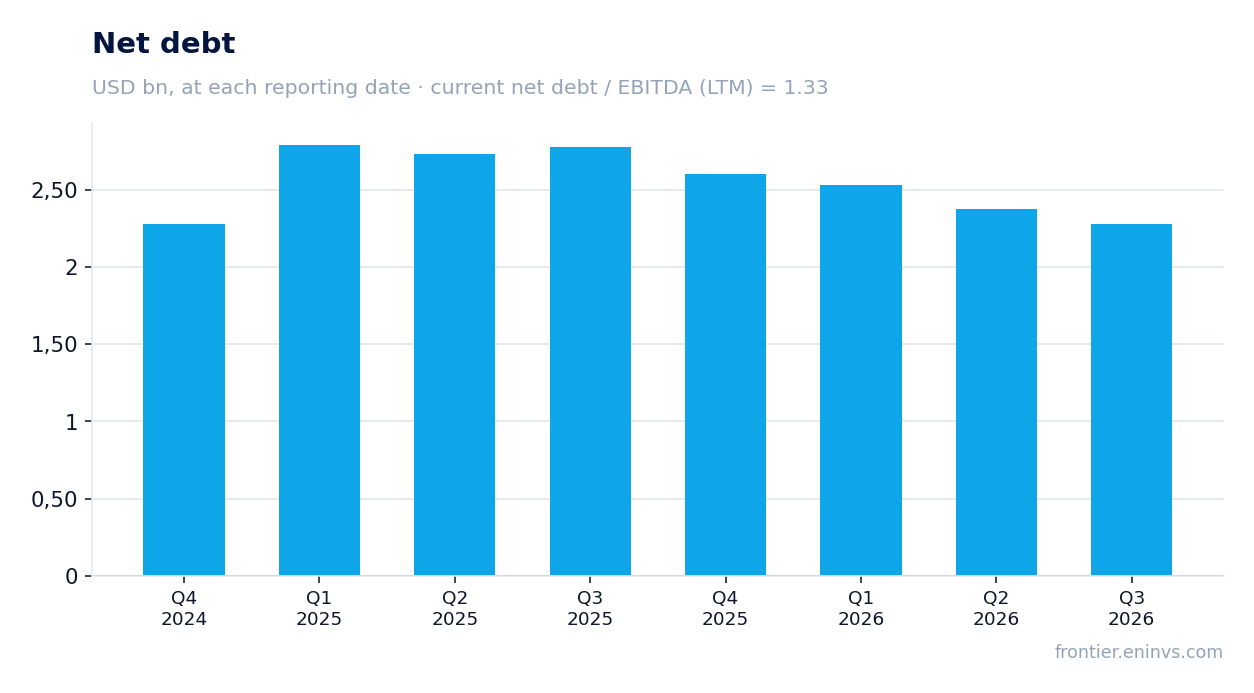
Net debt fell from USD 2.8 bn on 30 September 2025 to USD 2.3 bn on 30 September 2026
Net debt on 30 September 2026 was USD 2.3 bn against USD 2.8 bn on 30 September 2025 – a reduction of USD 0.5 bn over the year. Over the quarter debt fell from USD 2.4 bn on 30 June 2026 to the same USD 2.3 bn.
Lower debt alongside positive cash flow is a logical consequence: the company directed part of its free funds to reducing liabilities. That supports the balance sheet and lowers future interest expense.
The ratio of net debt to LTM EBITDA is 1.33. That is a moderate level for a capital-intensive business and leaves room to manoeuvre if conditions deteriorate.
Leverage of 1.33x LTM EBITDA is moderate for the sector
The ratio of net debt to LTM EBITDA is 1.33. With EBITDA of USD 1,711.5 mn and net debt of USD 2.3 bn, the company can service its debt without strain.
A level of 1.33 is comfortable for a gas business, where cash flows are exposed to commodity price swings. Such a cushion allows the company to weather weak quarters without emergency capital raising.
Importantly, debt reduction happened alongside capital investment of USD 139.2 mn in the quarter. The company was simultaneously investing in growth and cutting liabilities.
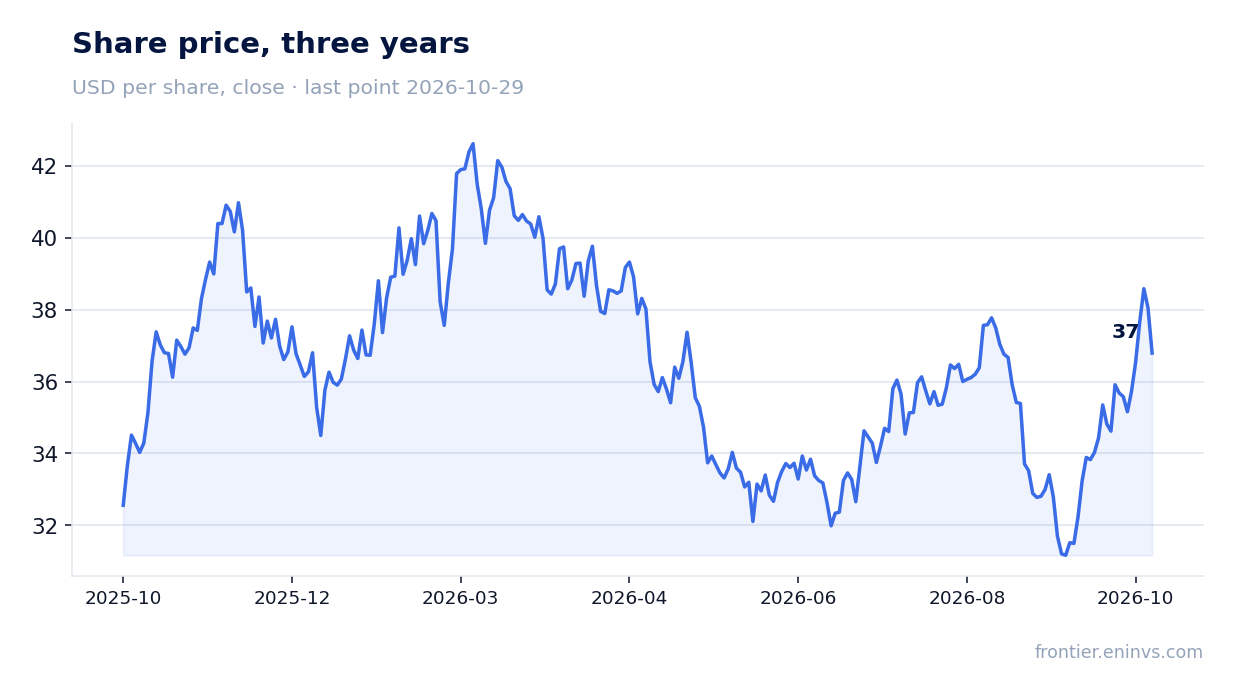
EV/EBITDA of 4.8 against its own three-year average of 6.8 – the share is 30% cheaper than its history
The LTM EV/EBITDA multiple is 4.8 against its own three-year average of 6.8. The share trades 30% below its historical level on this measure.
The LTM P/E is 5.8, which also points to a low valuation of earnings. The market values the company modestly relative to its current ability to generate profit.
A cheap multiple alone does not guarantee upside: it may reflect the market's expectations about the durability of earnings. The margin compression in the third quarter is exactly the signal that explains why the share trades below its history.
The portal's model puts the upside to fair value at –49%, which outweighs the cheap multiple
On the portal's model, which re-prices EBITDA at current commodity prices at the target EV/EBITDA, the upside to fair value is –49%. This is the portal's own estimate, not a market consensus.
Negative upside means that at current commodity prices and the target multiple, the fair value of the share is half the market price. In other words, the market is pricing in a more favourable scenario than the one embedded in the model.
This is the key contradiction: on the historical multiple the share is cheap, but on a model tied to current commodity prices it is expensive. Either a recovery in prices or a further de-rating will resolve it.
Valuation on the latest reported figures
| Metric | Value |
|---|---|
| Market cap | 5.29 bn USD |
| P/E (LTM) | 5.8 |
| EV/EBITDA (LTM) | 4.8 |
| P/B | 1.22 |
| Net debt / EBITDA (LTM) | 1.33 |
| Operating cash flow (LTM) | 1.11 bn |
| ROE | 13.7% |
| EV/EBITDA, 3-year average | 6.8 |
Bottom line
The strong side of the report is cash generation: operating cash flow of USD 253.5 mn covered capital expenditures of USD 139.2 mn, and net debt fell over the year from USD 2.8 bn to USD 2.3 bn. The weak side is profit: it fell 18.2% while revenue rose 28.3%, and the margin compressed from 44.7% to 28.5%. The cheap EV/EBITDA of 4.8 against a three-year average of 6.8 looks attractive, but the portal's model with –49% upside says the share is not worth its price at current commodity prices. The question for a holder now is whether the margin recovers – without that, revenue growth will not turn into profit growth. The verdict is rather unattractive: a cheap history does not offset weak current profitability and negative model upside.
Open the company's financial profile CNX →
See also: market overview · valuation map · stock screeners