Capital One Financial: net profit up 10.9% but EBITDA margin compressed to 37.6%

For Q3 2026 Capital One Financial reported revenue of USD 16,344 mn (+6.4% YoY), EBITDA of USD 6,138 mn (-1.2%) and net profit of USD 3,539 mn (+10.9%). Revenue growth decelerated from 26.9% in Q2 to 6.4%, while the EBITDA margin fell from 40.5% to 37.6%. At an EV/EBITDA of 6.7 versus its own three-year average of 13.5 the stock looks cheaper than its history, but the portal model implies -18% upside, so the verdict is neutral.
Key takeaways
— Revenue rose 6.4% to 16,344 mn but that is half the 26.9% pace a quarter earlier
— EBITDA fell 1.2% to 6,138 mn and the margin dropped from 40.5% to 37.6%
— Net profit added 10.9% to 3,539 mn and the margin rose to 21.7%
— Net debt at 30 September 2026 was 443 mn, or 0.03x LTM EBITDA
— EV/EBITDA of 6.7 versus its own three-year average of 13.5 leaves the stock 51% below its history
— The portal model puts upside to fair value at -18%
— A dividend yield of 1.55% is modest and offers no cushion
Attractiveness
Key figures, USD bn
| Metric | Q3 2025 | Q3 2026 | Change |
|---|---|---|---|
| Revenue | 15.4 | 16.3 | +6.4% |
| EBITDA | 6.21 | 6.14 | -1.2% |
| Operating profit | 4.38 | 4.57 | +4.3% |
| Net profit | 3.19 | 3.54 | +10.9% |
| Operating cash flow | 9.15 | 5.71 | -37.6% |
| Capex | 0.39 | 0.39 | +1.3% |
| EBITDA margin | 40.5% | 37.6% | -2.9 pp |
| Net margin | 20.8% | 21.7% | +0.9 pp |
Revenue rose 6.4% to 16,344 mn but that is half the 26.9% pace a quarter earlier
In Q3 2026 Capital One Financial's revenue was USD 16,344 mn, up 6.4% year on year. That is a deceleration from Q2, when growth reached 26.9%. The slowdown is pronounced: the growth rate fell more than fourfold.
For context, revenue grew 52.3% in Q1 2026, 26.9% in Q2 and now 6.4%. This pattern suggests the low-base effect has largely played out and the company is returning to more moderate growth. In absolute terms quarterly revenue is still rising: from 15,850 mn in Q2 to 16,344 mn in Q3.
The data provided do not show what supported growth. All that can be said is that the company remains on a positive trajectory but at a much slower pace. For an investor this signals that further acceleration is unlikely without new drivers.
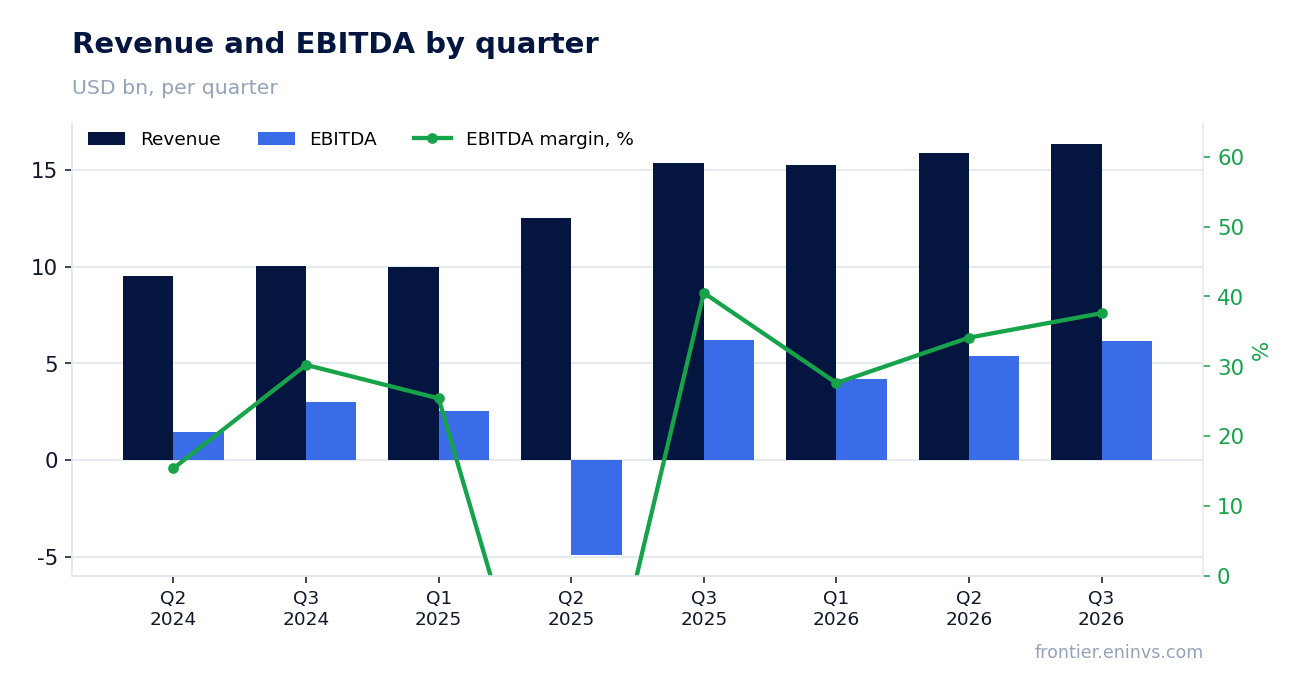
EBITDA fell 1.2% to 6,138 mn and the margin dropped from 40.5% to 37.6%
EBITDA for Q3 2026 was USD 6,138 mn, down 1.2% year on year. Revenue grew 6.4%, so costs rose faster than income. The EBITDA margin fell from 40.5% to 37.6%, almost 3 percentage points.
Operating profit was USD 4,572 mn, up from 4,382 mn a year earlier. But EBITDA declined, which may point to higher depreciation or other non-cash items.
Margin compression alongside revenue growth is a warning sign. If the company cannot control costs, pressure on profit will persist. In the next report, watch the trend in operating expenses.
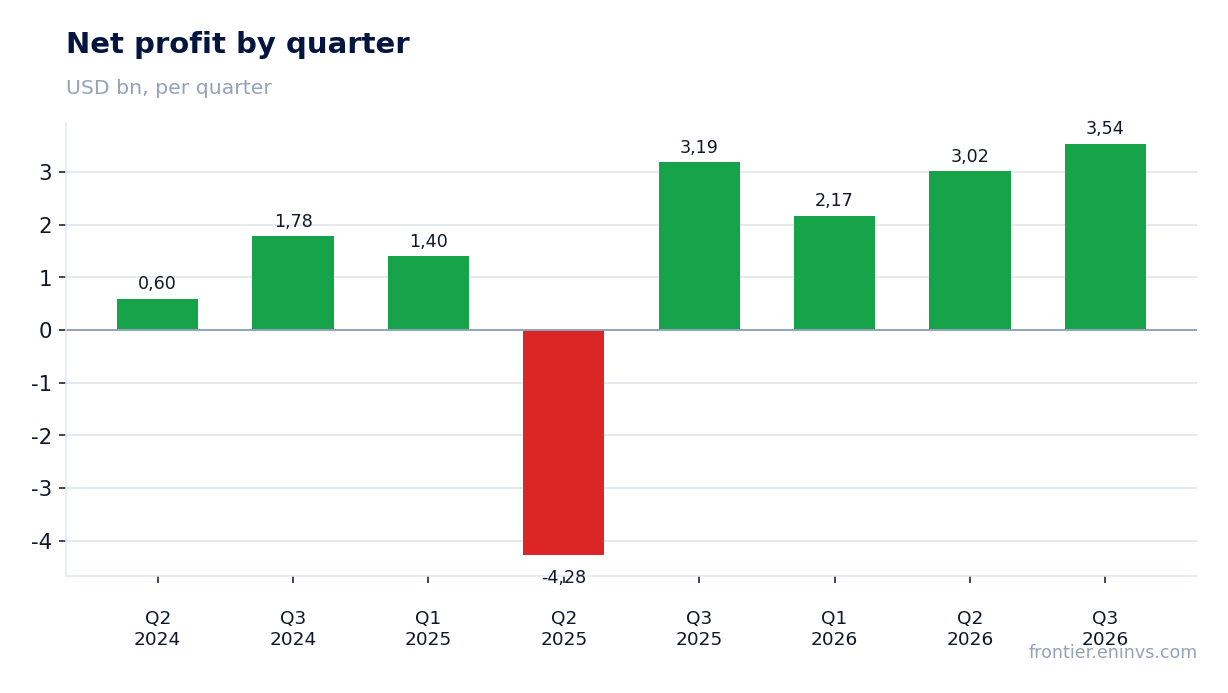
Net profit added 10.9% to 3,539 mn and the margin rose to 21.7%
Net profit in Q3 2026 was USD 3,539 mn, up 10.9% year on year. The net margin rose from 20.8% to 21.7%. This happened despite lower EBITDA, which may be explained by a lower tax burden or other below-the-line items.
Net profit growth alongside falling EBITDA is a divergence that needs explaining. The company may have booked a one-off gain or reduced provisions. Without further detail from the report, the cause cannot be named.
Nevertheless, net profit is the key metric for shareholders and its growth is positive. But the sustainability of this growth is questionable given weak EBITDA dynamics.
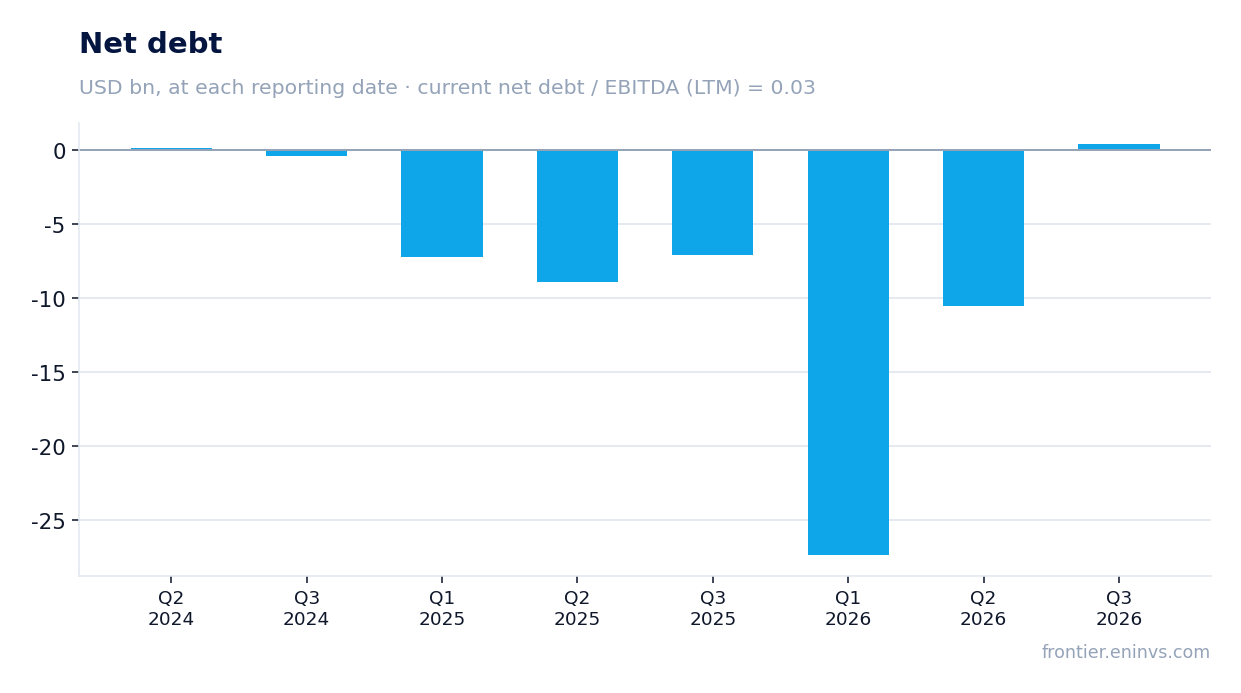
Net debt at 30 September 2026 was 443 mn, or 0.03x LTM EBITDA
Net debt at 30 September 2026 was USD 443 mn. That equals 0.03x LTM EBITDA of 17,719.8 mn. Such a debt level is barely noticeable for the company.
Debt dynamics: at 30 June 2026 net debt was negative at -10.5 bn, and at 30 September it turned positive at 443 mn. The quarterly change is +11.0 bn. Over 12 months net debt rose from -7.0 bn on 30 September 2025 to 443 mn on 30 September 2026, a change of +7.5 bn. The increase may reflect financing activity, but the exact cause is not given.
Low leverage gives the company flexibility, but the quarterly rise in debt is worth noting. In the next report it will be important to see whether this trend persists.
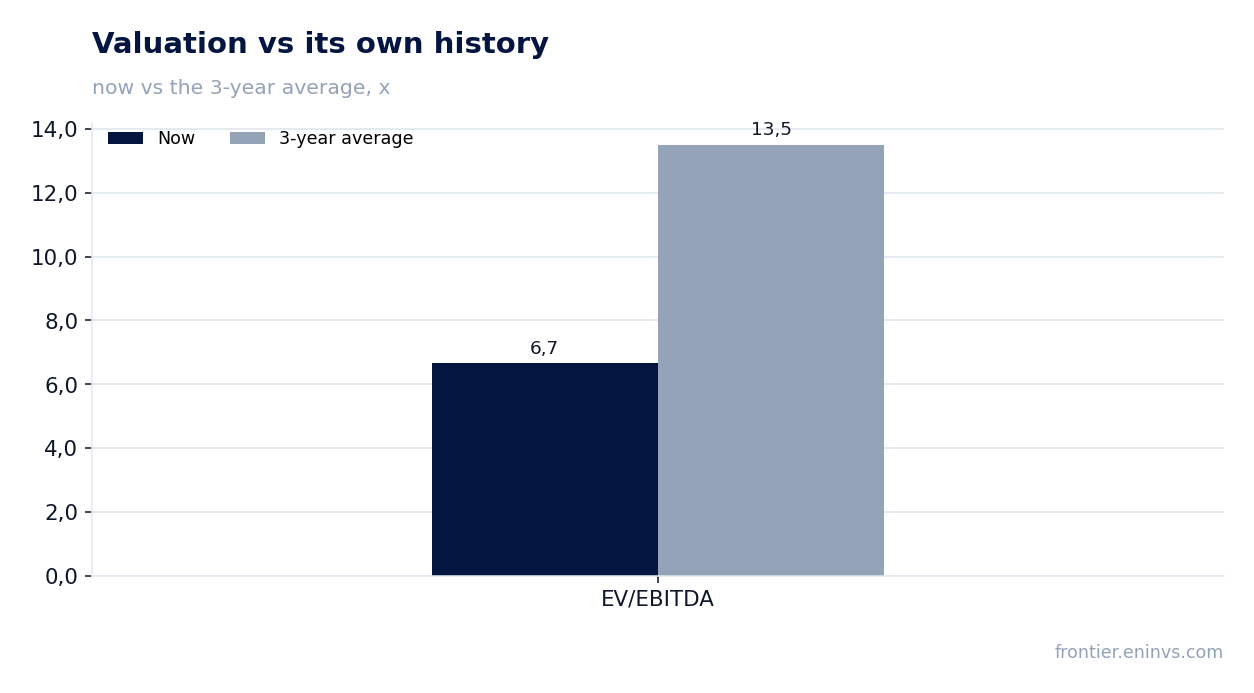
EV/EBITDA of 6.7 versus its own three-year average of 13.5 leaves the stock 51% below its history
The LTM EV/EBITDA multiple is 6.7, versus its own three-year average of 13.5. The stock trades 51% below its historical valuation. This may indicate undervaluation, but it also reflects deteriorating fundamentals.
The LTM P/E is 11.9. Return on equity is 12.7%. Market capitalisation is USD 128,965 mn. At this valuation the market appears to be pricing in the risk of slowing growth and margin compression.
A lower multiple can be either an opportunity or a trap. If profit stabilises, the current valuation is attractive. If margin pressure continues, the multiple may stay low.
The portal model puts upside to fair value at -18%
On the portal model, which links EBITDA growth to a target multiple and market capitalisation, upside to fair value is -18%. This means that even with the current low multiple the stock looks overvalued relative to the model.
The model incorporates EBITDA growth, which was positive over the last 12 months but turned negative in Q3. If the negative trend persists, fair value could be even lower.
Thus, despite a low EV/EBITDA versus history, the model does not confirm undervaluation. This argues for caution.
A dividend yield of 1.55% is modest and offers no cushion
The trailing 12-month dividend yield is 1.55%. That is a low level that does not offset the risk of a share price decline. For comparison, the US key rate is currently higher, making the dividend less attractive.
The data provided do not include the dividend amount or payout ratio. All that can be said is that the current yield is not a primary argument for buying.
If the company maintains profit at the current level, the dividend is likely to remain stable. However, if results deteriorate, an adjustment is possible.
Valuation on the latest reported figures
| Metric | Value |
|---|---|
| Market cap | 129 bn USD |
| P/E (LTM) | 11.9 |
| EV/EBITDA (LTM) | 6.7 |
| P/B | 1.14 |
| Net debt / EBITDA (LTM) | 0.03 |
| Operating cash flow (LTM) | 28.0 bn |
| ROE | 12.7% |
| Dividend yield (12m) | 1.6% |
| EV/EBITDA, 3-year average | 13.5 |
Bottom line
The report's strength was 10.9% net profit growth and a higher net margin of 21.7%. But that growth came with lower EBITDA, raising questions about its sustainability. Revenue decelerated to 6.4% and the EBITDA margin compressed to 37.6%. Leverage remains low, but net debt rose by USD 11.0 bn in the quarter. The verdict is neutral: a low multiple versus history is offset by weak operating trends and negative upside on the portal model.
Open the company's financial profile COF →
See also: market overview · valuation map · stock screeners