COHERENT CORP.: revenue up 49.9%, but free cash flow turned negative on heavy capex

On November 4, COHERENT CORP. reported results for the quarter ended September 30, 2026. Revenue came in at $2,370.3 million, up 49.9% year on year, net profit reached $384.7 million (+69.9%), and the net margin rose to 16.2% from 14.3%. However, operating cash flow was negative (-$92.7 million) and capital expenditures amounted to $775.5 million, pushing free cash flow into negative territory. In our view, the share looks neutral: revenue and profit growth are strong, but cash flow and leverage limit its appeal.
Key takeaways
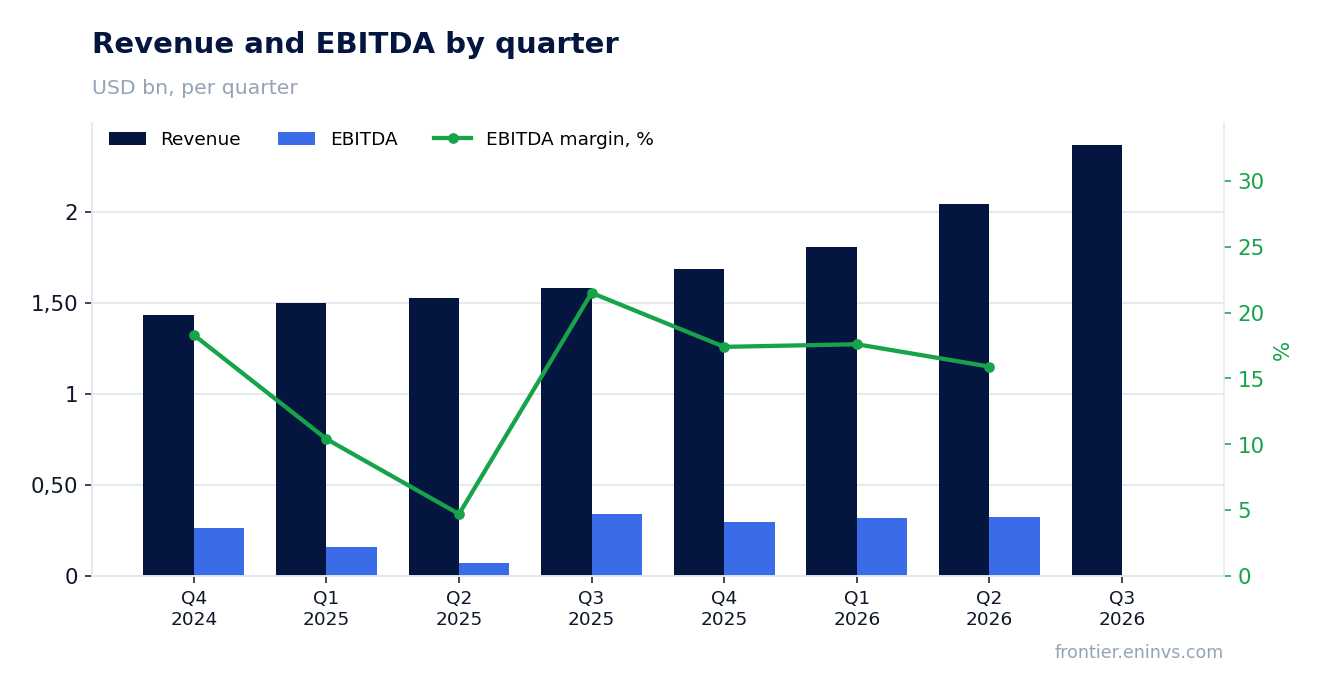
— Revenue rose 49.9% year on year to $2,370.3 million, an acceleration from 33.7% growth in the previous quarter
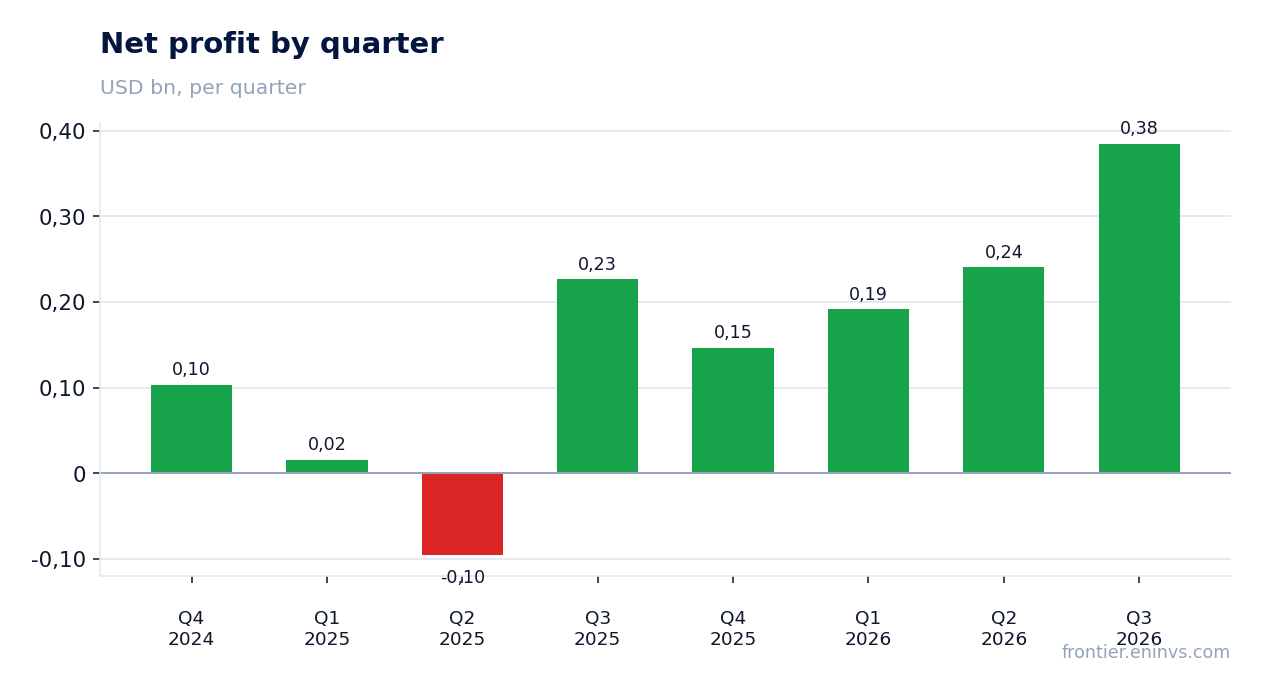
— Net profit added 69.9% to reach $384.7 million, with the net margin rising to 16.2% from 14.3%
— Operating cash flow turned negative at -$92.7 million, while capital expenditures reached $775.5 million, resulting in negative free cash flow
— Net debt stood at $2,794.1 million as of September 30, 2026, with a net debt to LTM EBITDA ratio of 1.97
— At an LTM EV/EBITDA of 28.7, the share trades below its three-year average of 44.1, i.e. cheaper than its own history
— On the portal's model, the upside to fair value is -4%, offering no margin of safety
Attractiveness
Key figures, USD bn
| Metric | Q3 2025 | Q3 2026 | Change |
|---|---|---|---|
| Revenue | 1.58 | 2.37 | +49.9% |
| EBITDA | 0.34 | — | — |
| Operating profit | 0.22 | — | — |
| Net profit | 0.23 | 0.38 | +69.9% |
| Operating cash flow | 0.05 | -0.09 | -301.7% |
| Capex | 0.10 | 0.78 | +646.1% |
| EBITDA margin | 21.5% | — | — |
| Net margin | 14.3% | 16.2% | +1.9 pp |
Revenue rose 49.9% year on year to $2,370.3 million, an acceleration from 33.7% growth in the previous quarter
Revenue for the quarter ended September 30, 2026, came in at $2,370.3 million, up 49.9% from the same quarter a year earlier. Growth accelerated from 33.7% in the previous quarter. This is the highest rate in several quarters.
The acceleration in revenue growth points to strong demand for the company's products. However, without segment and driver data in the report, it is difficult to say what exactly drove such a jump. We note the acceleration itself as a positive signal for the top line.
Net profit added 69.9% to reach $384.7 million, with the net margin rising to 16.2% from 14.3%
Net profit for the quarter reached $384.7 million, up 69.9% year on year. The net margin rose to 16.2% from 14.3% a year earlier. Profit growth outpaces revenue growth, indicating improved operating efficiency.
Profit growing faster than revenue means the company is either controlling costs better or benefiting from its sales mix. However, without data on operating profit and one-off items, it is impossible to say precisely how sustainable this dynamic is.
Operating cash flow turned negative at -$92.7 million, while capital expenditures reached $775.5 million, resulting in negative free cash flow
Operating cash flow for the quarter was negative at -$92.7 million, while capital expenditures reached $775.5 million. As a result, free cash flow was deeply negative. This is the key difference from the income statement, where the picture looks healthy.
Such large capital expenditures may be linked to capacity expansion or investment in new facilities. However, negative operating cash flow means the company is not yet converting profit into cash. This creates a risk of financing investments through debt.
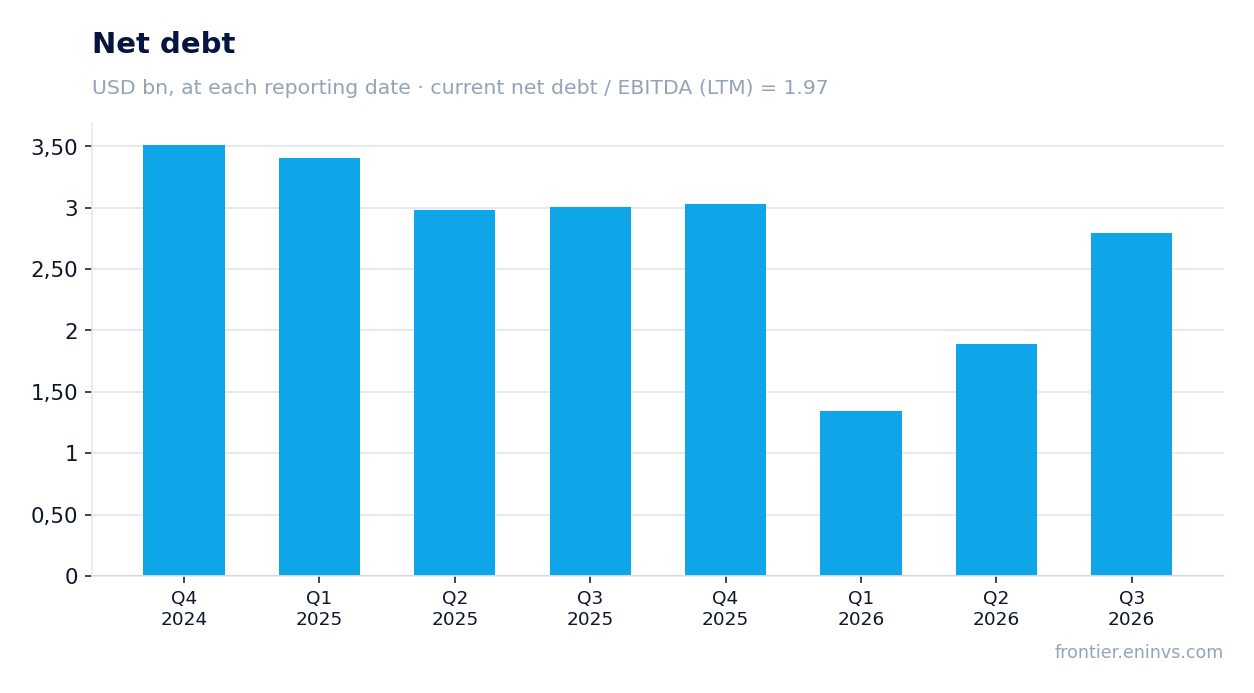
Net debt stood at $2,794.1 million as of September 30, 2026, with a net debt to LTM EBITDA ratio of 1.97
Net debt as of September 30, 2026, stood at $2,794.1 million, up from $1,886.1 million as of June 30, 2026. Over the year, net debt declined from $3,005.0 million as of September 30, 2025. The net debt to LTM EBITDA ratio is 1.97.
A leverage level of 1.97x EBITDA looks moderate, but the $0.9 billion increase in net debt over the quarter raises questions. Negative free cash flow means the company may continue to increase debt if capital expenditures remain high.
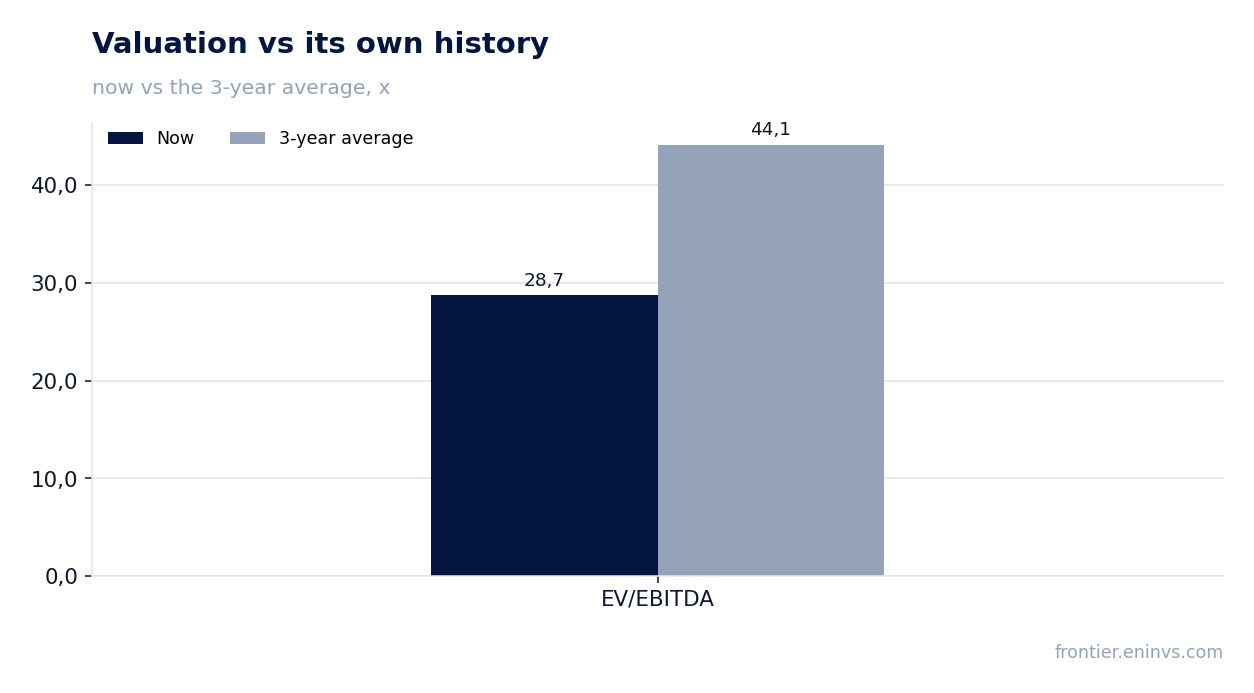
At an LTM EV/EBITDA of 28.7, the share trades below its three-year average of 44.1, i.e. cheaper than its own history
The LTM EV/EBITDA is 28.7, which is 35% below the three-year average of 44.1. This means the share trades cheaper than usual relative to its own history. The LTM P/E is 39.6.
The lower multiple may reflect either EBITDA growth or a share price correction. After the report, the share fell 6.2%, and from the release to November 4 the decline was also 6.2%. The market reacted to weak cash flow despite strong profit figures.
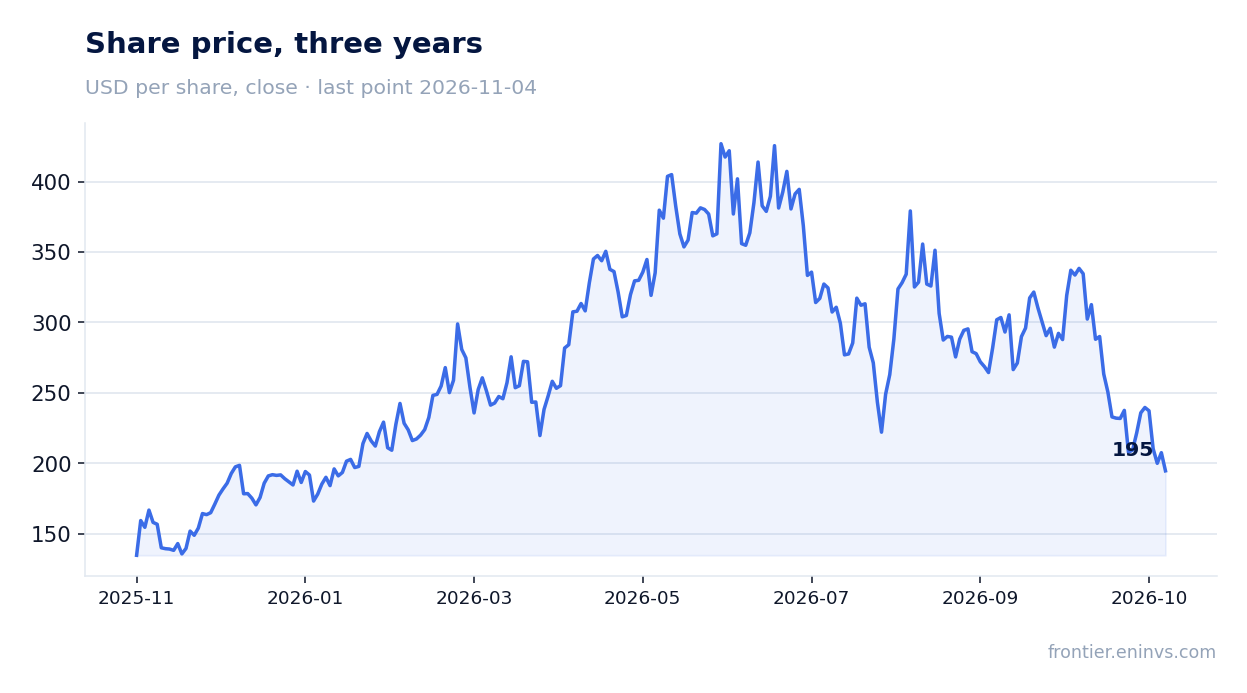
On the portal's model, the upside to fair value is -4%, offering no margin of safety
On the portal's model, which factors in EBITDA growth and a target multiple, the upside to fair value is -4%. This means the current price is close to the model's estimate, leaving no room for growth. The model is not a market consensus or a target price.
The negative upside on the portal's model is consistent with the market's reaction to the report. Investors should note that the model may not reflect future changes in capital expenditures and cash flow.
Valuation on the latest reported figures
| Metric | Value |
|---|---|
| Market cap | 38.1 bn USD |
| P/E (LTM) | 39.6 |
| EV/EBITDA (LTM) | 28.7 |
| P/B | 3.39 |
| Net debt / EBITDA (LTM) | 1.97 |
| Operating cash flow (LTM) | -0.06 bn |
| ROE | 13.8% |
| EV/EBITDA, 3-year average | 44.1 |
Bottom line
The report's strengths are accelerating revenue growth to 49.9% and net profit growth of 69.9% with a margin increase to 16.2%. However, these results are not supported by cash flow: operating cash flow is negative and capital expenditures are high. Net debt rose over the quarter, although its ratio to EBITDA remains moderate at 1.97. The share trades below its historical EV/EBITDA valuation, but the portal's model shows no upside. We rate the share neutral: strong operating results are offset by weak cash flow and no valuation cushion.
Open the company's financial profile COHR →
See also: market overview · valuation map · stock screeners