California Resources Corporation: revenue up a quarter, but a one-off charge wiped out profit
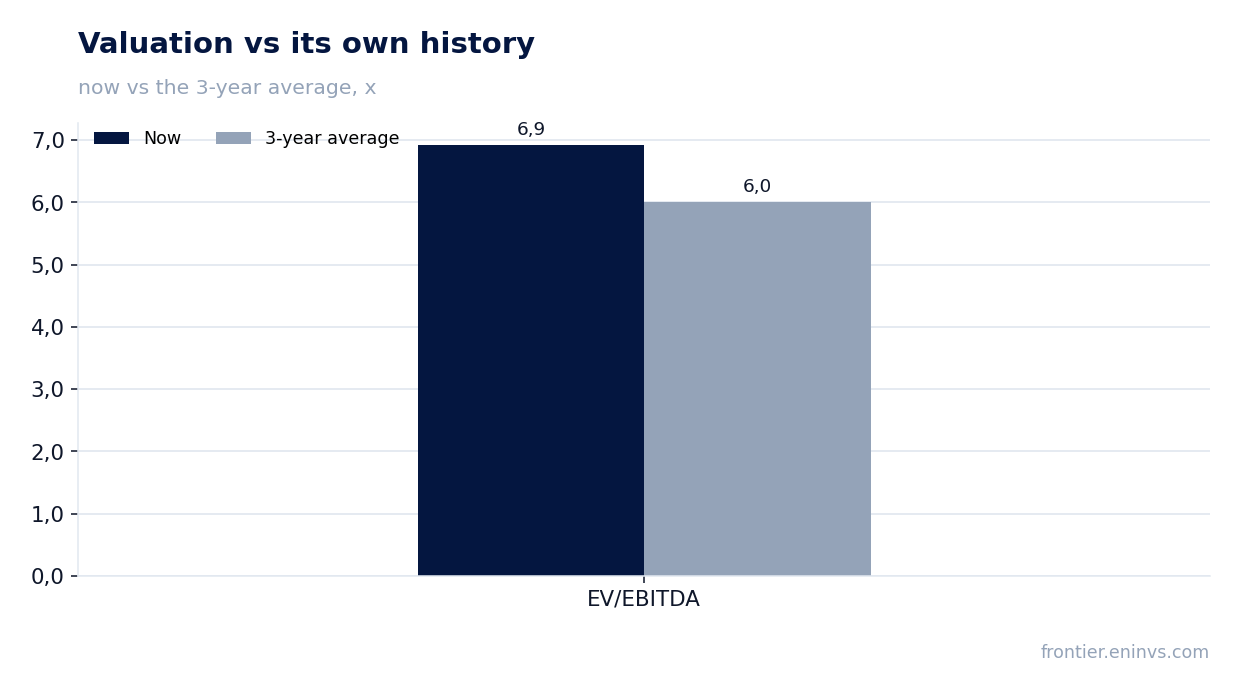
In its Q3 2026 report, California Resources Corporation posted revenue of $1,096.0 million (+24.8% YoY) and EBITDA of $341.0 million (+39.8%), yet operating profit fell to -$407.0 million and net profit to -$315.0 million versus a profit a year earlier. EBITDA margin rose to 31.1% from 27.8%, while net margin collapsed to -28.7%. With EV/EBITDA LTM at 6.9 versus its own three-year average of 6.0 and a dividend yield of 3.1%, the share looks neutral: operating momentum is strong, but profit is distorted by a one-off factor and the valuation sits above its own history.
Key takeaways
— Revenue grew 24.8% YoY, but the pace decelerated from 33.0% a quarter earlier
— EBITDA rose 39.8%, lifting the margin to 31.1% from 27.8%
— The $407.0 million operating loss and -$315.0 million net loss reflect a one-off factor, not business weakness
— Operating cash flow of $305.0 million covers capex and interest
— Leverage at 1.22x LTM EBITDA remains moderate
— A 3.1% dividend yield, with payouts at risk of being cut due to the loss
— EV/EBITDA LTM of 6.9 is 15% above its own three-year average of 6.0
Attractiveness
Key figures, USD bn
| Metric | Q3 2025 | Q3 2026 | Change |
|---|---|---|---|
| Revenue | 0.88 | 1.10 | +24.8% |
| EBITDA | 0.24 | 0.34 | +39.8% |
| Operating profit | 0.12 | -0.41 | -436.4% |
| Net profit | 0.06 | -0.32 | -592.2% |
| Operating cash flow | 0.28 | 0.30 | +9.3% |
| Capex | 0.09 | — | — |
| EBITDA margin | 27.8% | 31.1% | +3.3 pp |
| Net margin | 7.3% | -28.7% | -36.0 pp |
Revenue grew 24.8% YoY, but the pace decelerated from 33.0% a quarter earlier
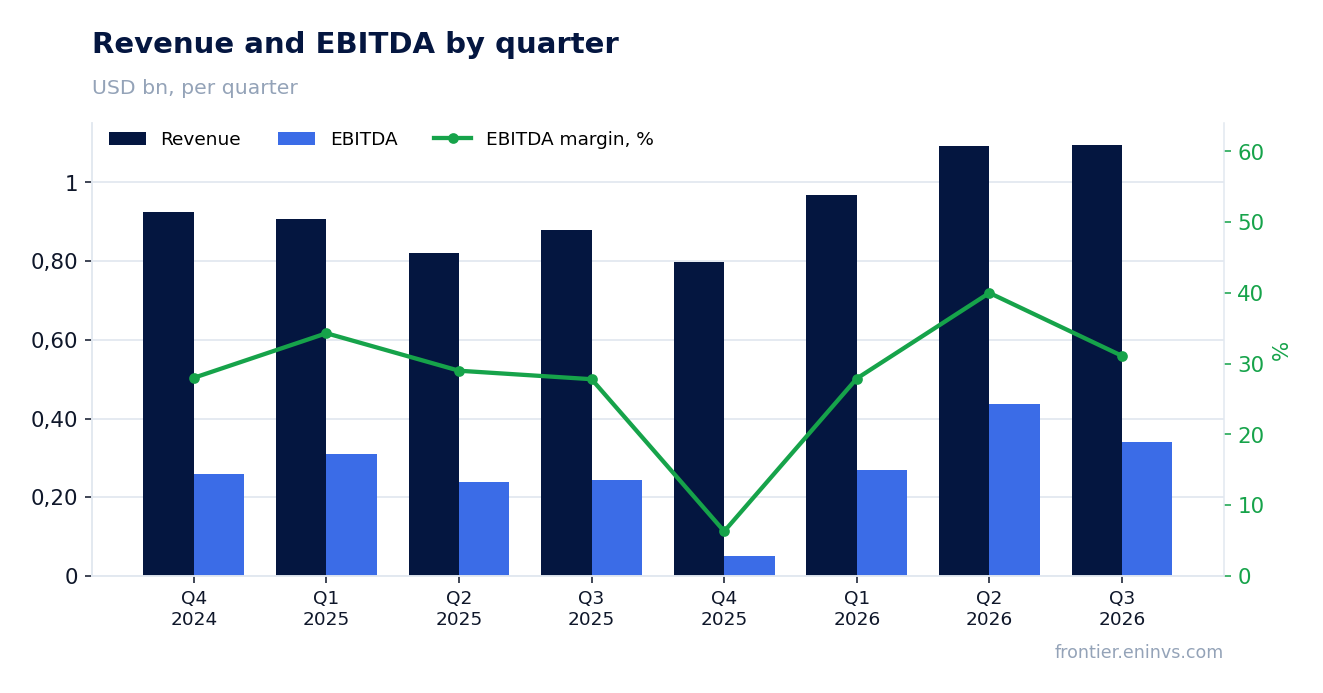
Q3 2026 revenue came in at $1,096.0 million, up 24.8% from the same quarter a year earlier. Growth remains double-digit but is slower than the previous quarter's 33.0%. The deceleration is the first signal that momentum is levelling off.
Sequential dynamics also show a slight cooling: revenue rose from $1,092.0 million in Q2 to $1,096.0 million in Q3, a mere $4.0 million increase. That is far slower than the jump from $967.0 million in Q1 to $1,092.0 million in Q2.
Still, year-on-year growth outpaces the four-quarter average: LTM revenue reached $4,000.0 million. Maintaining the current level requires only stable production and prices; further acceleration would need either higher volumes or stronger hydrocarbon prices.
EBITDA rose 39.8%, lifting the margin to 31.1% from 27.8%
Q3 2026 EBITDA reached $341.0 million, up 39.8% year on year. The EBITDA margin rose to 31.1% from 27.8% in Q3 2025. The company is not just growing revenue but keeping more of each sales dollar.
The 3.3 percentage point margin expansion on 24.8% revenue growth indicates operating costs grew slower than revenue. Yet operating profit showed -$407.0 million, incompatible with positive EBITDA of $341.0 million. The gap between the two is explained by a one-off write-down that did not affect EBITDA but hit operating profit.
LTM EBITDA stands at $818.0 million. Against LTM revenue of $4,000.0 million, that implies a margin of about 20.5% – below the quarterly level, reflecting weaker prior quarters, including Q4 2025 when EBITDA was just $50.0 million.
The $407.0 million operating loss and -$315.0 million net loss reflect a one-off factor, not business weakness
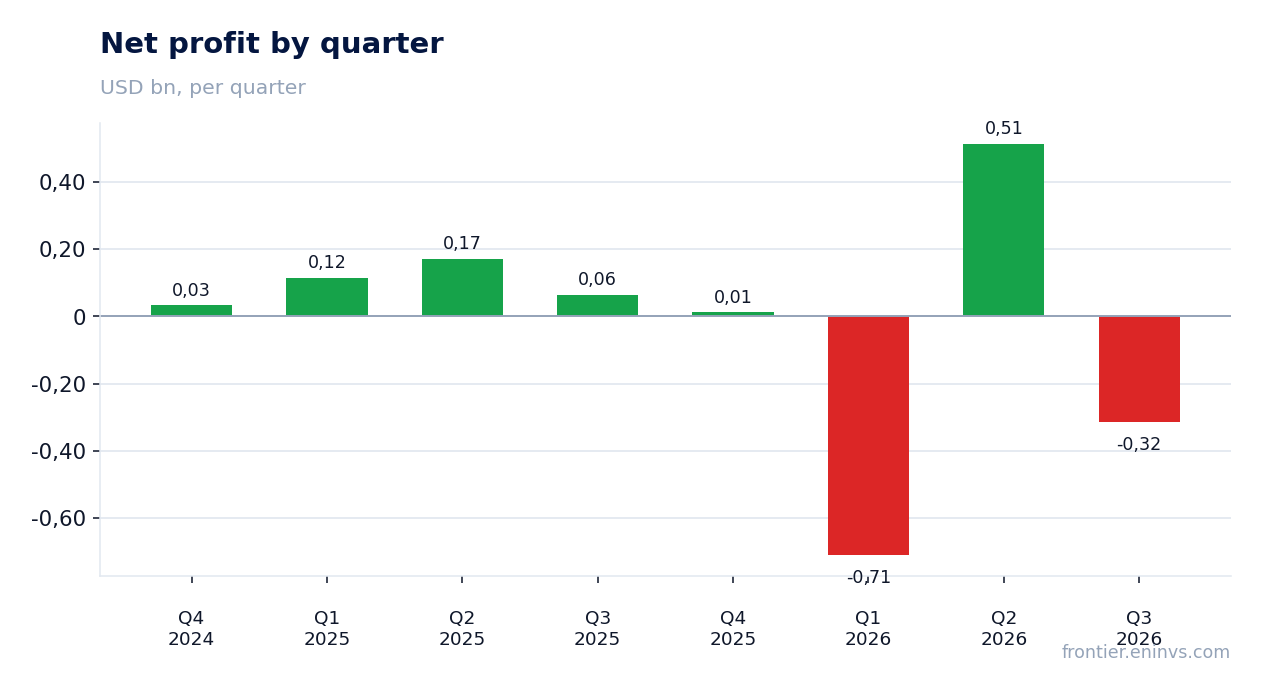
Q3 2026 operating profit came in at -$407.0 million versus a $121.0 million profit a year earlier. Net profit fell to -$315.0 million from $64.0 million. Net margin was -28.7% versus 7.3% a year earlier. Such a sharp divergence from EBITDA of $341.0 million points to a large one-off write-down that hit operating and net profit but not EBITDA.
The nature of the write-down is not disclosed in the provided facts. Its scale – the gap between EBITDA of $341.0 million and operating profit of -$407.0 million is $748.0 million – suggests it is not an operating expense but an impairment or other non-cash item. For investors, the key is that cash flow remains positive.
Excluding the one-off, profit would have been positive. This is confirmed by operating cash flow of $305.0 million, which was unaffected by the write-down. The next quarter will show whether the factor was truly one-off or will recur.
Operating cash flow of $305.0 million covers capex and interest
Q3 2026 operating cash flow was $305.0 million versus $279.0 million a year earlier. The $26.0 million increase, or about 9.3%, is slower than revenue growth but remains positive. Over the trailing twelve months, operating cash flow reached $902.0 million.
Q3 capex is not disclosed, but in Q2 it was $149.0 million and in Q1 $131.0 million. At that level, free cash flow after capex remains positive. Operating cash flow of $305.0 million comfortably covers interest expense and dividends.
Q4 2025 was weak on EBITDA – just $50.0 million – yet operating cash flow that quarter was $235.0 million. This shows the company's cash flow is less volatile than profit and rests on stable production. For a shareholder, that matters more than one-off write-downs.
Leverage at 1.22x LTM EBITDA remains moderate
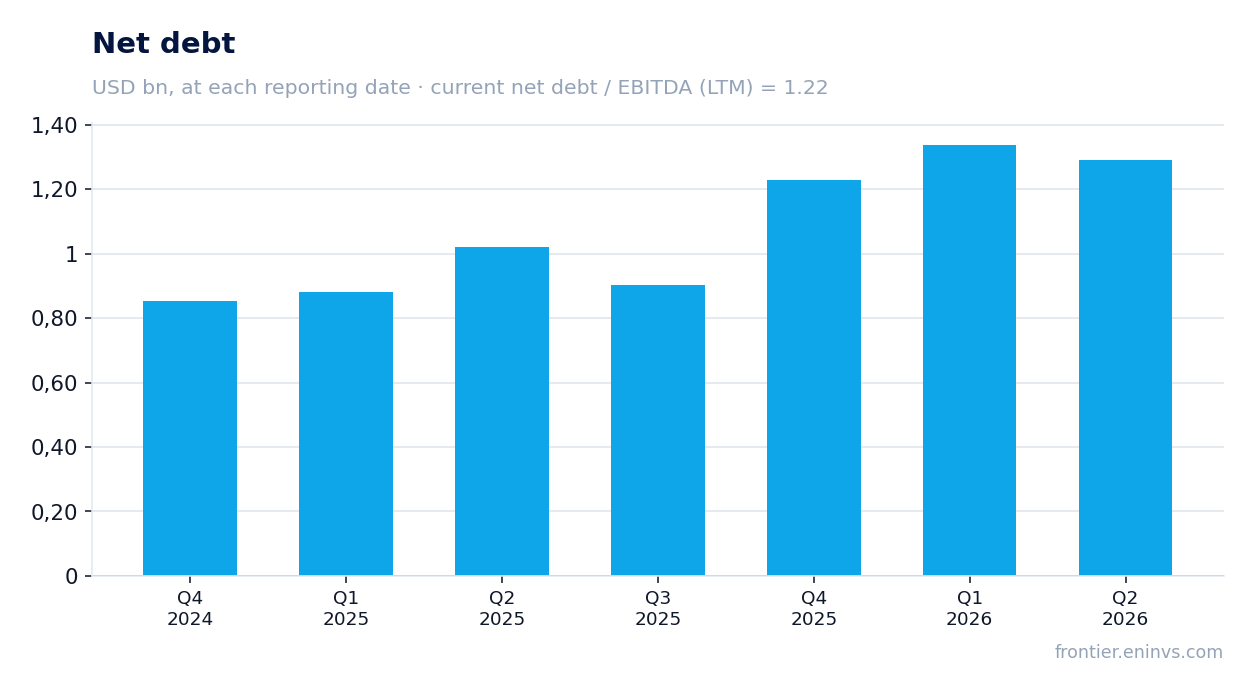
Net debt at the latest reporting date is $1,000.0 million, and the net debt to LTM EBITDA ratio is 1.22. That is a moderate level for an oil and gas company, leaving room to manoeuvre if hydrocarbon prices fall.
The cost of capital remains acceptable: EV/EBITDA LTM of 6.9 with a market cap of $4,666.6 million and net debt of $1,000.0 million implies an enterprise value of about $5,666.6 million. Against LTM EBITDA of $818.0 million, that matches the stated multiple.
The direction of debt change is not disclosed in the facts, so only the current level can be stated. For investors, the key is that leverage is below 2.0x EBITDA – a comfortable threshold for the sector. However, if EBITDA falls to the Q4 2025 level, the ratio would rise.
A 3.1% dividend yield, with payouts at risk of being cut due to the loss
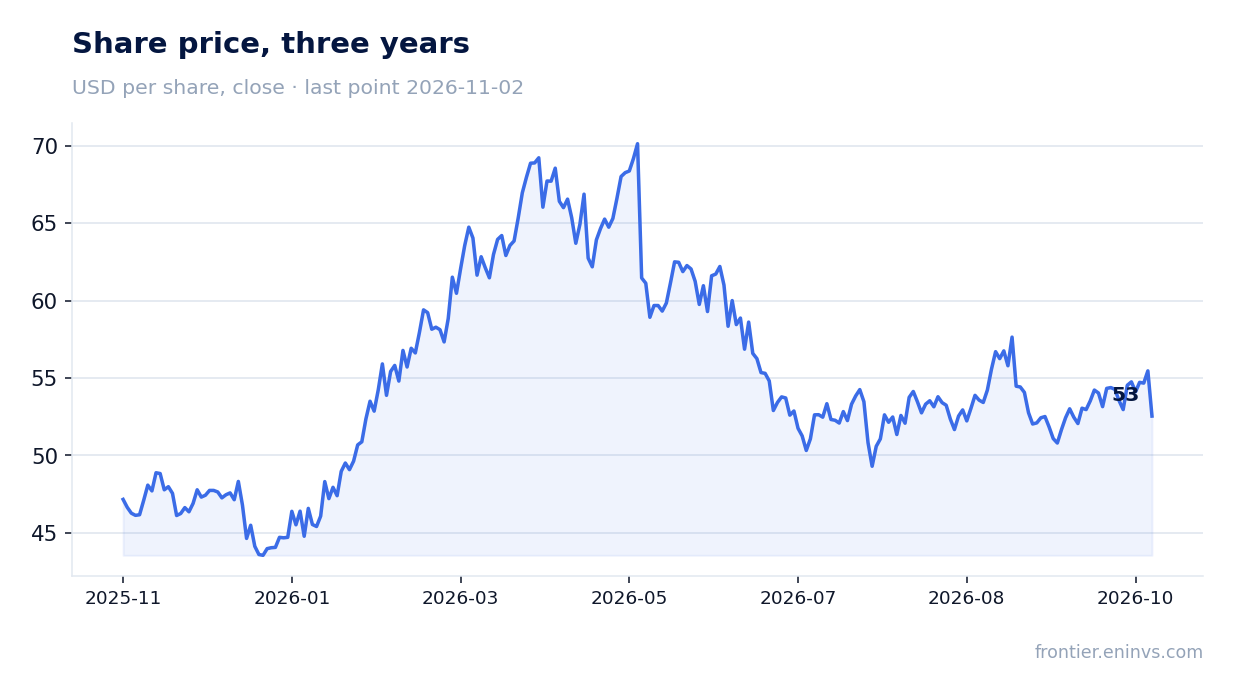
The trailing twelve-month dividend yield is 3.1%. The company pays dividends, and at the current price they yield about 3.1% – below the risk-free rate but above many oil and gas companies with growth.
However, Q3 2026 net profit is negative at -$315.0 million. If the loss persists for the full year, the dividend may be revised. Our estimate: the current year could bring a dividend close to last year's, but it hinges on whether the one-off factor remains one-off. If the write-down recurs, the dividend is at risk.
For a shareholder, the dividend is an important part of return but not the only one. Operating cash flow of $305.0 million covers payouts, but at lower oil prices coverage would thin. A dividend cut is the main risk to income.
EV/EBITDA LTM of 6.9 is 15% above its own three-year average of 6.0
The EV/EBITDA LTM multiple is 6.9 versus its own three-year average of 6.0. That is 15% above the historical level. The share trades richer than usual relative to its own history.
On the portal's model, which re-prices EBITDA at current commodity prices at the target EV/EBITDA, the upside to fair value is +11%. This is our own estimate, not a market consensus.
The current valuation rests on EBITDA recovery, but if profit remains under pressure from one-off factors, the multiple may prove inflated. For investors, the key is that revenue growth is decelerating and the valuation is above average – that limits upside.
Valuation on the latest reported figures
| Metric | Value |
|---|---|
| Market cap | 4.67 bn USD |
| EV/EBITDA (LTM) | 6.9 |
| P/B | 1.27 |
| Net debt / EBITDA (LTM) | 1.22 |
| Operating cash flow (LTM) | 0.90 bn |
| ROE | -39.2% |
| Dividend yield (12m) | 3.1% |
| EV/EBITDA, 3-year average | 6.0 |
Bottom line
The report's strength is revenue growth of 24.8% and EBITDA growth of 39.8% with margin expansion to 31.1%. The weakness is the $407.0 million operating loss and -$315.0 million net loss, driven by a one-off write-down whose nature is undisclosed. Cash flow of $305.0 million remains positive, and leverage at 1.22x LTM EBITDA is moderate. The key question for a holder is whether the one-off was truly one-off and whether the dividend holds. With the multiple above its own history and growth decelerating, the share looks neutral.
Open the company's financial profile CRC →
See also: market overview · valuation map · stock screeners