Comstock Resources, Inc.: cheaper gas, but 9.5% higher output and unit costs held EBITDA, while the $1.65bn SOCAR deal takes the debt question off the table

On 5 November Comstock Resources, Inc. released its third-quarter 2026 results. The Henry Hub benchmark averaged $2.893 in the period against $3.083 a year earlier (–6.2%), and at unchanged volumes and costs that would have implied revenue of $423.2m and EBITDA of $180.9m on our calculation; actual revenue was $384.4m and EBITDA $208.6m – the company earned $27.7m above the price-implied figure thanks to 9.5% higher output and lower unit costs. At an EV/EBITDA of 5.7 against its own three-year average of 7.0 the share is cheaper than its history, but the portal's model at current prices implies –65% upside, so our view on the stock is neutral.
Key takeaways
— The Henry Hub price fell 6.2% year on year, and without higher output revenue would have been lower
— EBITDA came in $27.7m above the price-implied figure thanks to volumes and unit costs
— Output rose 9.5% year on year and 8% quarter on quarter on the drilling programme
— Unit cost of $0.80 per Mcfe rose 3.9%, but lease operating costs fell 11.5%
— Hedges delivered $39.5m of realised settlements, but they sit outside EBITDA
— Net debt of $3.4bn is 2.77x LTM EBITDA, and the $1.65bn SOCAR deal will cut it
— EV/EBITDA of 5.7 is below its own three-year average of 7.0, but at current prices the portal's model implies –65%
Attractiveness
Key figures, USD bn
| Metric | Q3 2025 | Q3 2026 | Change |
|---|---|---|---|
| Revenue | 0.45 | 0.38 | -14.6% |
| EBITDA | 0.21 | 0.21 | +0.5% |
| Operating profit | 0.05 | 0.02 | -54.3% |
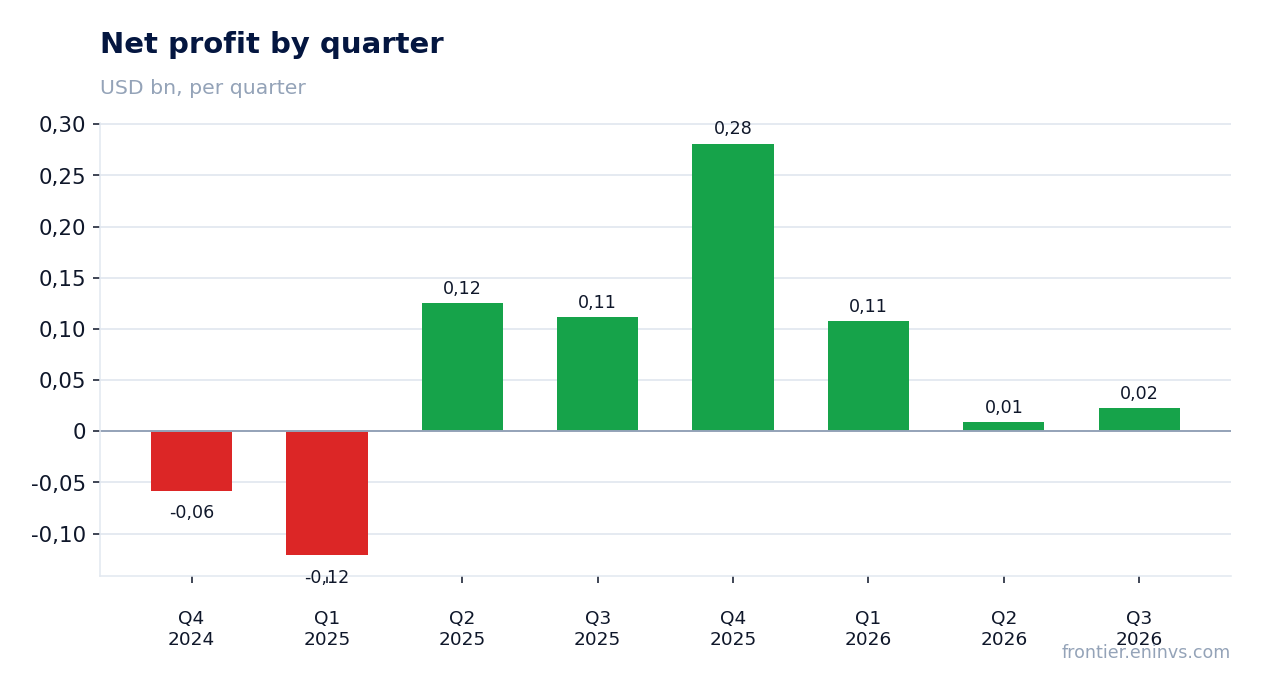
| Net profit | 0.11 | 0.02 | -80.0% |
| Operating cash flow | 0.15 | 0.18 | +17.7% |
| Capex | 0.34 | 0.45 | +32.4% |
| EBITDA margin | 46.2% | 54.3% | +8.1 pp |
| Net margin | 24.7% | 5.8% | -18.9 pp |
The Henry Hub price fell 6.2% year on year, and without higher output revenue would have been lower
The Henry Hub benchmark averaged $2.893 in Q3 2026 against $3.083 a year earlier – a 6.2% decline. Against the previous quarter the price fell 1.1%, to $2.926. On 6 November spot was $2.94, 1.6% above the period average.
Revenue for the quarter was $384.4m, 14.6% below a year earlier. On our calculation, at last year's volumes and costs and with only the price moving, revenue would have been $423.2m – a price effect of –$26.7m, or –5.9%. Actual revenue came in $38.8m below that benchmark, and the gap is explained by revenue mix: the period included gas services revenue of $64.5m against $141.3m a year earlier.
The realised price before hedges was $2.61 per Mcfe against $2.76 a year earlier (–5.4%). The ratio of realised price to the benchmark stayed at 0.90, as a year earlier – the discount to Henry Hub did not change.
Commodity prices: period average and now
| Benchmark | Year ago | Q3 2026 | YoY | Spot 2026-11-06 |
|---|---|---|---|---|
| Henry Hub, USD | 3,08 | 2,89 | -6,2% | 2,94 |
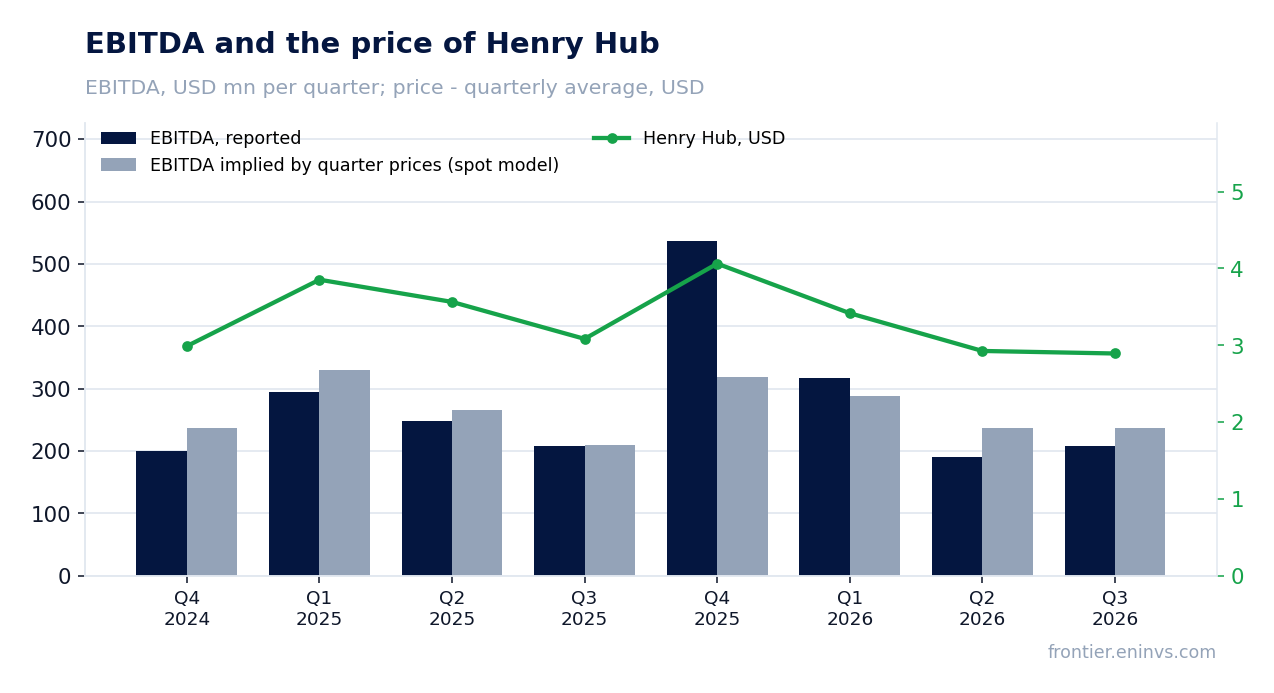
EBITDA came in $27.7m above the price-implied figure thanks to volumes and unit costs
EBITDA for the quarter was $208.6m, 0.5% above a year earlier. On our calculation, at last year's volumes and costs and with only the price moving, EBITDA would have been $180.9m – the actual figure was $27.7m, or 15.3%, higher.
The gap is explained by volumes and unit costs. Output rose 9.5% year on year while the realised price before hedges fell 5.4%, which multiplies to +3.6% for sales of own production. Total production cost rose 3.9%, to $0.80 per Mcfe, but lease operating costs fell 11.5%, to $0.23 per Mcfe, and production taxes fell 10.0%, to $0.09 per Mcfe.
The EBITDA margin was 54.3% against 46.2% a year earlier. The margin rose while the realised price fell because of revenue mix: the share of low-margin gas services shrank, and their margin turned positive – $5.1m against –$0.4m a year earlier.
The portal's spot model, re-priced from the average of the previous four quarters to this period's prices, expected EBITDA of $236.5m and revenue of $473.7m; actual EBITDA was 11.8% below that and revenue 18.9% below. That estimate disagrees in direction with the year-ago calculation, and we rely on the latter.
What the prices implied and what the company earned
| Base (Q3 2025) | Implied at period prices | Reported | Reported vs implied | |
|---|---|---|---|---|
| Revenue, USD mn | 449,9 | 423,2 | 384,4 | -9,2% |
| EBITDA, USD mn | 207,6 | 180,9 | 208,6 | +15,3% |
| EBITDA, portal spot model, USD mn | — | 236,5 | 208,6 | -11,8% |
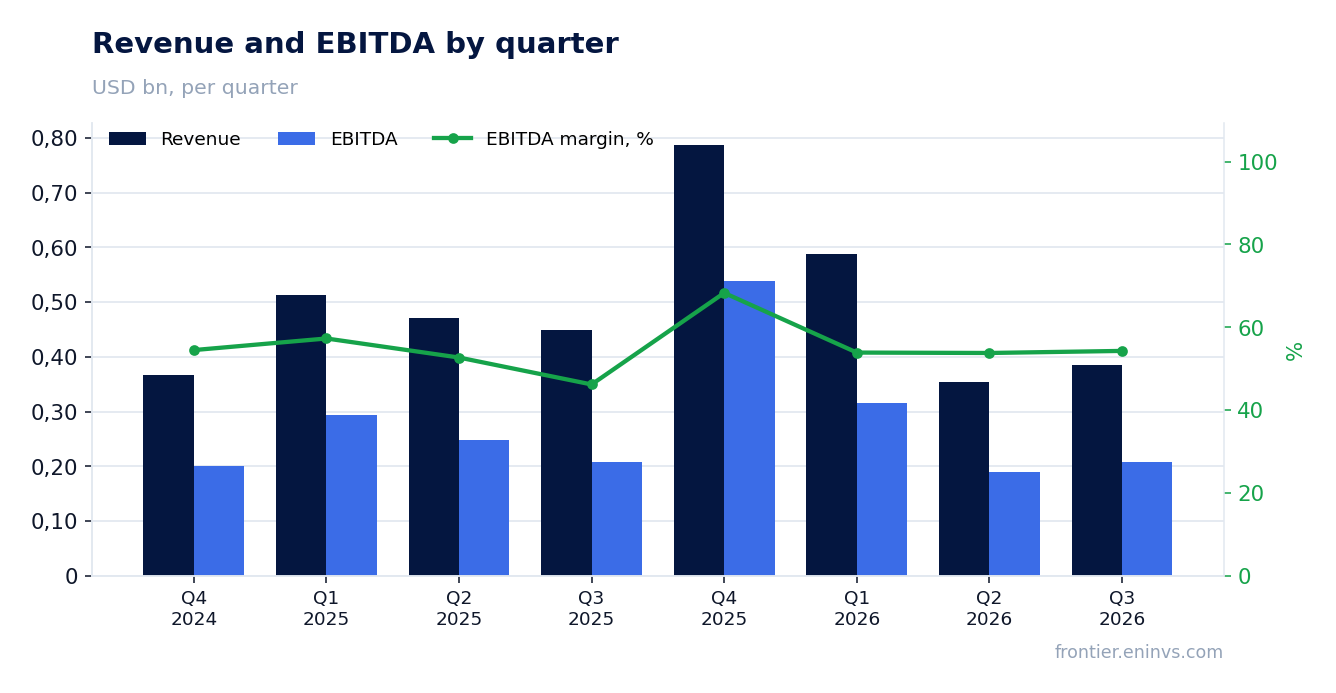
Output rose 9.5% year on year and 8% quarter on quarter on the drilling programme
Total production in Q3 was 122,432 MMcfe against 111,837 a year earlier, up 9.5%. Gas output rose 9.5%, to 122,392 MMcf, while oil output fell 36.4%, to 7 Mbbls, but oil accounts for less than 1% of revenue.
The growth came from the drilling programme. The company drilled 21 wells (13.9 net) with an average lateral length of 10,967 feet and turned 23 wells (20.4 net) to sales. Sixteen Legacy Haynesville wells averaged an initial rate of 25 MMcf per day, and six Western Haynesville wells averaged 33 MMcf per day.
Output rose 8% against the previous quarter, which explains why quarterly revenue came in 10.0% above the price-implied figure at Q2 volumes and EBITDA 12.1% above.
Production, realised price and unit cost (company release)
| Metric | Year ago | Reported period | YoY |
|---|---|---|---|
| Total production, MMcfe | 111 837 | 122 432 | +9,5% |
| Natural gas production, MMcf | 111 770 | 122 392 | +9,5% |
| Average price (before hedges), $/Mcfe | 2,76 | 2,61 | -5,4% |
| Average price including hedging, $/Mcfe | 3,00 | 2,94 | -2,0% |
| Average natural gas price (before hedges), $/Mcf | 2,75 | 2,61 | -5,1% |
| Total production costs, $/Mcfe | 0,77 | 0,80 | +3,9% |
| Gathering and transportation, $/Mcfe | 0,36 | 0,41 | +13,9% |
| Lease operating, $/Mcfe | 0,26 | 0,23 | -11,5% |
| Production and ad valorem taxes, $/Mcfe | 0,10 | 0,09 | -10,0% |
| Cash general and administrative, $/Mcfe | 0,05 | 0,07 | +40,0% |
Unit cost of $0.80 per Mcfe rose 3.9%, but lease operating costs fell 11.5%
Total production cost was $0.80 per Mcfe against $0.77 a year earlier, up 3.9%. Within it, gathering and transportation rose 13.9%, to $0.41 per Mcfe, and cash G&A rose 40.0%, to $0.07 per Mcfe.
Lease operating costs fell 11.5%, to $0.23 per Mcfe, and production taxes fell 10.0%, to $0.09 per Mcfe. Lower variable costs alongside 9.5% higher output were one source of the EBITDA beat against the price-implied figure.
Gathering and transportation rising 13.9% while output rose 9.5% means unit transport costs increased – that limits the scale effect.
Hedges delivered $39.5m of realised settlements, but they sit outside EBITDA
Realised hedge settlements were $39.5m for the quarter. The realised price including hedges was $2.94 per Mcfe against $3.00 a year earlier (–2.0%), while before hedges it was $2.61 (–5.4%).
These settlements are not in EBITDA: they are booked in 'Gain from derivative financial instruments' within other income, below operating profit. Hedges therefore explain the after-hedge realised price and net profit, but not EBITDA or its gap to the price-implied figure.
The $35.1m unrealised gain on hedges is also booked below operating profit. Excluding it and exploration expense of $10.7m, adjusted net income would have been $5.9m, or $0.02 per share, against reported $22.3m, or $0.08.
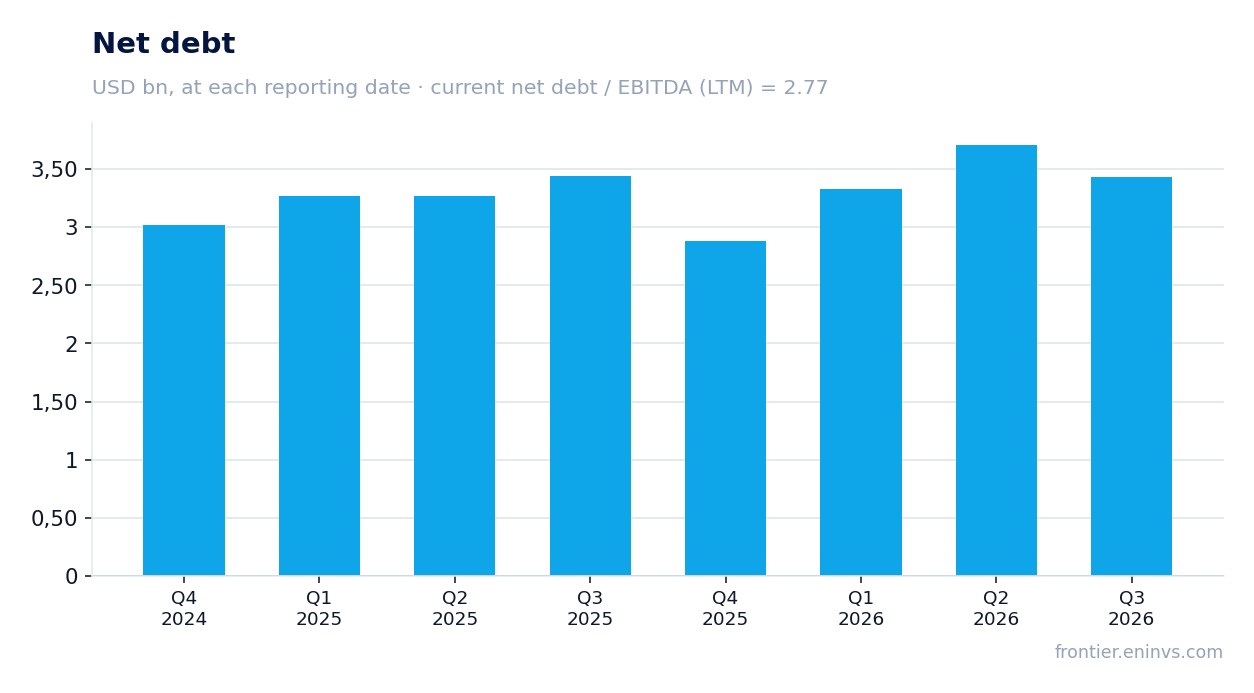
Net debt of $3.4bn is 2.77x LTM EBITDA, and the $1.65bn SOCAR deal will cut it
Net debt at 30 September 2026 was $3,434.3m, or $3.4bn. At 30 June it was $3.7bn, a $0.3bn reduction over the quarter; a year earlier, at 30 September 2025, it was $3.4bn, unchanged over 12 months.
Net debt to LTM EBITDA is 2.77x. Operating cash flow for the quarter was $180.2m and capital expenditure $452.2m, so investment was more than twice operating cash flow.
The SOCAR deal to sell non-operated interests – 20% of Legacy Haynesville, 15% of Western Haynesville and 15% of Pinnacle Gas Services – for $1.65bn, effective 1 July 2026, is expected to close by year end. After closing and debt retirement the credit facility maturity extends to 15 November 2031. This is the main factor that will take the debt question off the table.
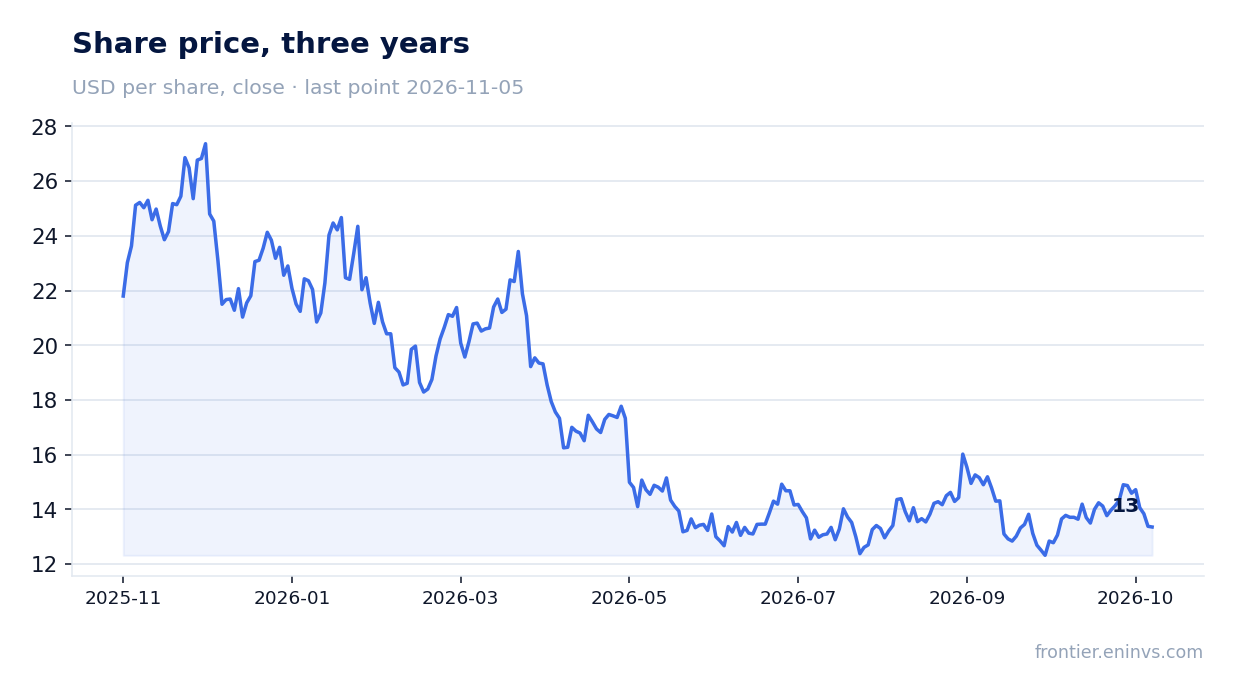
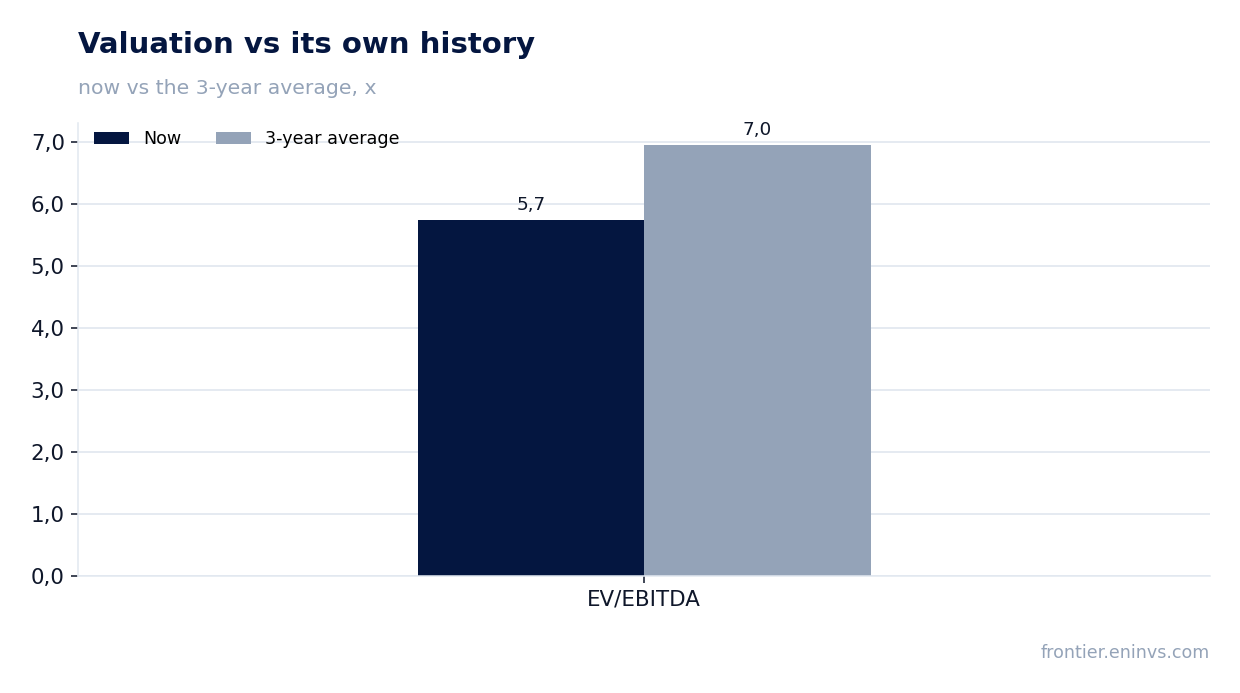
EV/EBITDA of 5.7 is below its own three-year average of 7.0, but at current prices the portal's model implies –65%
LTM EV/EBITDA is 5.7 against its own three-year average of 7.0, 17% below its history. LTM P/E is 9.3. Market capitalisation is $3.9bn.
LTM, however, reflects past prices. On the portal's spot model, annual EBITDA at today's prices is $996.7m against $1,252.5m over the last 12 months, down 20.4%. At current prices EV/EBITDA is 7.4 and net debt to EBITDA is 3.45x.
The portal's model at current prices implies –65% upside to fair value. This is our own estimate, not a consensus. The share closed at $13.38 before the release, fell 0.2% on the release day and 0.2% from the release to 5 November.
Reserve life at the current production rate is 15.2 years. The company pays no dividends, so the dividend factor does not enter the valuation.
Valuation on the latest reported figures
| Metric | Value |
|---|---|
| Market cap | 3.92 bn USD |
| P/E (LTM) | 9.3 |
| EV/EBITDA (LTM) | 5.7 |
| P/B | 1.32 |
| Net debt / EBITDA (LTM) | 2.77 |
| Operating cash flow (LTM) | 0.85 bn |
| ROE | 3.4% |
| EV/EBITDA, 3-year average | 7.0 |
Bottom line
The quarter's strength was 9.5% higher output and an 11.5% cut in lease operating costs: with Henry Hub down 6.2% that held EBITDA at $208.6m, $27.7m above the price-implied figure. The weakness remains the price: at today's $2.94 EBITDA is estimated at $996.7m, 20.4% below LTM, and the portal's model implies –65% to fair value. The one-off in profit was the $35.1m unrealised hedge gain, without which adjusted income was $5.9m. The key question for a holder is whether the $1.65bn SOCAR deal closes and cuts the $3.4bn debt; at 5.7x against its own history of 7.0 the share is cheaper, but at current gas prices the cushion is thin, so the verdict is neutral.
Open the company's financial profile CRK →
See also: market overview · valuation map · stock screeners