Devon Energy Corporation: revenue up 38.8% but the spot model expected more — and reserve life is just 7.9 years

On 5 November Devon Energy Corporation released third-quarter 2026 results: revenue of USD 5,900 million (+38.8% year on year), net profit of USD 1,000 million (+45.6%) and operating cash flow of USD 2,800 million. The portal's spot model expected revenue of 5,364.5 million, so the company beat it by 10.0%, but EBITDA was not disclosed, leaving the key question open: did it earn what prices implied? The share looks neutral: EV/EBITDA of 6.8 sits exactly at its own three-year average of 7.1, and short reserve life plus the missing EBITDA figure leave no room for a premium.
Key takeaways
— Revenue rose 38.8% year on year, but growth decelerated from 73.0% a quarter earlier — the second-quarter base was exceptionally high
— The portal's spot model expected revenue of 5,364.5 million; the company delivered 5,900 million, a 10.0% beat
— Third-quarter EBITDA was not disclosed, so there is no way to verify whether the company earned the price
— Net profit of 1,000 million at a 16.9% margin is only 0.7 percentage points above last year's 16.2%
— Operating cash flow of 2,800 million covered capital expenditure of 1,496 million almost twice over
— Net debt of 8,109 million equals 1.0x trailing-twelve-month EBITDA — a moderate burden
— Reserve life at the current production rate is 7.9 years, the main constraint for a long-term holder
Attractiveness
Key figures, USD bn
| Metric | Q3 2025 | Q3 2026 | Change |
|---|---|---|---|
| Revenue | 4.25 | 5.90 | +38.8% |
| EBITDA | 1.79 | — | — |
| Operating profit | 0.91 | — | — |
| Net profit | 0.69 | 1.00 | +45.6% |
| Operating cash flow | 1.69 | 2.80 | +65.7% |
| Capex | 0.87 | 1.50 | +72.0% |
| EBITDA margin | 42.1% | — | — |
| Net margin | 16.2% | 16.9% | +0.7 pp |
Revenue rose 38.8% year on year, but growth decelerated from 73.0% a quarter earlier — the second-quarter base was exceptionally high
In the third quarter of 2026 revenue was USD 5,900 million against 4,251 million a year earlier — growth of 38.8%. That is a strong result, but noticeably smaller than the second quarter's 73.0% increase to 7,003 million. The deceleration is explained primarily by the base: the second quarter of 2026 was exceptionally high, and the third quarter pulled back from it.
The quarterly sequence shows growth is not linear: after 4,508 million in the first quarter, revenue jumped to 7,003 million in the second and fell to 5,900 million in the third. For a commodity producer such amplitude follows prices and volumes, not a one-off asset sale. Year on year the third quarter is still 38.8% higher, and that is the key fact for valuation.
Whether price or production drove the increase is not visible from the disclosed data. The company gives neither the average realised price nor quarterly production volume, so the cause of the revenue growth cannot be named. It is more honest to record the level and the direction: revenue is growing at a double-digit rate, but the rate is slowing.
The portal's spot model expected revenue of 5,364.5 million; the company delivered 5,900 million, a 10.0% beat
The portal's spot model re-prices the average of the previous four quarters at the reporting period's prices. It expected third-quarter 2026 revenue of USD 5,364.5 million and EBITDA of 2,516.5 million. Actual revenue came in 10.0% above the model.
Comparing actual EBITDA with the model is impossible: the company did not disclose the figure for the third quarter. In the four preceding periods the deviation of actual EBITDA from the model was +28.1%, +8.0%, -4.0% and +31.2% — the model erred in both directions and sometimes widely. Without reported EBITDA there is no way to tell whether the company earned the price or the revenue beat went into costs.
A 10.0% revenue beat with no EBITDA data leaves the key question open. If the margin held, the company earned more than the model; if costs rose, revenue may not have reached profit. For a commodity producer this is the central fork, and until EBITDA is disclosed the assessment remains incomplete.
What the prices implied and what the company earned
| Base (—) | Implied at period prices | Reported | Reported vs implied | |
|---|---|---|---|---|
| EBITDA, portal spot model, USD mn | — | 2 516 | — | — |
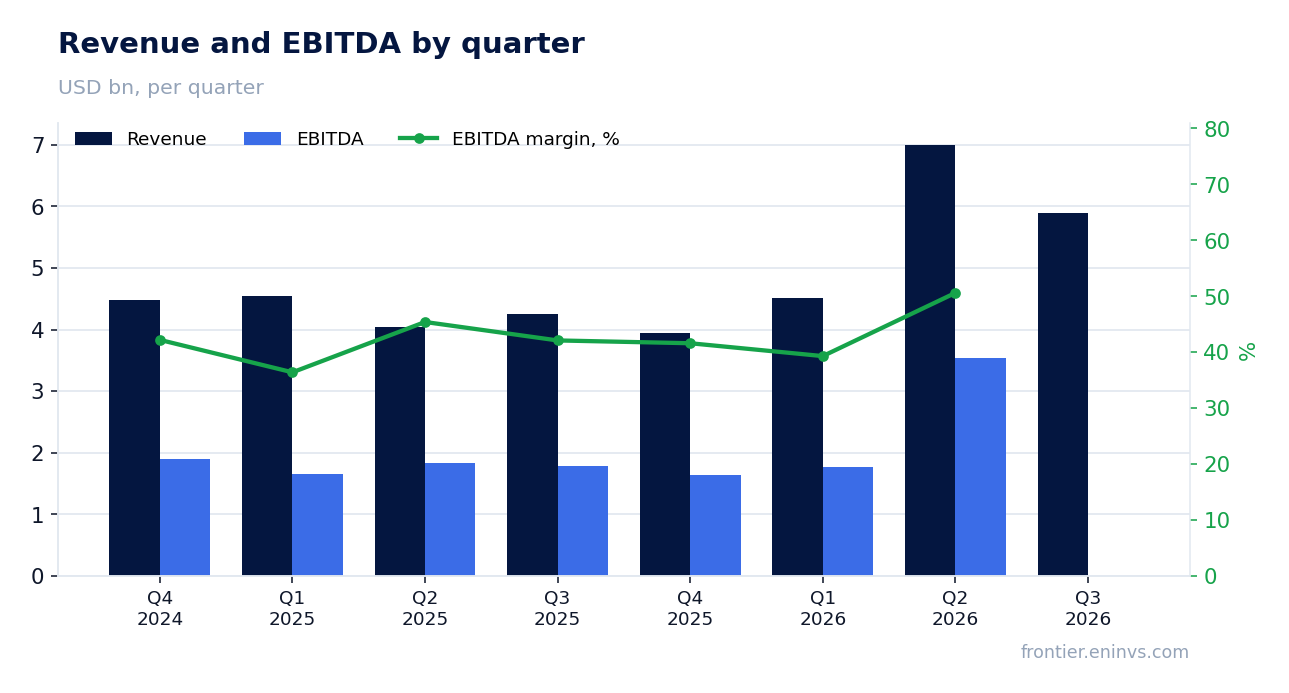
Third-quarter EBITDA was not disclosed, so there is no way to verify whether the company earned the price
The company did not disclose EBITDA for the third quarter of 2026. Trailing-twelve-month EBITDA was USD 8,110.1 million, but that is a sum of four quarters and cannot be attached to the reporting period. For a commodity producer EBITDA is the main measure of what remains after variable costs, and its absence removes the analytical anchor.
Profitability can be judged indirectly from net profit: 1,000 million for the quarter on revenue of 5,900 million. But net profit includes items below the operating line — interest, taxes, possible one-offs — so it does not substitute for EBITDA. There is nothing to compare with the portal model's expected EBITDA of 2,516.5 million.
For an investor this means the report gives revenue and profit but not the answer to the commodity producer's key question: how much was earned per unit after variable costs. The next report with disclosed EBITDA will test whether the company held its margin on higher revenue.
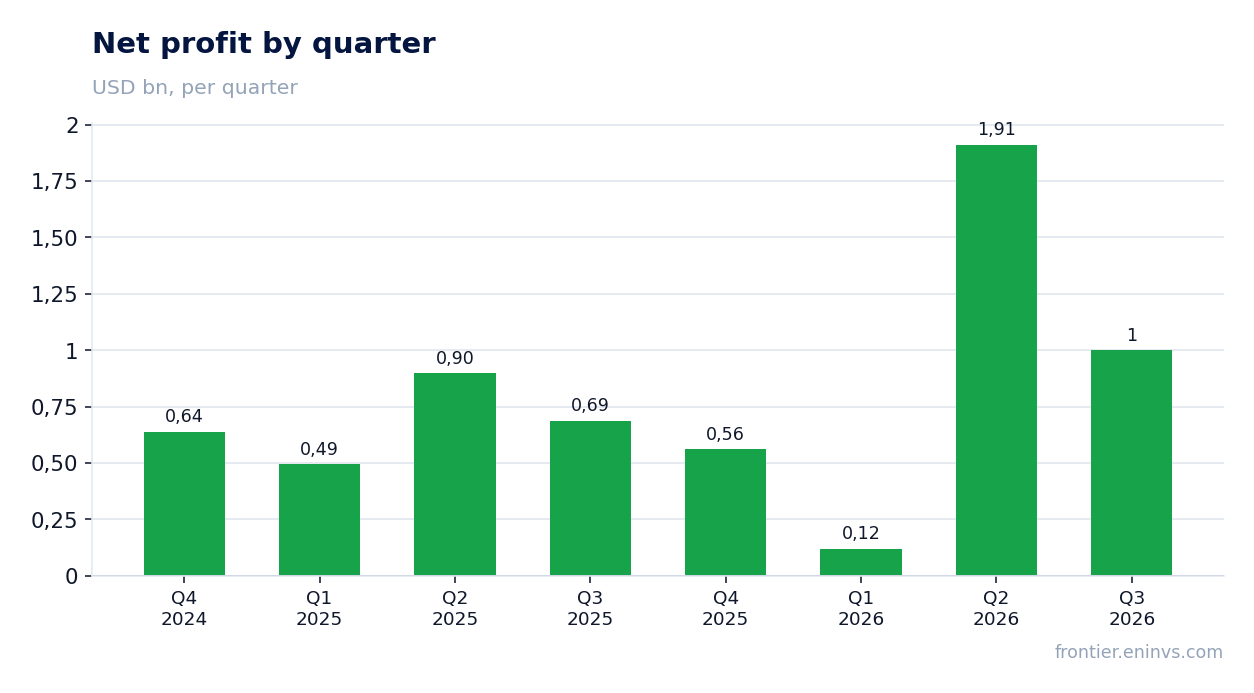
Net profit of 1,000 million at a 16.9% margin is only 0.7 percentage points above last year's 16.2%
Third-quarter 2026 net profit was USD 1,000 million, up 45.6% year on year. The margin rose from 16.2% to 16.9% — only 0.7 percentage points. Profit grew almost in proportion to revenue rather than through improved profitability.
That is an important signal: 38.8% revenue growth was not accompanied by a noticeable margin expansion. If the company earned more per unit, the margin would have risen more. Holding the margin at the prior level means higher prices or volumes were partly eaten by costs — but which costs is not visible from the disclosed data.
Profit of 1,000 million on revenue of 5,900 million is 16.9% against 16.2% a year earlier. The difference is small, and no efficiency-growth story can be built on it. For a commodity producer such margin stability rather suggests the company operates in a narrow corridor between price and cost.
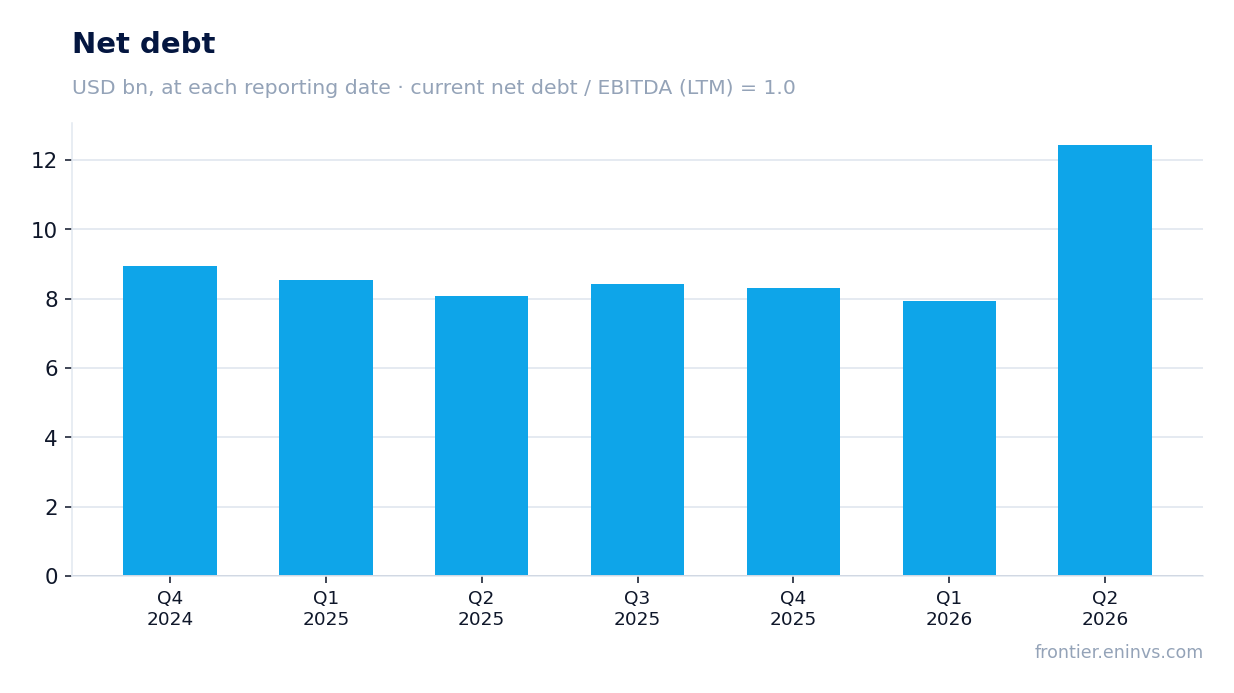
Operating cash flow of 2,800 million covered capital expenditure of 1,496 million almost twice over
Third-quarter 2026 operating cash flow was USD 2,800 million, capital expenditure 1,496 million. Free cash flow before dividends is therefore about 1,304 million — our calculation from the two reported figures. The company funds reinvestment in production from its own flow and still leaves a buffer.
Capital expenditure rose: a year earlier, in the third quarter of 2025, it was 870 million. The increase to 1,496 million is the price of sustaining or growing production. For a commodity producer capex is not an 'investment in the future' in a general sense but a condition for keeping volume: without it production falls.
A flow of 2,800 million against capex of 1,496 million means the company covers reinvestment roughly twice over. That is a healthy ratio, but it does not say what remains after dividends. The trailing-twelve-month dividend yield is 2.6%, and on such a flow the payout looks covered, though its size depends on profit and company policy.
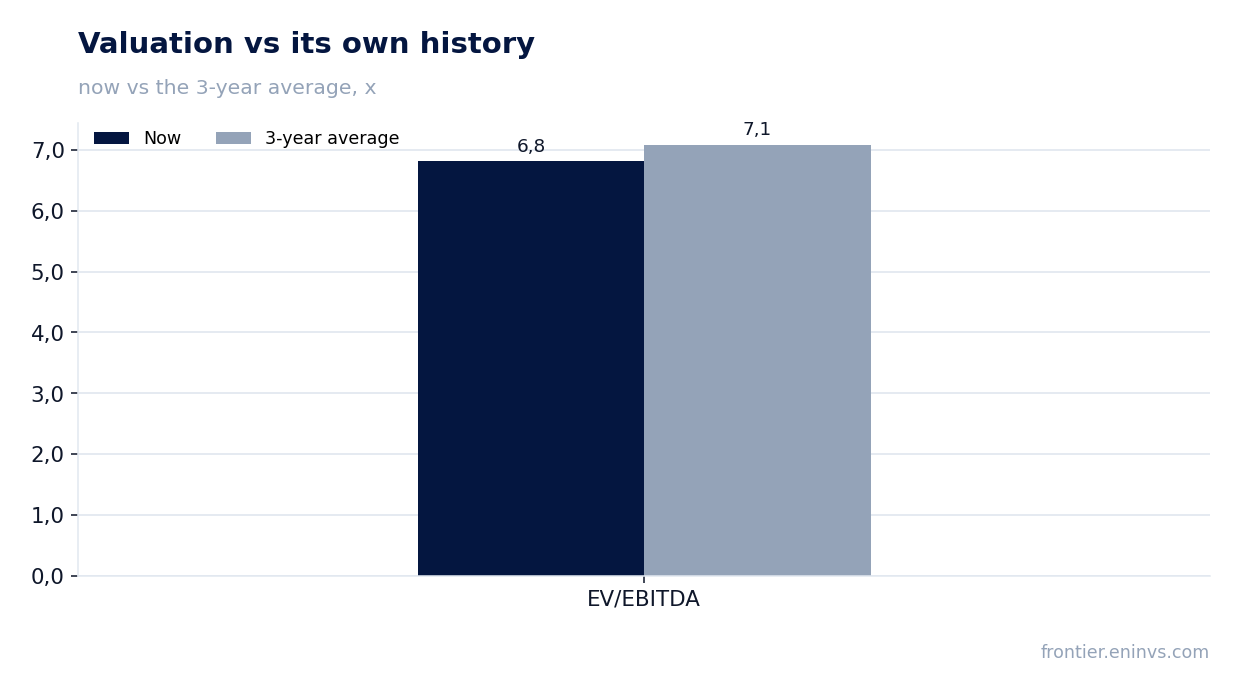
Net debt of 8,109 million equals 1.0x trailing-twelve-month EBITDA — a moderate burden
Net debt at the latest annual balance-sheet date was USD 8,109 million, equal to 1.0x trailing-twelve-month EBITDA. That is a moderate level for a commodity producer: debt equals one year's EBITDA, and on the current cash flow the company services it without strain. The direction of the ratio cannot be stated — no earlier value is in the data.
Trailing-twelve-month operating cash flow was 9,663 million, more than ten times net debt. Interest expense is not broken out in the disclosed data, so the cost of servicing debt cannot be assessed. But with a flow of 9,663 million against debt of 8,109 million the company has room to manoeuvre.
Moderate debt is what gives the company resilience when prices fall. If EBITDA halves, the ratio rises to 2.0 — still acceptable. But with short reserve life (7.9 years) debt matters more: the company must keep reinvesting in production to avoid losing volume.
Reserve life at the current production rate is 7.9 years, the main constraint for a long-term holder
Reserve life at the current production rate is 7.9 years. That means at today's production pace proved reserves last less than eight years. For a commodity producer that is a short horizon: an investor buying the share for the long term must understand the company has to replenish reserves constantly, or production will start to fall.
Short reserve life also explains elevated capex: 1,496 million a quarter is not only sustaining current output but an attempt to extend field life. If reinvestment does not add reserves, the company will have to cut production or buy new assets, which would hit debt and the dividend.
For the share this caps the multiple. EV/EBITDA of 6.8 with 7.9 years of reserves is neither cheap nor expensive but exactly what the market pays for a company with a short horizon. A long-term investor must build the depletion risk into the entry price.
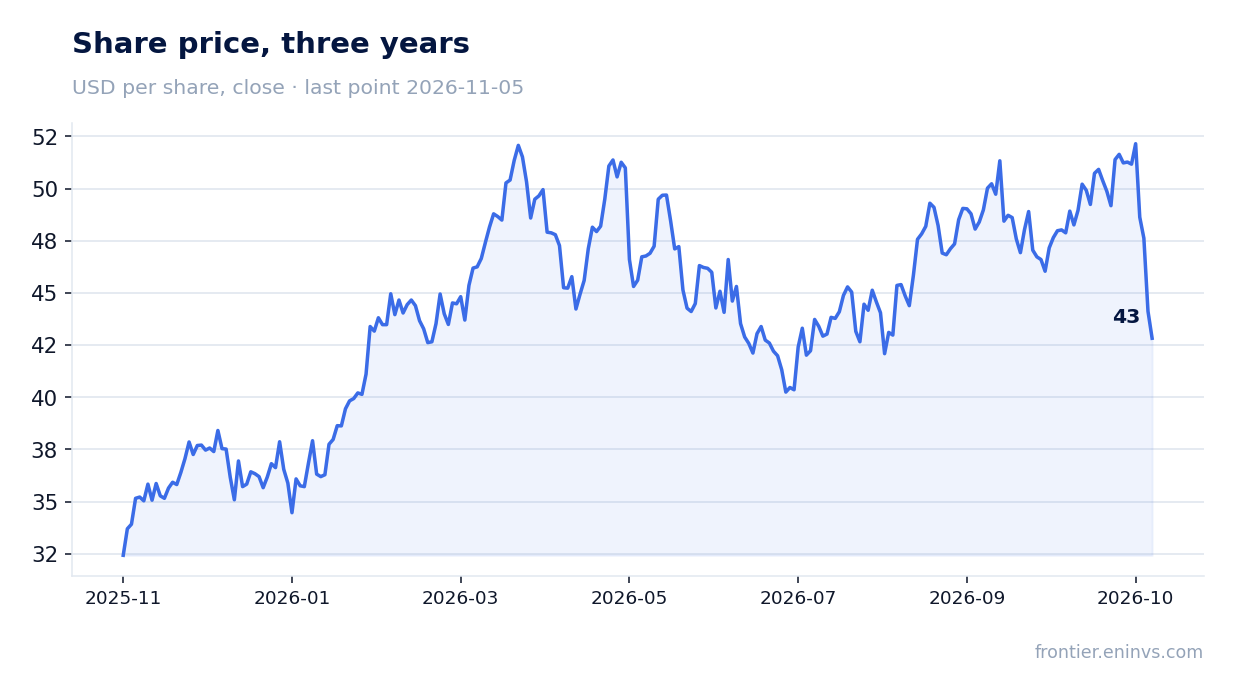
EV/EBITDA of 6.8 sits exactly at the three-year average of 7.1, and the market gives no growth premium
Trailing-twelve-month EV/EBITDA is 6.8, the three-year average 7.1. The multiple sits at its historical level, a deviation of minus 4%, within 5%. The market values the company exactly as it has for three years, despite 38.8% revenue growth.
Trailing-twelve-month P/E is 13.1 and market capitalisation 47,112 million. With trailing-twelve-month net profit of 3,593 million and revenue of 21,300 million, the company trades at about 13 times earnings. That is not cheap for a commodity producer with short reserve life, but not expensive against its own history.
The absence of a premium is explainable: the market sees no EBITDA in the report, does not know whether the margin held, and remembers that reserve life is 7.9 years. Until the company proves that higher revenue converts into EBITDA, the multiple is unlikely to move off its historical level.
A 2.6% dividend yield on a 2,800 million flow — the payout is covered, but its size depends on profit
The trailing-twelve-month dividend yield is 2.6%. With third-quarter operating cash flow of 2,800 million and capital expenditure of 1,496 million, free cash flow before dividends is about 1,304 million, and the payout is covered from it. But the exact 2026 dividend does not follow from the disclosed data: the company gives neither the payment amount nor the payout ratio.
Our estimate: with quarterly net profit of 1,000 million and a 2.6% yield, the annual payment looks sustainable if profit does not fall. The risk is that a commodity producer's profit depends on prices, and 7.9 years of reserves require constant reinvestment. If capex rises further, free cash flow for the dividend shrinks.
A 2.6% yield is not high for a commodity producer, but not low either. It is below what one might expect from a company with short reserve life, another argument for a neutral assessment. The dividend is not the main driver of this share's return.
Valuation on the latest reported figures
| Metric | Value |
|---|---|
| Market cap | 47.1 bn USD |
| P/E (LTM) | 13.1 |
| EV/EBITDA (LTM) | 6.8 |
| P/B | 3.03 |
| Net debt / EBITDA (LTM) | 1.00 |
| Operating cash flow (LTM) | 9.66 bn |
| ROE | 26.7% |
| Dividend yield (12m) | 2.6% |
| EV/EBITDA, 3-year average | 7.1 |
Bottom line
The strong side of the report is revenue of 5,900 million (+38.8%) and operating cash flow of 2,800 million, which covers capex of 1,496 million almost twice over. The weak side is the missing EBITDA: there is no way to verify whether the company earned the price, and the net margin rose only from 16.2% to 16.9%. Net debt of 8,109 million at 1.0x trailing-twelve-month EBITDA is moderate, but 7.9 years of reserve life limits the horizon. The share looks neutral: EV/EBITDA of 6.8 sits exactly at the three-year average of 7.1, and the market gives no growth premium. The verdict would change if the next report shows EBITDA at or above the spot model's 2,516.5 million, or if the company announces reserve additions.
Open the company's financial profile DVN →
See also: market overview · valuation map · stock screeners