EXTREME NETWORKS INC: seventh straight quarter of double-digit growth, but most of the profit jump came from a one-off in EBITDA

On 28 October EXTREME NETWORKS INC reported results for the first quarter of fiscal 2027 ended 30 September 2026. Revenue came in at $341.1 million, up 9.9% year on year, adjusted EBITDA at $65.6 million, net income at $16.0 million, and operating cash flow at $45.4 million. The EBITDA margin rose to 19.2% from 5.0% a year earlier, but that jump is largely explained by one-off items in both the base and the current quarter rather than a durable improvement in operating economics. At an LTM EV/EBITDA of 25.1 against its own three-year average of 40.6 the share looks cheaper than its history, and the portal's model puts upside to fair value at +60%, so the stock merits a 'rather attractive' rating.
Key takeaways
— Revenue grew 9.9% year on year, and the pace was roughly unchanged from the prior quarter
— The jump in EBITDA margin to 19.2% is half built from one-off items rather than operating leverage
— Product revenue rose 12.5% while subscription and support grew only 5.7%, shifting the revenue mix
— Operating cash flow of $45.4 million against $6.8 million of capex produced $38.6 million of free cash flow
— Net debt is negative, and LTM leverage stands at -0.13 EBITDA
— LTM EV/EBITDA of 25.1 is 38% below its own three-year average of 40.6
— The company repurchased $25.0 million of stock at an average price of $29.62 per share
Attractiveness
Key figures, USD bn
| Metric | Q3 2025 | Q3 2026 | Change |
|---|---|---|---|
| Revenue | 0.31 | 0.34 | +9.9% |
| EBITDA | 0.02 | 0.07 | +320.7% |
| Operating profit | 0.01 | 0.02 | +104.5% |
| Net profit | 0.01 | 0.02 | +185.2% |
| Operating cash flow | -0.01 | 0.05 | to profit |
| Capex | 0.01 | — | — |
| EBITDA margin | 5.0% | 19.2% | +14.2 pp |
| Net margin | 1.8% | 4.7% | +2.9 pp |
Revenue grew 9.9% year on year, and the pace was roughly unchanged from the prior quarter
Revenue for the first quarter of fiscal 2027 was $341.1 million against $310.2 million a year earlier, up 9.9%. This is the seventh consecutive quarter of double-digit growth on the company's own definition, and management explicitly frames it as a streak rather than a one-off spike.
The pace was roughly unchanged from the prior quarter: growth was 10.3% in the fourth quarter of fiscal 2026 and 9.9% now. There is no deceleration here, but no acceleration either – the company has been holding the same speed for several quarters.
The year-on-year comparison for the quarter ended September 2026 gives +9.9% against the same quarter last year. For a company with $341.1 million of revenue that is roughly $31 million of absolute addition, and it came entirely from the product side.
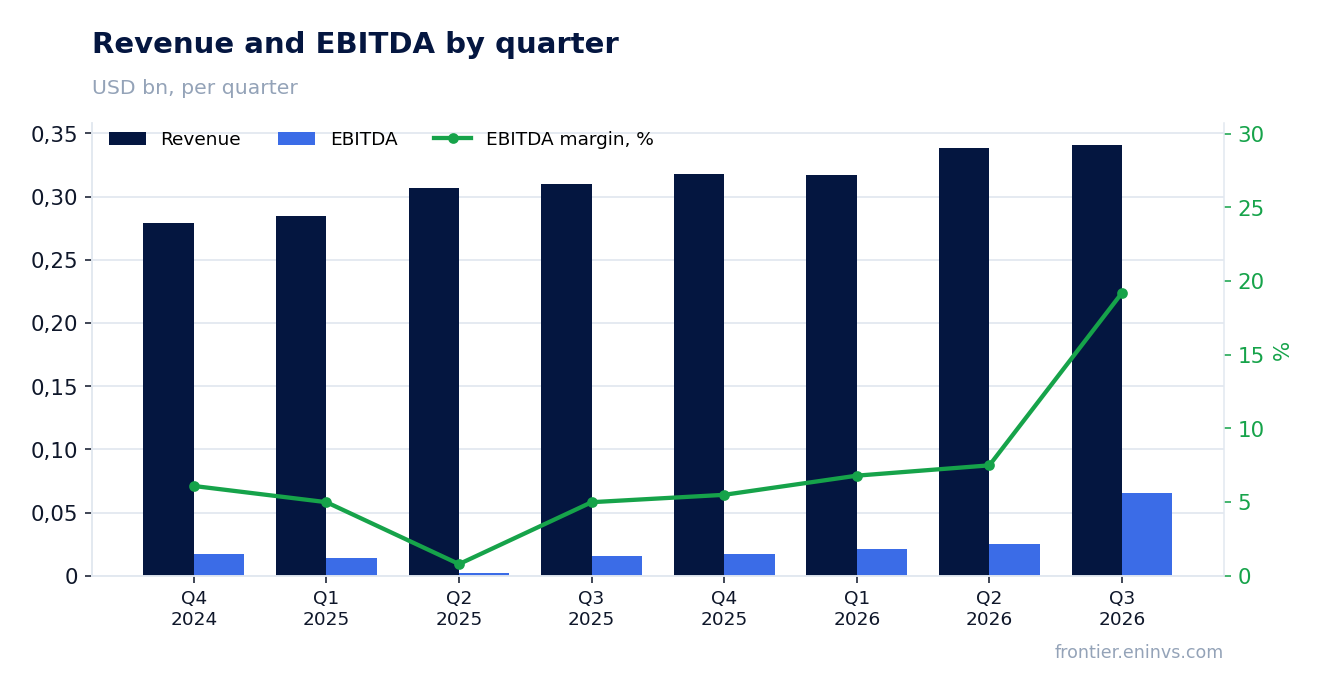
The jump in EBITDA margin to 19.2% is half built from one-off items rather than operating leverage
Adjusted EBITDA rose to $65.6 million from $44.7 million a year earlier, with the margin up to 19.2% from 5.0%. At first glance this confirms operating leverage, but the structure of the metric says otherwise.
The current-quarter EBITDA calculation contains one-off items: restructuring of $7.4 million, litigation charges of $1.0 million, system transition costs of $2.4 million, other non-recurring costs of $3.7 million and a $2.1 million write-off of debt issuance costs. A year earlier the comparable set was noticeably smaller – $371 thousand of restructuring, $1.9 million of litigation and $4.9 million of system transition costs.
In other words, part of the EBITDA increase is not a business improvement but a difference in the size of one-off items between the two quarters. GAAP operating income rose to $23.1 million from $11.3 million, and that figure does reflect a real improvement, albeit adjusted for the same one-off items.
GAAP gross margin rose to 62.1% from 60.6%, and that is a cleaner signal: product margin improved through pricing and sales mix rather than through one-off write-offs.
Product revenue rose 12.5% while subscription and support grew only 5.7%, shifting the revenue mix
Product revenue was $218.3 million against $194.0 million a year earlier, up 12.5%. Subscription and support delivered $122.8 million against $116.2 million, up only 5.7%.
The gap in growth rates shifts the mix: product now accounts for roughly two thirds of revenue, and its contribution to overall growth has become decisive. The subscription part, usually considered more durable, is growing more slowly, and that is worth keeping in mind when assessing revenue quality.
At the same time SaaS ARR grew 22% year on year to $264.7 million, and management links this to adoption of Extreme Platform ONE. So the slow growth of subscription revenue is not weak demand for software but a difference between revenue recognition and annual contract value.
For an investor this means current growth rests on hardware and deployments rather than recurring subscription. If the product cycle slows, the subscription part will not be able to offset the shortfall quickly.
Operating cash flow of $45.4 million against $6.8 million of capex produced $38.6 million of free cash flow
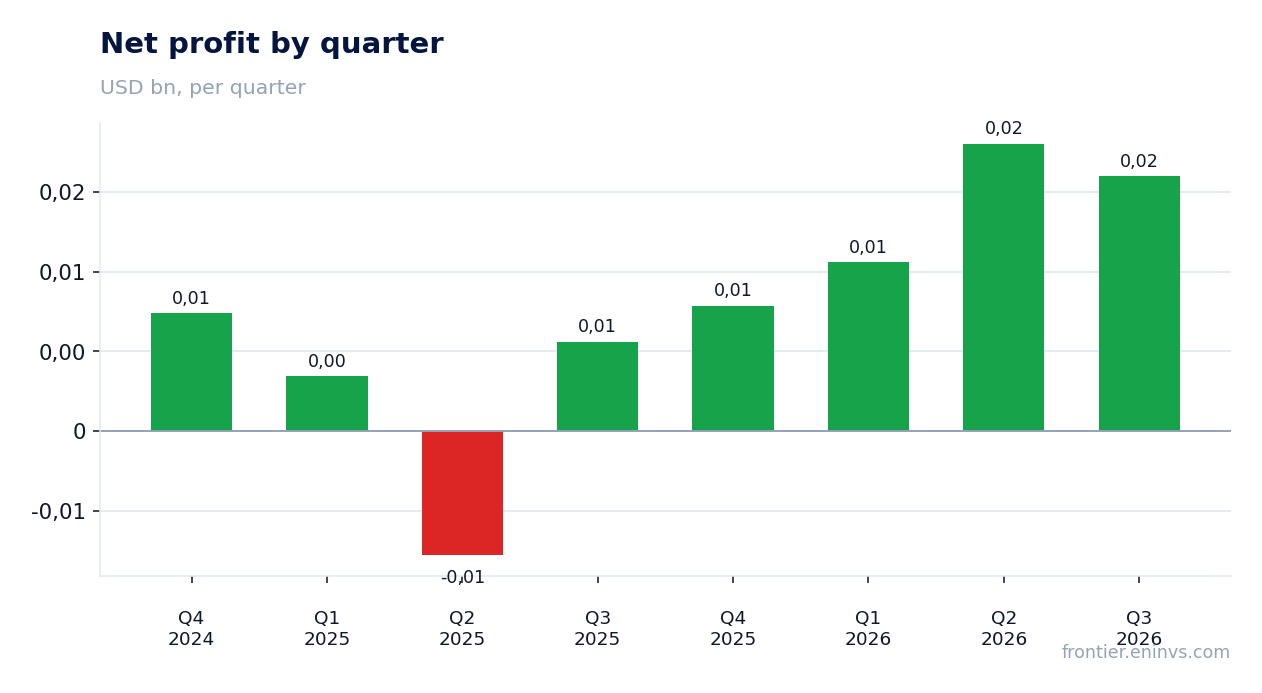
Operating cash flow for the quarter was $45.4 million against an outflow of $14.0 million a year earlier. Free cash flow after $6.8 million of capex was $38.6 million against an outflow of $20.9 million a year earlier.
The swing is largely explained by working capital: inventories rose by $30.8 million and prepaid expenses by $59.5 million during the quarter, but accounts payable rose by $22.8 million and other liabilities by $73.1 million at the same time. This looks more like a shift in payment timing than a durable improvement in profit-to-cash conversion.
Cash on the balance sheet rose to $244.5 million from $211.8 million at the end of June 2026. The company also repurchased $25.0 million of stock and spent $12.1 million on tax withholding on employee share issuance.
Free cash flow of $38.6 million for the quarter is a good result, but it is noticeably above net income of $16.0 million, and the gap is mostly created by working capital. In the next quarter that source may dry up or reverse.
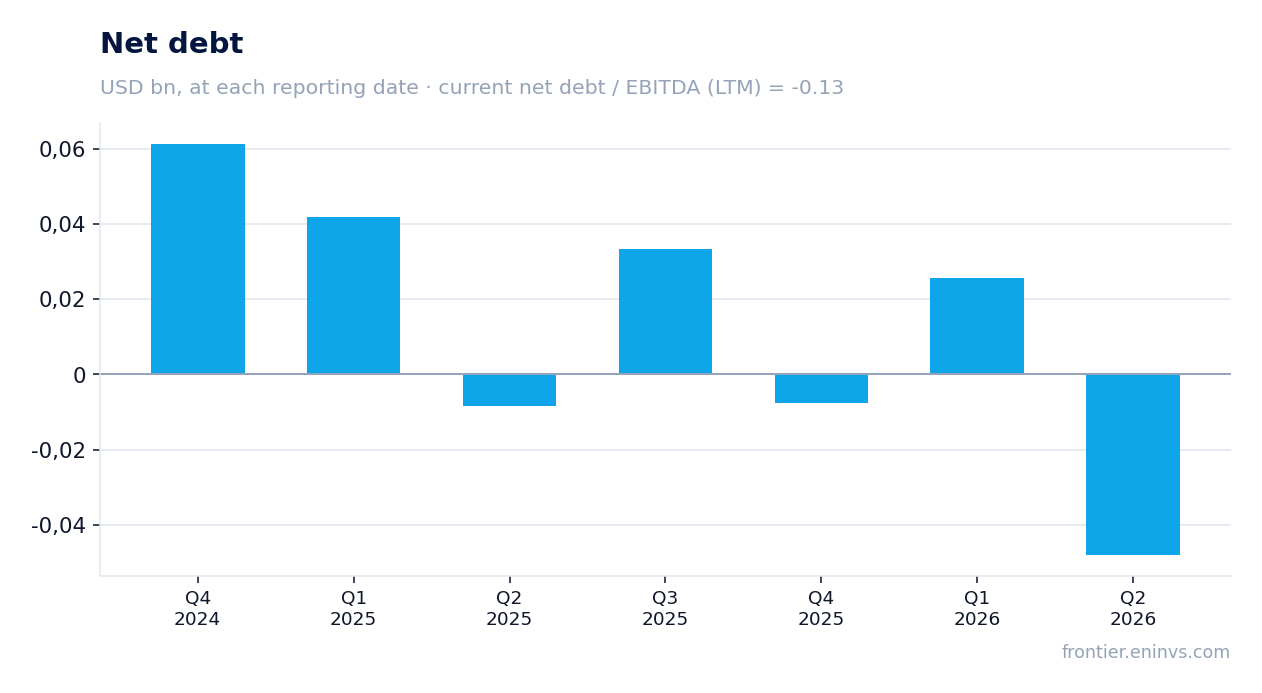
Net debt is negative, and LTM leverage stands at -0.13 EBITDA
At the latest annual reporting date the company's net debt was negative at -$17.2 million, meaning cash exceeded debt obligations. The ratio of net debt to LTM EBITDA is -0.13, and that is a level, not a direction: comparing it with past values is not possible on the available data.
As of 30 September 2026 cash was $244.5 million, gross debt $200.0 million, and net cash $44.5 million. During the quarter the company drew $200.0 million under its revolving facility and repaid $165.0 million of debt obligations, effectively refinancing its debt.
Interest expense rose to $5.2 million from $3.7 million a year earlier, which looks counterintuitive with negative net debt but is explained by the debt structure and the cost of the revolving facility. Interest income stayed at $1.2 million.
Negative net debt and sub-zero leverage give the company a margin of safety: even with an EBITDA decline it will not face pressure from creditors. That is an important argument for the stock, although by itself it does not create value.
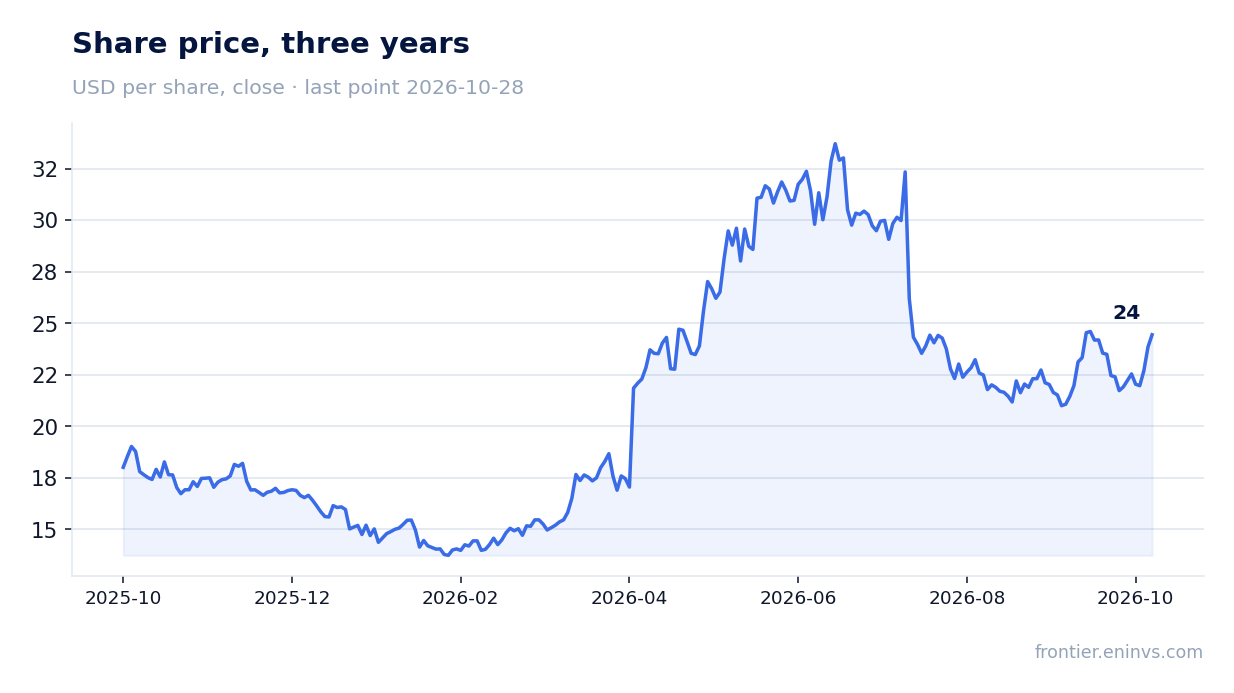
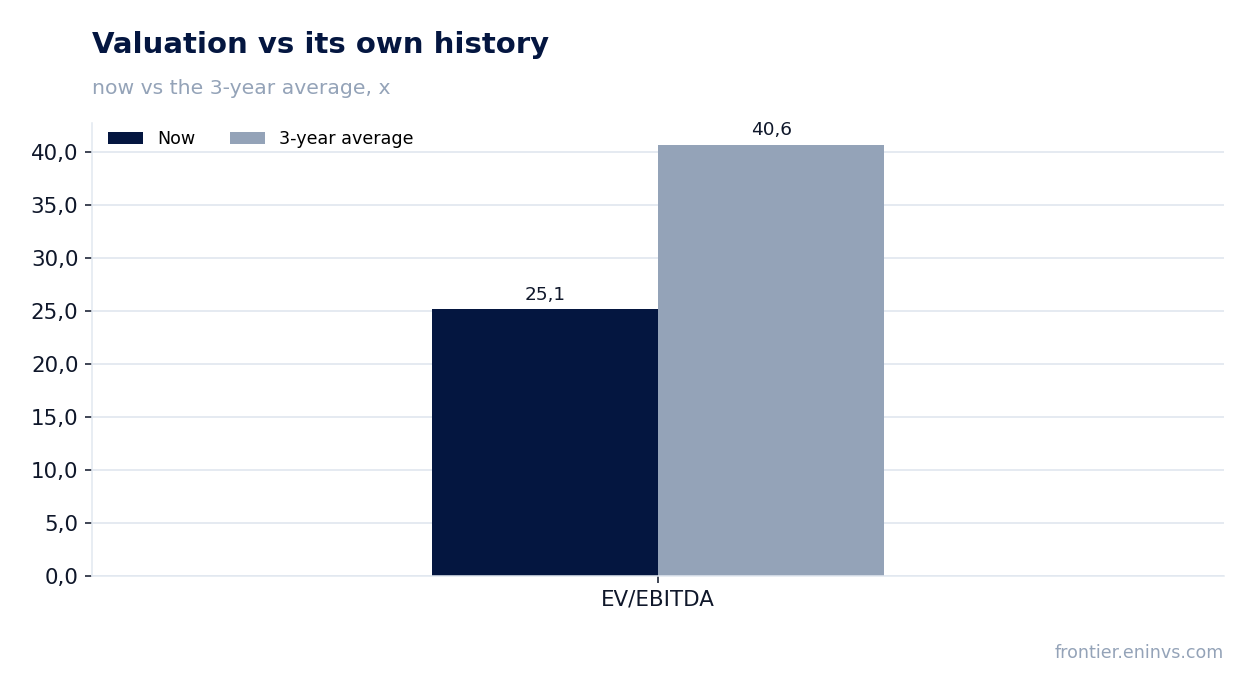
LTM EV/EBITDA of 25.1 is 38% below its own three-year average of 40.6
The LTM EV/EBITDA multiple is 25.1 against its own three-year average of 40.6. That is 38% below the historical level, meaning the stock is cheaper on this measure than it was on average over three years.
The LTM P/E is 61.8, reflecting low net income relative to market capitalisation. Return on equity is 72.5%, but it is calculated on a very small equity base of $88.0 million and should not be treated as sustainable.
On the portal's model, which compares EBITDA growth with a target multiple and market capitalisation, the upside of the share to fair value is estimated at +60%. This is our own estimate, not a market consensus and not a target price.
Market capitalisation is $3,244.5 million. At that capitalisation and LTM EBITDA of $128.5 million the multiple looks high in absolute terms but below its own history. The question is whether the EBITDA growth on which the model is built will hold.
The company repurchased $25.0 million of stock at an average price of $29.62 per share
During the quarter the company repurchased 844,131 shares for $25.0 million at an average price of $29.62 per share. That is above the closing price of $23.85 before the release, meaning the buyback was executed at prices above current levels.
The buyback was funded from free cash flow and cash balances, and it did not undermine liquidity: cash rose by $32.7 million during the quarter. With negative net debt such a policy looks balanced.
The company pays no dividends, so the buyback is the only channel for returning capital to shareholders. At a price of $23.85 and LTM net income of $52.5 million the buyback yield is about 0.8% of market capitalisation per quarter, but the sustainability of this channel depends on free cash flow.
If free cash flow is lower next quarter because of a working capital reversal, the buyback programme may slow. That is worth watching as an indicator of management confidence.
Valuation on the latest reported figures
| Metric | Value |
|---|---|
| Market cap | 3.24 bn USD |
| P/E (LTM) | 61.8 |
| EV/EBITDA (LTM) | 25.1 |
| P/B | 36.62 |
| Net debt / EBITDA (LTM) | -0.13 |
| Operating cash flow (LTM) | 0.18 bn |
| ROE | 72.5% |
| EV/EBITDA, 3-year average | 40.6 |
Bottom line
The strong side of the quarter remains revenue: $341.1 million and 9.9% growth for the seventh consecutive quarter, with the pace roughly unchanged from the prior quarter. The weak spot is earnings quality: the jump in EBITDA to $65.6 million and the margin to 19.2% is half built from one-off items, and free cash flow of $38.6 million leans on working capital. Negative net debt and leverage of -0.13 EBITDA provide a margin of safety, and an EV/EBITDA of 25.1 against a three-year average of 40.6 says the stock is cheaper than its history. The portal's model puts upside to fair value at +60%, and that outweighs the questions about earnings quality. The verdict is 'rather attractive': the main risk to the valuation is that sustainable EBITDA turns out lower than reported.
Open the company's financial profile EXTR →
See also: market overview · valuation map · stock screeners