Diamondback Energy, Inc.: revenue up 38.4% but growth decelerated from Q2, and the multiple sits above its own history

Diamondback Energy, Inc. reported results for the third quarter of 2026. Revenue came in at USD 5,431.0 million, up 38.4% year on year, EBITDA at USD 3,752.0 million (+48.8%), and net profit at USD 1,603.0 million (+57.5%). Growth is strong, but the pace decelerated from the second quarter (+51.2%), and EV/EBITDA of 8.8 is above its own three-year average of 8.3, so at the current price the share looks rather unattractive.
Key takeaways
— Revenue grew 38.4% year on year, but that is slower than the +51.2% seen in the second quarter
— EBITDA rose 48.8%, and its margin climbed to 69.1% from 64.3% a year earlier
— Net profit grew 57.5%, with the margin reaching 29.5% versus 25.9% a year earlier
— Operating cash flow for the quarter was USD 2,599.0 million, with capex of USD 438.0 million in the second quarter
— Net debt of USD 14,166.0 million equals 1.79x trailing-twelve-month EBITDA
— Trailing-twelve-month dividend yield is 2.13%, modest against the key rate
— EV/EBITDA of 8.8 is above its own three-year average of 8.3, and the portal model implies 72% downside
Attractiveness
Key figures, USD bn
| Metric | Q3 2025 | Q3 2026 | Change |
|---|---|---|---|
| Revenue | 3.92 | 5.43 | +38.4% |
| EBITDA | 2.52 | 3.75 | +48.8% |
| Operating profit | 1.24 | 2.50 | +102.3% |
| Net profit | 1.02 | 1.60 | +57.5% |
| Operating cash flow | 2.38 | 2.60 | +9.1% |
| Capex | 0.77 | — | — |
| EBITDA margin | 64.3% | 69.1% | +4.8 pp |
| Net margin | 25.9% | 29.5% | +3.6 pp |
Revenue grew 38.4% year on year, but that is slower than the +51.2% seen in the second quarter
Revenue for the third quarter of 2026 was USD 5,431.0 million, up 38.4% from a year earlier. That is a strong result, but it is slower than the 51.2% growth in the second quarter. The deceleration is the main signal from the report: the company is still growing fast, but no longer as fast as a quarter earlier.
The revenue increase rests on high hydrocarbon prices and higher production volumes after asset consolidation deals. The report does not provide an exact breakdown by factor, so we limit ourselves to stating that both pricing and the production base worked in favour. For further growth, price stability matters more than one-off effects.
Over the trailing twelve months, revenue was USD 18,600.0 million. This level covers four quarters and should not be mixed with the quarterly growth rate: the annual base is broader and smooths fluctuations between quarters.
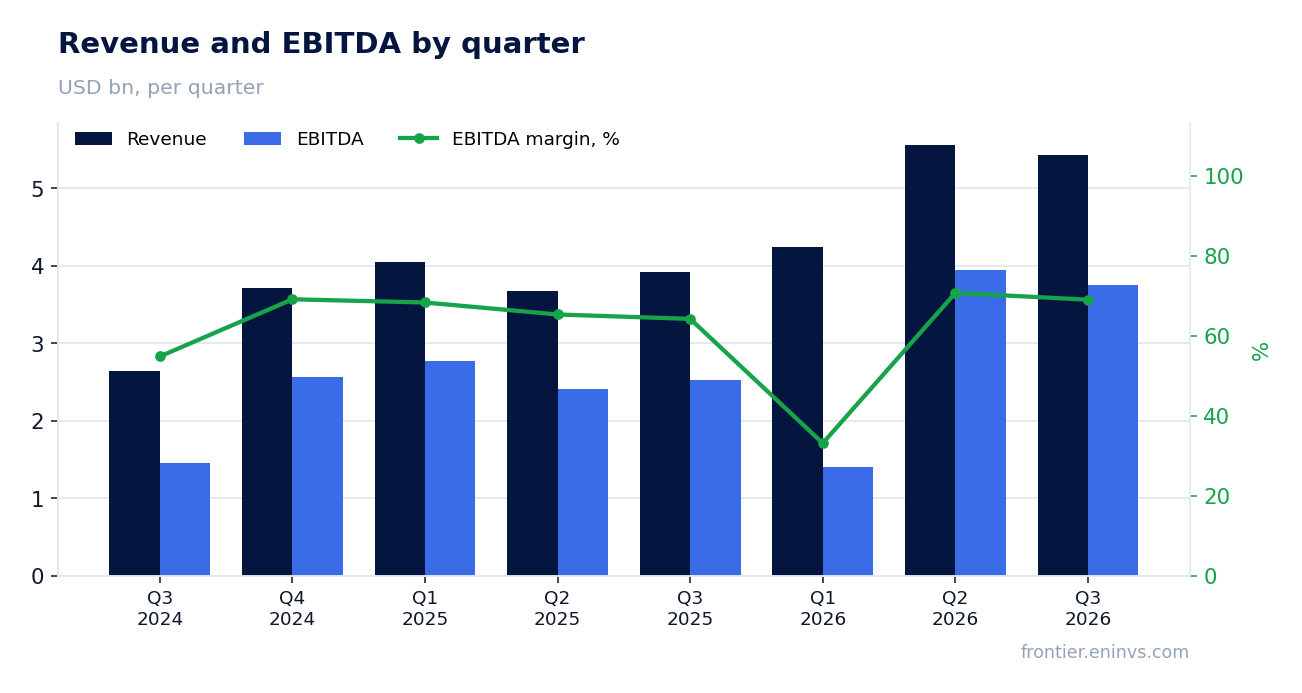
EBITDA rose 48.8%, and its margin climbed to 69.1% from 64.3% a year earlier
EBITDA for the third quarter of 2026 reached USD 3,752.0 million, up 48.8% year on year. The EBITDA margin was 69.1% versus 64.3% a year earlier. Such a margin level is typical for an upstream company in a period of high prices: operating costs grow more slowly than revenue.
Operating profit was USD 2,500.0 million, confirming the high efficiency of the core business. The gap between EBITDA and operating profit is depreciation, which remains significant for capital-intensive production. The 4.8 percentage point margin increase shows the company is managing costs well as revenue grows.
Over the trailing twelve months, EBITDA was USD 7,932.1 million. This figure is used to calculate leverage and multiples, and it is this, rather than the quarterly level, that serves as the basis for assessing business resilience.
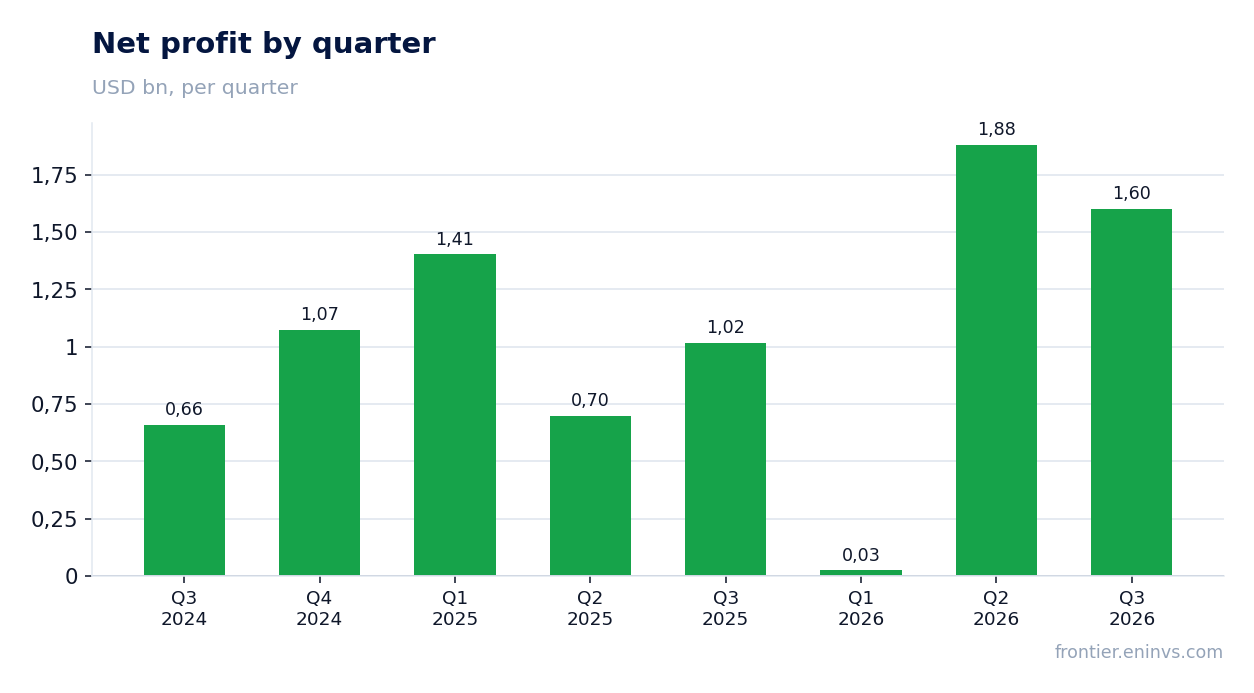
Net profit grew 57.5%, with the margin reaching 29.5% versus 25.9% a year earlier
Net profit for the third quarter of 2026 was USD 1,603.0 million, up 57.5% from a year earlier. Profit growth outpaced revenue growth thanks to margin expansion. The net margin reached 29.5% versus 25.9% a year earlier – the best reading among the last four quarters.
The faster growth of profit relative to revenue is explained by operating leverage: at a high EBITDA margin, each additional dollar of revenue produces a disproportionately large increase in profit. The report does not highlight any one-off factors that would distort the picture, so profit reflects current operating efficiency.
Over the trailing twelve months, net profit was USD 2,052.0 million. This level is below the quarterly profit multiplied by four because of a weak first quarter of 2026, when profit was minimal. The annual base matters for assessing dividend coverage and the P/E multiple.
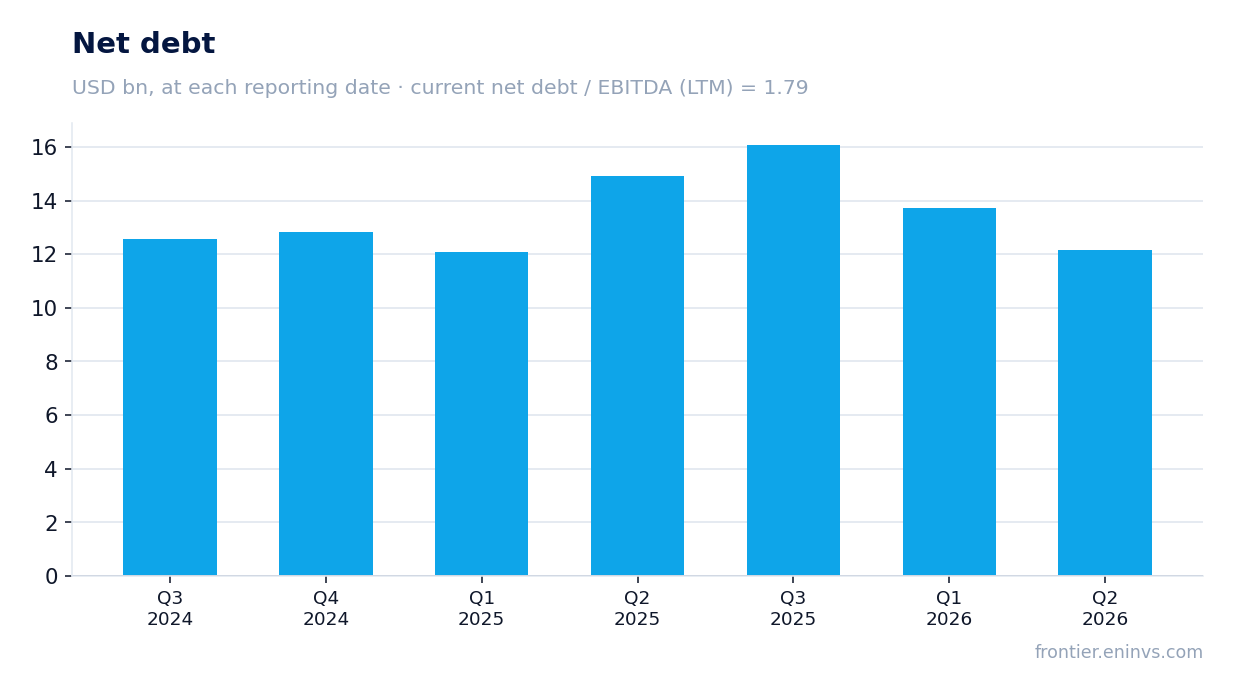
Operating cash flow for the quarter was USD 2,599.0 million, with capex of USD 438.0 million in the second quarter
Operating cash flow for the third quarter of 2026 was USD 2,599.0 million. That is below the second-quarter level (USD 3,589.0 million) but above the year-earlier figure (USD 2,383.0 million). Cash flow remains solid and covers capital expenditure with a large margin.
Capital expenditure in the second quarter of 2026 was USD 438.0 million – the lowest quarterly level in the last two years. The facts do not include third-quarter capex, so we limit ourselves to stating that at this investment level free cash flow remains high, supporting dividend payments.
Over the trailing twelve months, operating cash flow was USD 10,359.0 million. This is a stable base for financing capital investment and shareholder payouts. The reduction in capex in the second quarter may be linked to the completion of the active integration phase of acquired assets, but the exact reason is not disclosed in the report.
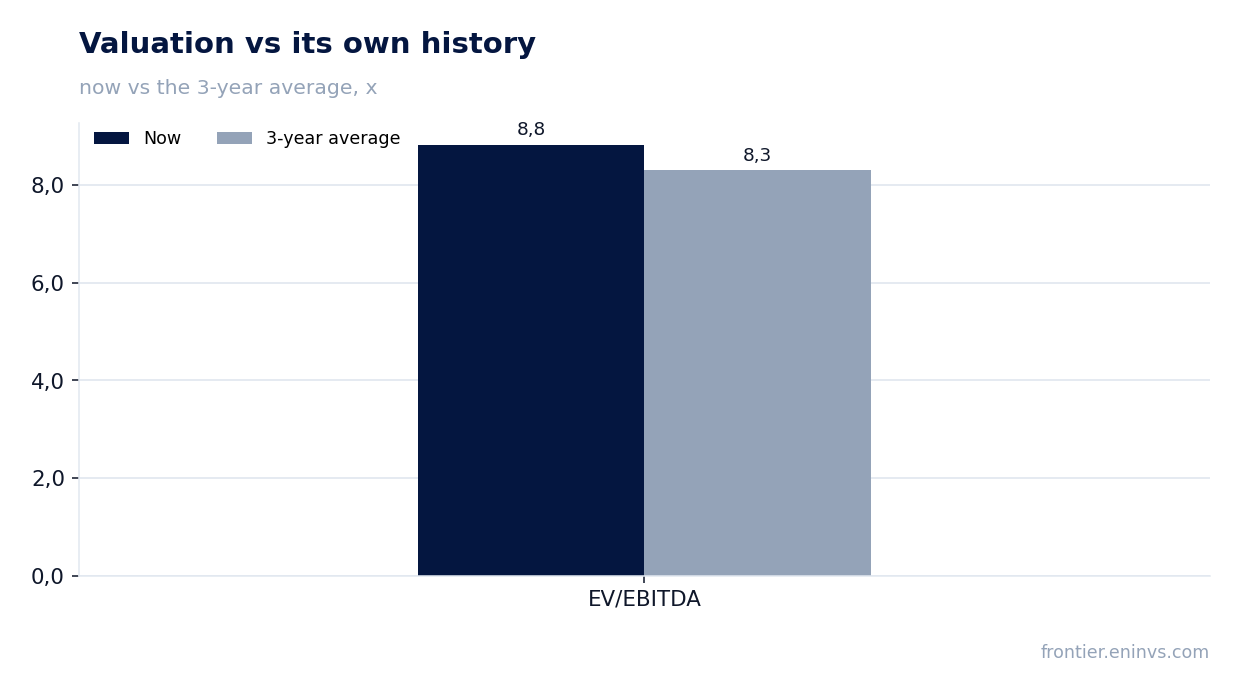
Net debt of USD 14,166.0 million equals 1.79x trailing-twelve-month EBITDA
Net debt at the latest balance-sheet date was USD 14,166.0 million. The ratio of net debt to trailing-twelve-month EBITDA is 1.79. This is a moderate level for an upstream company: debt is covered by EBITDA in less than two years.
The quarterly dynamics of net debt were uneven: from USD 12,553.0 million in the third quarter of 2024 it rose to USD 16,083.0 million in the third quarter of 2025, then declined to USD 12,152.0 million in the second quarter of 2026. The decline in the second quarter was driven by high operating cash flow (USD 3,589.0 million) and low capex (USD 438.0 million).
Interest expenses are not separately disclosed in the report, but at this debt level and current rates they remain a notable item. The 1.79 ratio is a level, not a direction: it cannot be compared with earlier values because earlier data are absent from the facts.
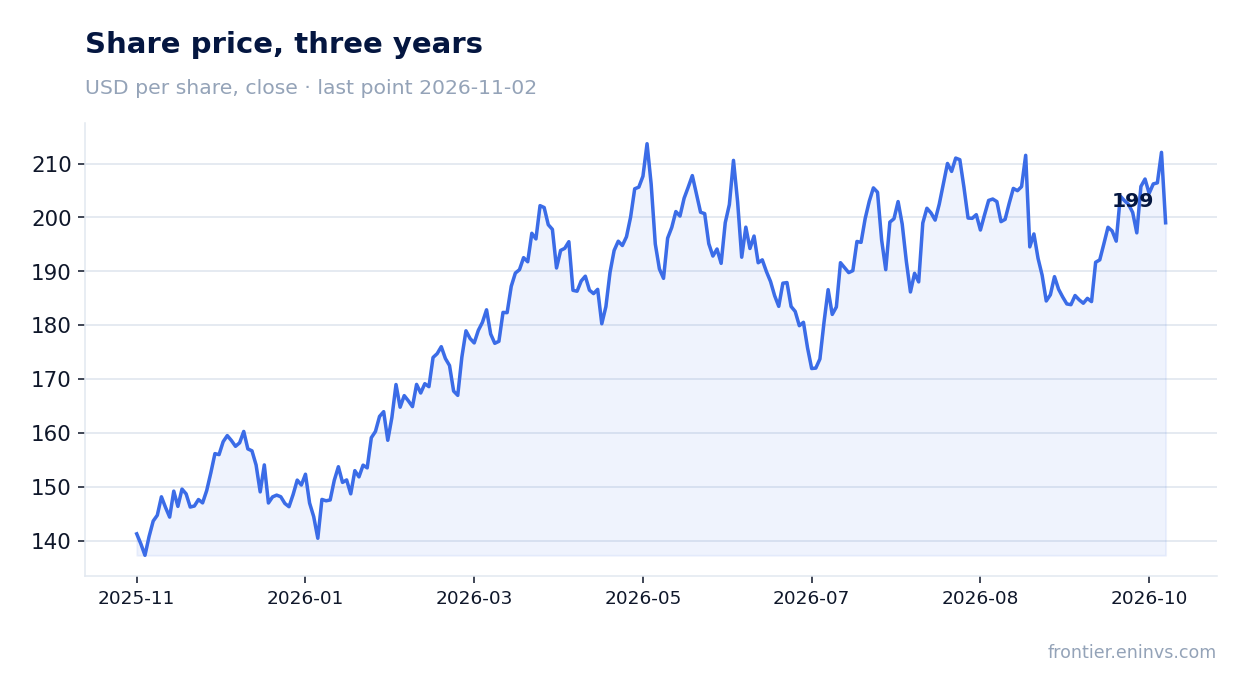
Trailing-twelve-month dividend yield is 2.13%, modest against the key rate
The trailing-twelve-month dividend yield is 2.13%. This is a modest level for a market where the risk-free rate is higher. The company pays dividends, but their size relative to the share price is small.
Our estimate of the current-year dividend rests on trailing-twelve-month profit (USD 2,052.0 million) and the payout ratio, which the company does not disclose in the facts. If the current policy is maintained and oil prices are stable, payouts will remain close to last year's level. The key risk to the dividend is a fall in hydrocarbon prices, which directly reduces both profit and cash flow.
A yield of 2.13% does not compensate for the risks associated with the industry's cyclicality. For a dividend-oriented investor, this share is less attractive than instruments with a fixed yield.
EV/EBITDA of 8.8 is above its own three-year average of 8.3, and the portal model implies 72% downside
The trailing-twelve-month EV/EBITDA multiple is 8.8, which is 6% above its own three-year average of 8.3. The share trades more expensively than usual relative to its own history. This limits upside at current hydrocarbon prices.
The trailing-twelve-month P/E multiple is 27.2, which also points to a high valuation relative to earnings. Return on equity (ROE) is 16.7% – a decent figure, but it does not justify a premium to the historical multiple.
On the portal's model, which re-prices EBITDA at current commodity prices at the target EV/EBITDA, the fair value of the share implies 72% downside to the current market price. This is our own estimate, not a market consensus. It reflects the risk of falling oil prices and multiple compression.
Valuation on the latest reported figures
| Metric | Value |
|---|---|
| Market cap | 55.8 bn USD |
| P/E (LTM) | 27.2 |
| EV/EBITDA (LTM) | 8.8 |
| P/B | 1.51 |
| Net debt / EBITDA (LTM) | 1.79 |
| Operating cash flow (LTM) | 10.4 bn |
| ROE | 16.7% |
| Dividend yield (12m) | 2.1% |
| EV/EBITDA, 3-year average | 8.3 |
Bottom line
The report's strengths are revenue growth of 38.4%, EBITDA margin expansion to 69.1%, and net profit growth of 57.5%. However, growth decelerated from the second quarter, and the EV/EBITDA multiple of 8.8 is above its own three-year average of 8.3. Leverage of 1.79x EBITDA is moderate, but the dividend yield of 2.13% is modest. The portal model implies 72% downside, making the share rather unattractive at the current price. Verdict – rather unattractive.
Open the company's financial profile FANG →
See also: market overview · valuation map · stock screeners