FLEX LTD.: revenue accelerated to +24.8%, but a $110m one-off ate almost all of the profit gain

On 28 October FLEX LTD. reported results for the second quarter of fiscal 2027 (ended 25 September 2026). Revenue reached $8,491m, up 24.8% year on year, net profit was $263m (+32.2%) and operating cash flow $501m. Growth accelerated versus the first quarter, but the quarter's profit carries $110m of one-off legal and transaction costs, and an EV/EBITDA of 19.2 against the company's own three-year average of 10.3 leaves little room – at the current price the share looks rather unattractive.
Key takeaways
— Revenue added 24.8% year on year, an acceleration from 20.6% a quarter earlier
— A $110m one-off legal and transaction charge ate almost all of the profit gain
— Adjusted operating margin of 7.1% versus 4.9% on GAAP – the gap is entirely one-off items
— Operating cash flow of $501m, but free cash flow only $261m after capex and separation costs
— Debt rose to $5,213m, while net debt to LTM EBITDA stands at 1.1 with no direction implied
— EV/EBITDA of 19.2 against the company's own three-year average of 10.3 – the share is 86% above its history
— Full-year guidance raised to $34.9–35.9bn, but it does not reflect the planned Cloud and Power Infrastructure spin-off
Attractiveness
Key figures, USD bn
| Metric | Q3 2025 | Q3 2026 | Change |
|---|---|---|---|
| Revenue | 6.80 | 8.49 | +24.8% |
| EBITDA | 0.45 | — | — |
| Operating profit | 0.30 | 0.41 | +39.9% |
| Net profit | 0.20 | 0.26 | +32.2% |
| Operating cash flow | 0.85 | 0.50 | -41.2% |
| Capex | 0.28 | — | — |
| EBITDA margin | 6.6% | — | — |
| Net margin | 2.9% | 3.1% | +0.2 pp |
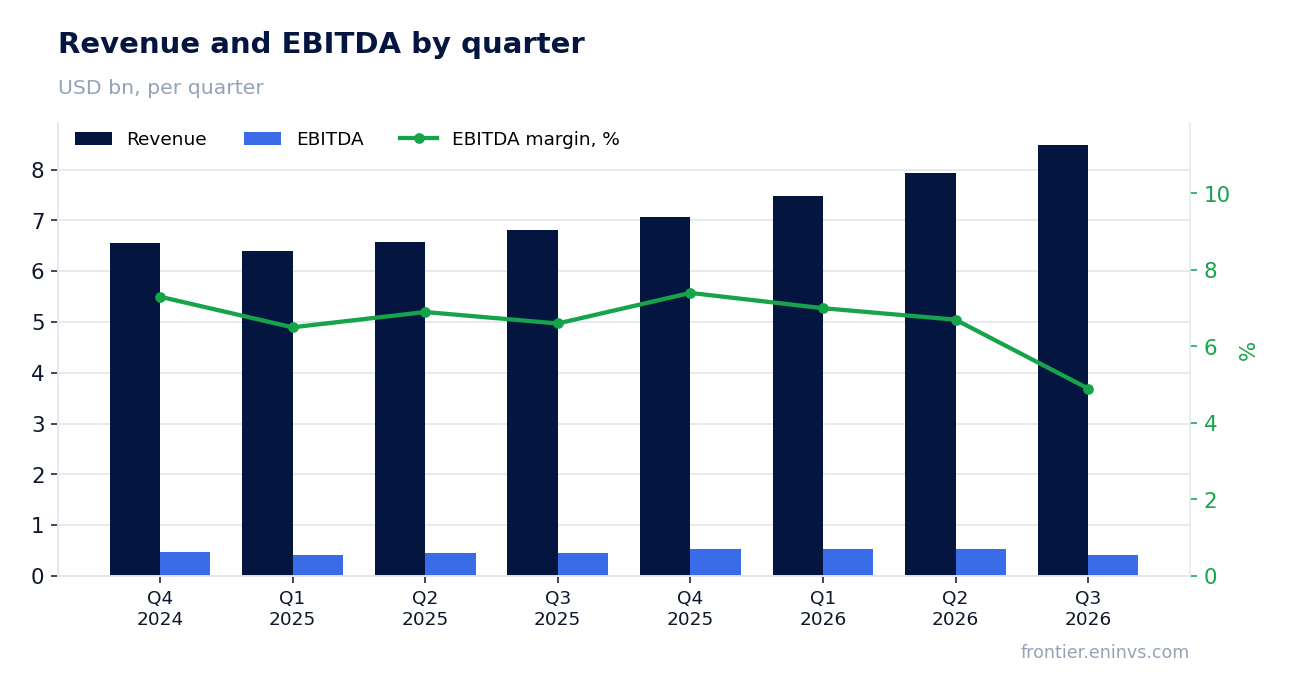
Revenue added 24.8% year on year, an acceleration from 20.6% a quarter earlier
In the second quarter of fiscal 2027 revenue was $8,491m against $6,804m a year earlier, growth of 24.8%. A quarter earlier, in the first quarter, growth was 20.6%, so the dynamic accelerated. The press release ties this to faster data-centre deployment: Flex supplies power and cooling systems for AI infrastructure.
The quarterly sequence shows a steady climb: $7,477m in the first quarter, $7,928m in the second and $8,491m in the reported one. Year on year the rate built from 4.1% in the first quarter of 2025 to double digits in 2026. That profile suggests demand is stretched out rather than one-off.
The base matters: a year earlier revenue was $6,804m, and the entire $1,687m increase came from new programmes. The company does not break out segments in the release text, so the contribution of Cloud and Power Infrastructure to overall growth is not visible from the document.
A $110m one-off legal and transaction charge ate almost all of the profit gain
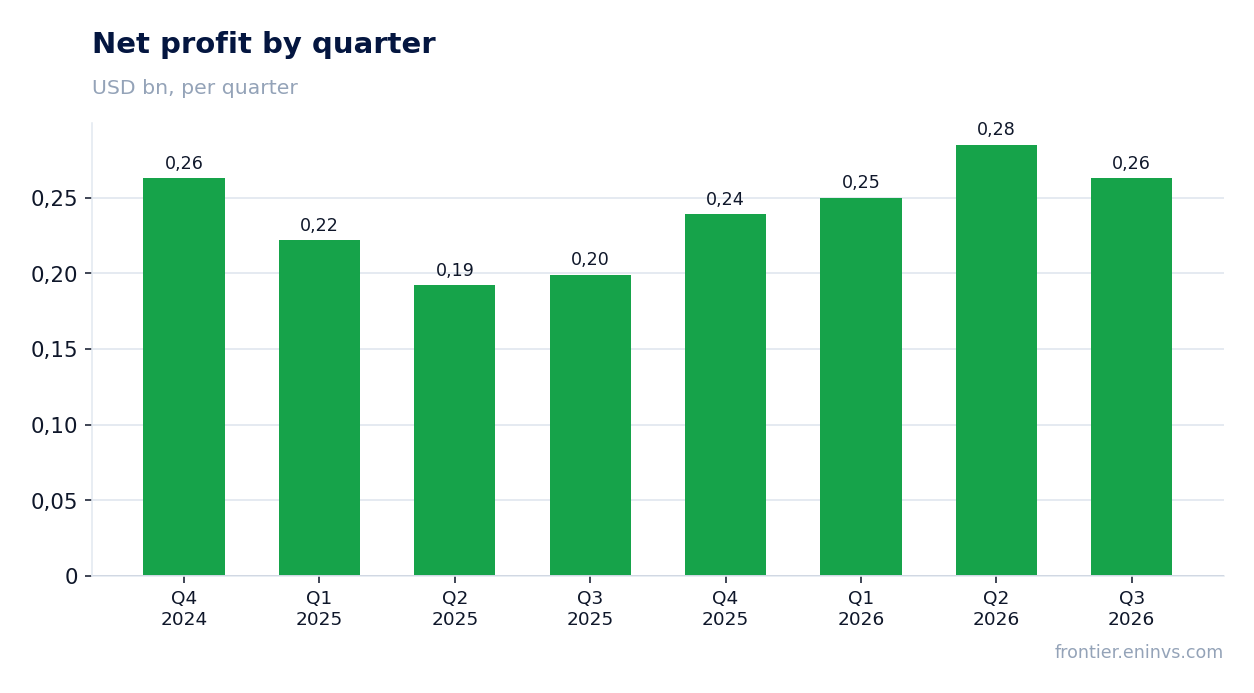
Net profit for the reported quarter was $263m against $199m a year earlier, growth of 32.2%. Yet the income statement carries a 'Legal and other' line of $110m, of which $91m relates to the planned spin-off of the Cloud and Power Infrastructure segment and $19m to acquisition costs. A year earlier that line was only $9m.
Excluding these costs, adjusted operating income would have been $607m at a 7.1% margin versus 4.9% on GAAP. The $193m gap is mostly the same legal and transaction items plus intangible amortisation and stock-based compensation. In other words, the operating efficiency of the business is higher than the official accounts show.
For a holder this means current profit is depressed by one-off costs, but those costs stem from the strategic decision to split the company. Until the deal closes, such charges will recur and GAAP profit will stay under pressure.
Adjusted operating margin of 7.1% versus 4.9% on GAAP – the gap is entirely one-off items
GAAP operating income for the quarter was $414m, a 4.9% margin. Adjusted operating income was $607m, a 7.1% margin. The $193m difference consists of legal and other costs ($110m), stock-based compensation ($43m), intangible amortisation ($27m) and restructuring ($13m).
A year earlier adjusted margin was 6.0%, so the company improved the metric by 1.1 percentage points. The improvement came on the back of revenue growth: operating costs are rising slower than sales. In absolute terms adjusted operating income rose from $409m to $607m.
However, the margin improvement is partly a scale effect rather than lower unit costs. If revenue growth slows, margin pressure will return. Moreover, one-off separation costs will accompany the company for several more quarters, and the gap between GAAP and adjusted profit will persist.
Operating cash flow of $501m, but free cash flow only $261m after capex and separation costs
Operating cash flow for the reported quarter was $501m against $453m a year earlier. Capital expenditure was $241m, above last year's $150m. Free cash flow came to $261m against $305m a year earlier, so it fell despite revenue growth.
Two things weighed on free cash flow: higher capex and $61m of separation costs that the company names explicitly. Without them free cash flow would have been closer to last year's level. The capex increase is tied to capacity expansion for new programmes, including in power.
For the first half operating cash flow was $777m and free cash flow $302m. For a company with a market capitalisation of $34.0bn this is modest conversion: half-year free cash flow covers only a small part of the market value. That limits room for buybacks and debt reduction.
Debt rose to $5,213m, while net debt to LTM EBITDA stands at 1.1 with no direction implied
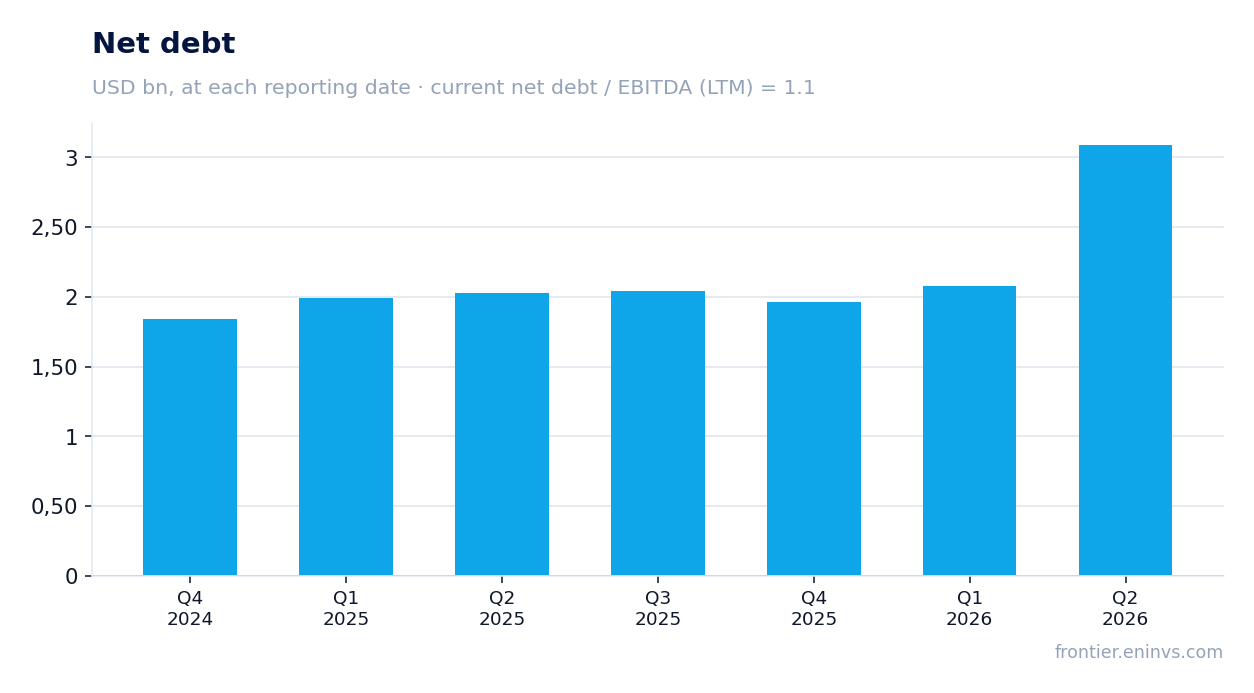
Long-term debt at quarter-end was $5,213m against $3,751m at the end of March 2026. The increase is tied to acquisitions: over the half-year the company spent $1,134m on business purchases, including EPC Power. Net debt on the latest annual balance sheet was $2,076m, and net debt to LTM EBITDA is 1.1.
Interest costs are rising: for the quarter interest expense was $69m against $52m a year earlier. Interest income was $13m. Net interest expense of $56m eats a noticeable part of operating income, especially with rates still high.
A debt level of 1.1 LTM EBITDA looks comfortable, but the company does not disclose the ratio's direction. It cannot be said that leverage rose or fell: the facts contain only the current value. For risk assessment it matters that debt is dollar-denominated while revenue is diversified globally.
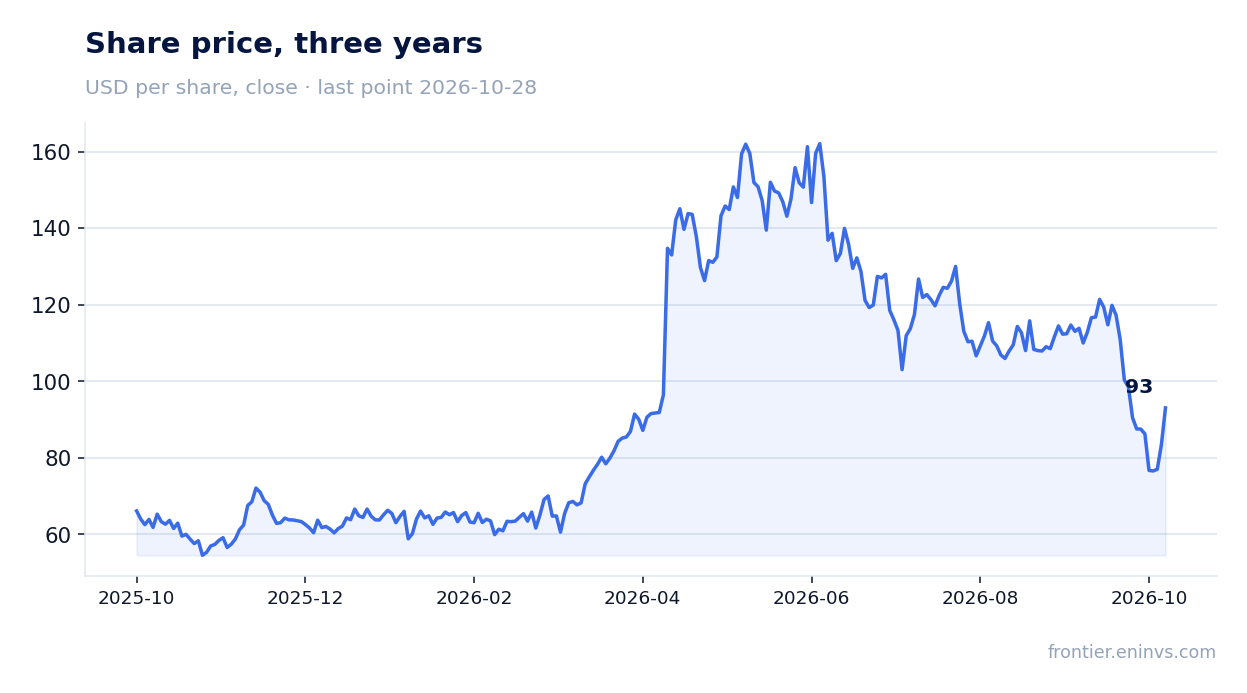
EV/EBITDA of 19.2 against the company's own three-year average of 10.3 – the share is 86% above its history
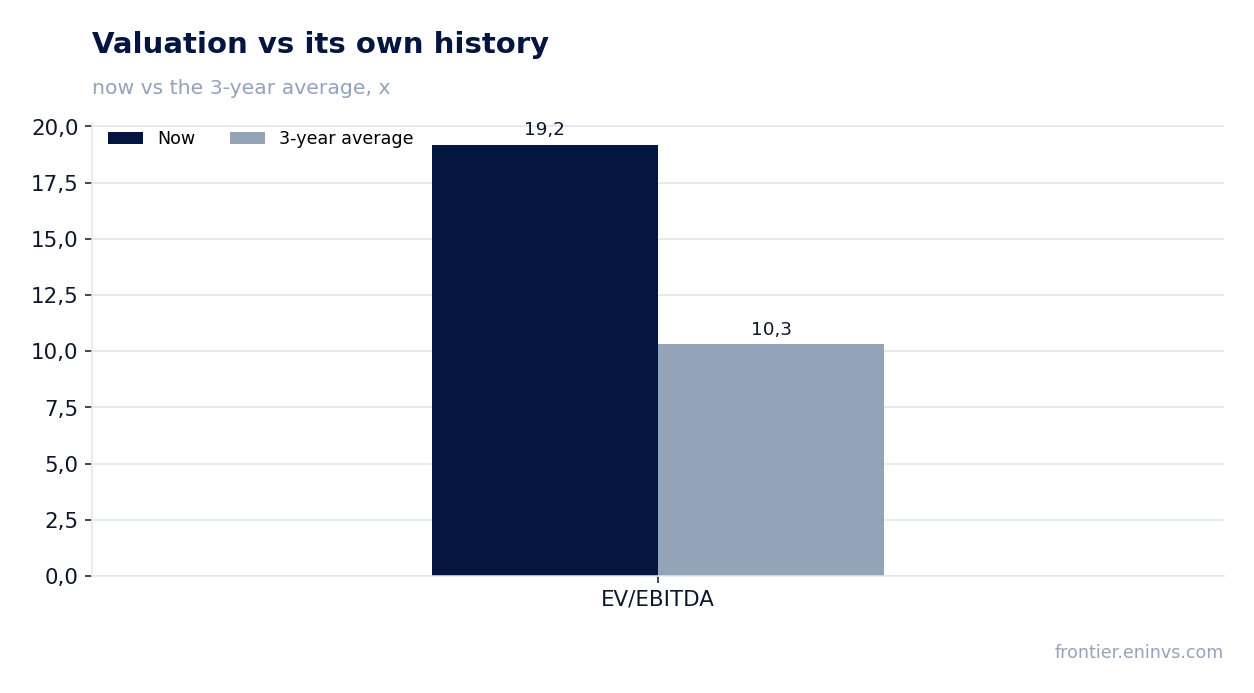
The LTM EV/EBITDA multiple is 19.2, while its own three-year average is 10.3. The share trades 86% above its history on this metric. LTM P/E is 32.8, which looks high for a contract manufacturer with a margin near 3%.
Market capitalisation is $34.0bn and net debt $2.1bn. Revenue growth of 24.8% and full-year guidance of 27% growth at the midpoint explain why the market pays a premium. But the premium is already in the price: on the portal's model fair value implies -11% to the current price.
For comparison: a year earlier revenue grew 7.7%, now 24.8%. Faster growth justifies part of the re-rating, but not all of it. If growth slows to 15–20%, the multiple could compress toward historical levels, and the current price would look inflated.
Full-year guidance raised to $34.9–35.9bn, but it does not reflect the planned Cloud and Power Infrastructure spin-off
The company raised its fiscal 2027 guidance: revenue of $34.9–35.9bn, 27% growth at the midpoint; adjusted operating margin of 7.6–7.8%; adjusted EPS of $4.84–5.16, 52% growth at the midpoint. The previous guidance was $33.7–35.2bn.
An important caveat: the guidance does not reflect the planned spin-off of the Cloud and Power Infrastructure segment into a separate public company. The release table shows that after the spin-off the CPI segment will grow 75–85%, while the remaining RMS + ITS business will grow 8–11%. So the current guidance describes the company before separation.
For an investor this means the revenue and margin structure will change after the spin-off. The high-growth CPI segment will go into a separate company, and the remaining business will grow more modestly. Valuation of the current share must account for the fact that the buyer gets a stake in both companies, but the proportions are not yet defined.
Valuation on the latest reported figures
| Metric | Value |
|---|---|
| Market cap | 34.0 bn USD |
| P/E (LTM) | 32.8 |
| EV/EBITDA (LTM) | 19.2 |
| P/B | 6.61 |
| Net debt / EBITDA (LTM) | 1.10 |
| Operating cash flow (LTM) | 1.21 bn |
| ROE | 18.6% |
| EV/EBITDA, 3-year average | 10.3 |
Bottom line
The strong side of the report is revenue acceleration to 24.8% and adjusted operating margin rising to 7.1%. But GAAP net profit grew only 32.2% because of $110m of one-off costs, and free cash flow fell to $261m. Debt rose to $5,213m, though its ratio to LTM EBITDA remains at 1.1. The key question for a holder is whether the 86% premium to the company's own EV/EBITDA history is justified when the portal's model implies -11% to the current price. The verdict is rather unattractive.
Open the company's financial profile FLEX →
See also: market overview · valuation map · stock screeners