Fabrinet: revenue up 50.7%, but one-off charges and tax weighed on profit
On November 2 Fabrinet reported results for the first quarter of fiscal 2027, ended September 25, 2026. Revenue reached $1,474.5 million, up 50.7% year on year, operating profit was $146.0 million, and net income $103.5 million, up only 7.9%. Profit was held back by a $21.5 million revaluation of non-marketable securities and a $19.9 million Pillar Two tax charge, without which adjusted earnings would have grown far faster. The stock trades below its own three-year history on EV/EBITDA, and at the current price it looks rather attractive.
Key takeaways
— Revenue rose 50.7% on broad demand across several major programs, not on a single customer
— Net income grew only 7.9% because $41.3 million was eaten by a securities revaluation and the Pillar Two tax
— Gross margin slipped to 11.8% from 11.9%, and all of the profit gain came from control over administrative costs
— Operating cash flow fell to $21.3 million because working capital was ploughed into growth: inventories and receivables rose by $321.5 million
— Capex jumped to $158.7 million, pushing free cash flow to minus $137.4 million
— Net debt is negative and leverage is 0.57 EBITDA – a level with no sign of strain
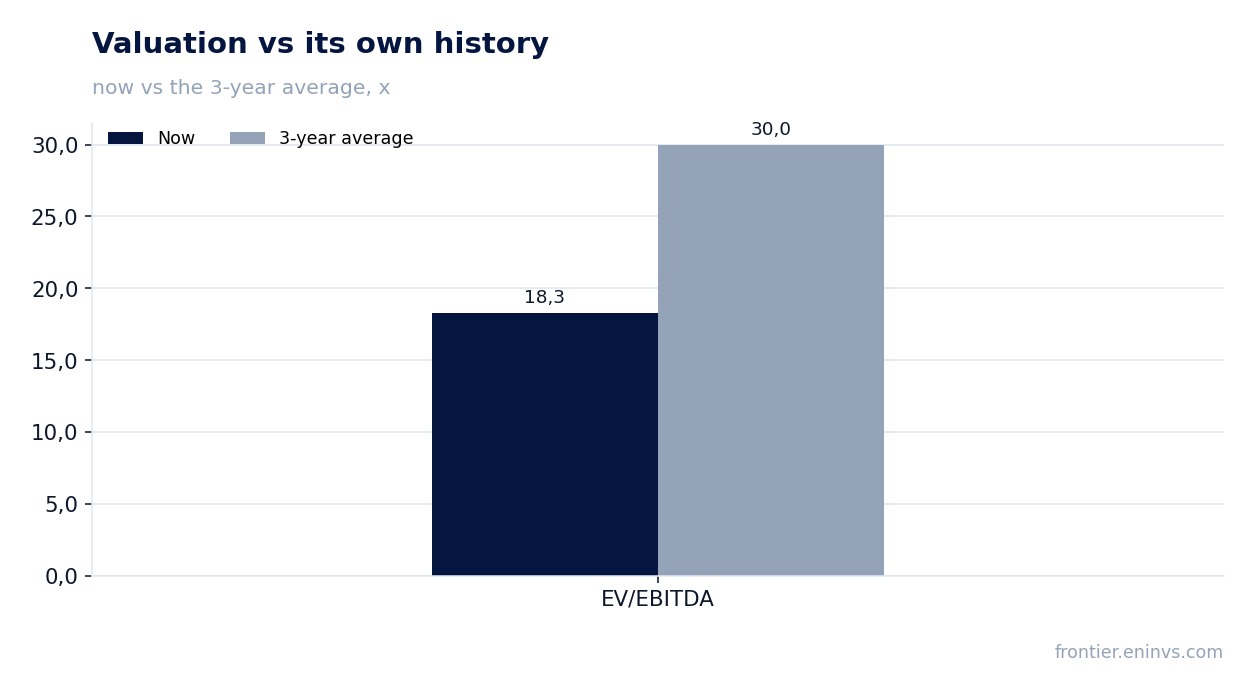
— The stock trades at 18.3 EV/EBITDA against its own three-year average of 30.0, i.e. 39% below its history
Attractiveness
Key figures, USD bn
| Metric | Q3 2025 | Q3 2026 | Change |
|---|---|---|---|
| Revenue | 0.98 | 1.47 | +50.7% |
| EBITDA | 0.11 | — | — |
| Operating profit | 0.09 | 0.15 | +55.0% |
| Net profit | 0.10 | 0.10 | +7.9% |
| Operating cash flow | 0.10 | 0.02 | -79.2% |
| Capex | 0.05 | — | — |
| EBITDA margin | 11.1% | — | — |
| Net margin | 9.8% | 7.0% | -2.8 pp |
Revenue rose 50.7% on broad demand across several major programs, not on a single customer
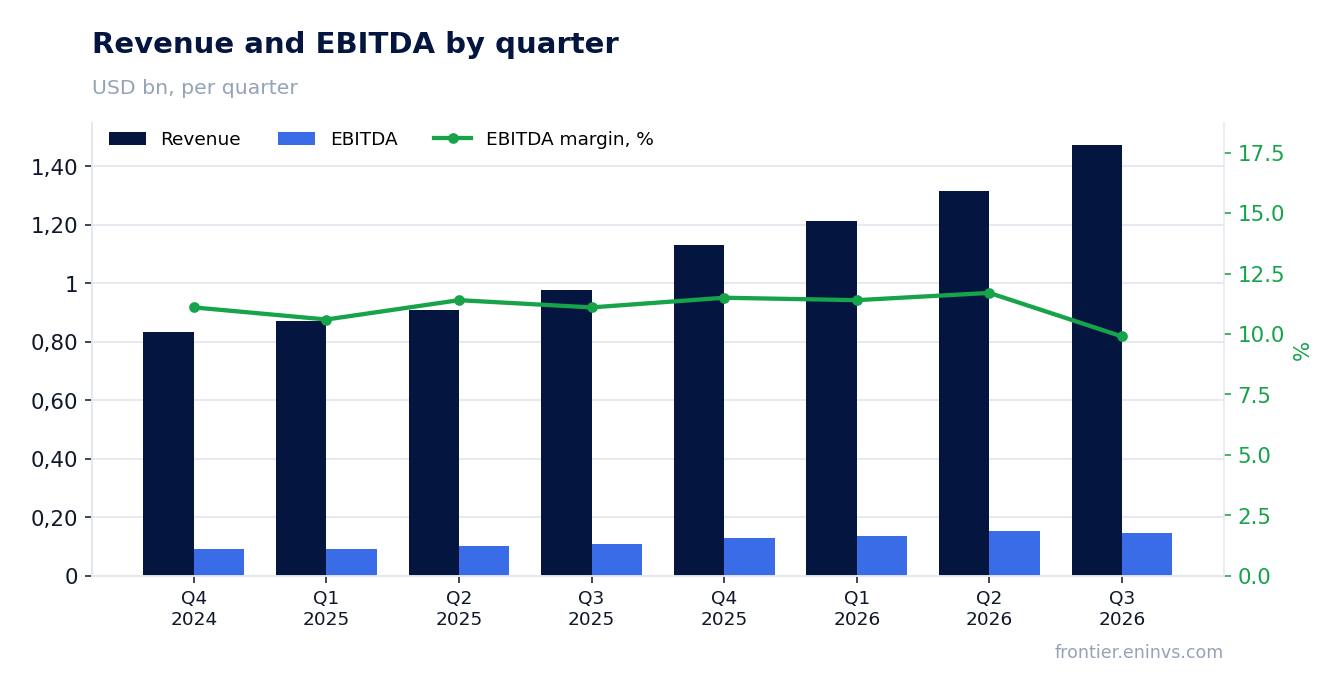
Revenue for the first quarter of fiscal 2027 was $1,474.5 million against $978.1 million a year earlier. CEO Seamus Grady names the cause directly: broad-based demand across several significant programs, with new product ramps adding growth. That is an important difference from a story where growth rests on one large customer.
The pace is accelerating: in the prior quarter, per the facts, revenue grew 44.6% year on year, now 50.7%. The company calls the quarter a revenue record and notes the result exceeded the top end of its own guidance.
Guidance for the second quarter of fiscal 2027 is $1.6–1.65 billion. That means management does not expect growth to stop and is budgeting for a continuation above 50% year on year.
Net income grew only 7.9% because $41.3 million was eaten by a securities revaluation and the Pillar Two tax
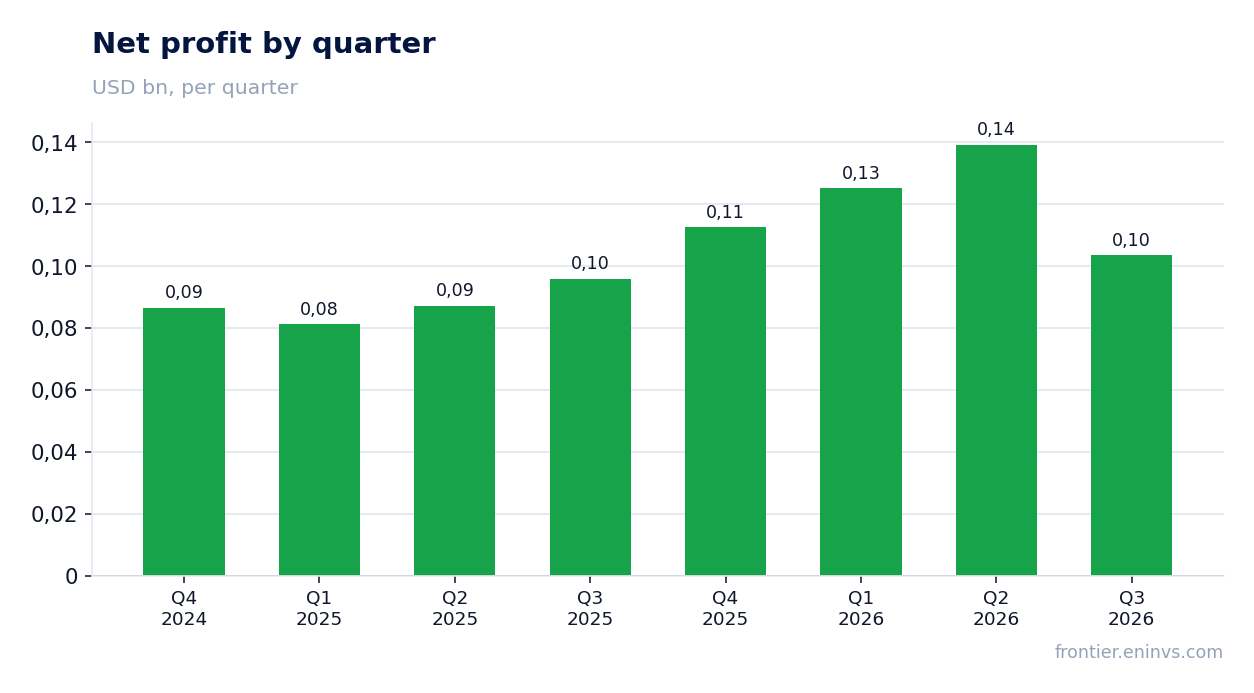
Net income was $103.5 million against $95.9 million a year earlier, up 7.9%. The gap with revenue is explained by two lines: a $21.5 million loss on revaluation of non-marketable equity securities and a $19.9 million Pillar Two tax charge. Together that is $41.3 million, or $1.14 per diluted share.
Adjusted net income excluding these items was $157.4 million, or $4.34 per share against $2.92 a year earlier. That figure shows the company earns far more operationally than reported net income suggests.
The tax rate in the reported quarter was 20.1% against 5.4% a year earlier – the difference is almost entirely the Pillar Two charge. Without it the effective rate would have been close to last year's.
Gross margin slipped to 11.8% from 11.9%, and all of the profit gain came from control over administrative costs
Gross profit rose to $173.8 million from $116.4 million, but margin slipped to 11.8% from 11.9%. Cost of revenue grew slightly faster than revenue – $1,300.7 million against $861.7 million a year earlier. For a contract manufacturer that is a normal picture during rapid volume ramp and new product launches.
Operating profit rose 55% to $146.0 million, and margin climbed to 9.9% from 9.6%. All of the margin gain came from administrative costs: they were $26.7 million against $22.2 million, growing well below revenue. That is the main source of operating leverage in the report.
Adjusted operating margin was 10.8% against 10.6%. The gap with reported is small: adjustments are mainly $11.2 million of share-based compensation and $1.0 million of restructuring.
Operating cash flow fell to $21.3 million because working capital was ploughed into growth: inventories and receivables rose by $321.5 million
Operating cash flow was $21.3 million against $102.6 million a year earlier. The cause is visible in working capital: inventories rose $178.2 million, receivables $143.3 million, other assets $81.2 million. Partly offset by a $262.1 million increase in payables.
That outflow is the price of 50.7% revenue growth. The company is building inventory for new program ramps and shipping more on deferred payment terms. It is not a sign of weak demand, but it is not free cash either.
Free cash flow went to minus $137.4 million: operating cash flow less $158.7 million of capex. A year earlier free cash flow was positive at $57.3 million.
Capex jumped to $158.7 million, pushing free cash flow to minus $137.4 million
Capex rose to $158.7 million from $45.3 million a year earlier – more than tripled. Property, plant and equipment on the balance sheet added $163.2 million in the quarter, to $778.2 million. The company is expanding capacity for the very growth revenue shows.
At the same time Fabrinet drew long-term borrowings for the first time: $74.8 million of proceeds, of which $11.2 million is current and $63.5 million non-current. This is the first quarter in the facts where the company carries debt on the balance sheet.
The board expanded the share repurchase programme by $103.0 million, bringing the total authorisation to $637.3 million. In the reported quarter $29.1 million went to buybacks. The company pays no dividends – all capital return goes through repurchases.
Net debt is negative and leverage is 0.57 EBITDA – a level with no sign of strain
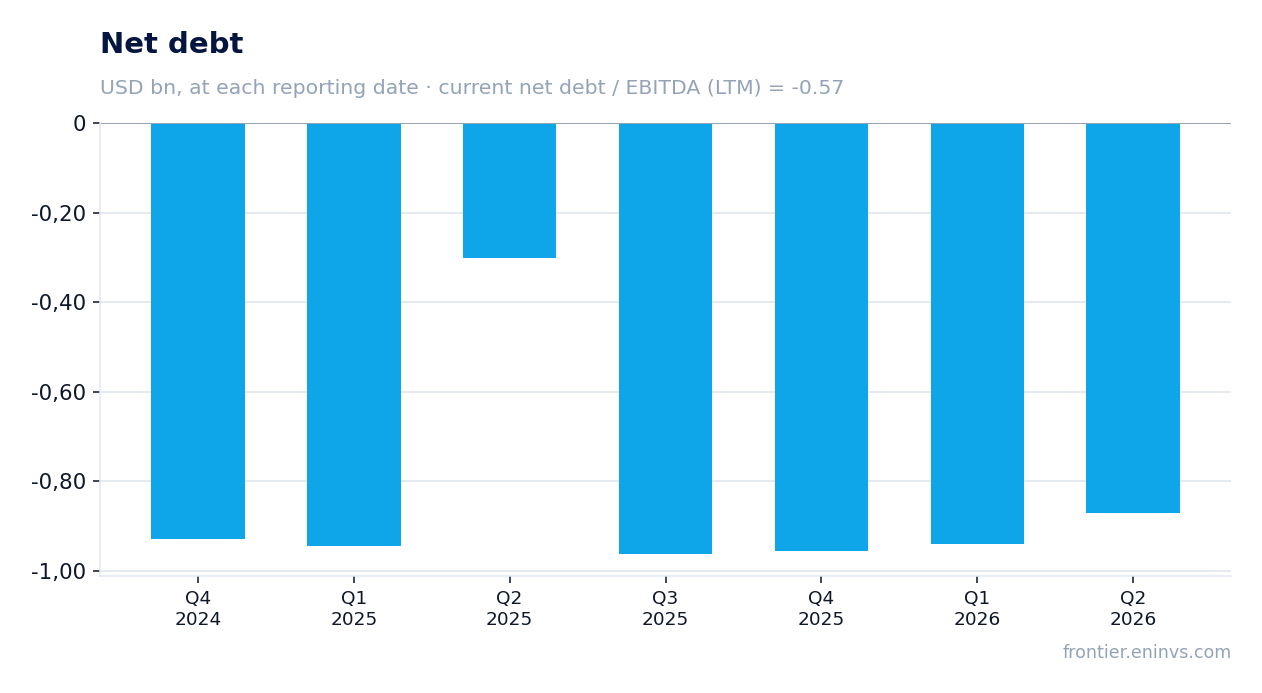
Net debt at the latest reporting date was minus $342.7 million, i.e. cash and short-term investments exceed debt. Net debt to EBITDA over the last twelve months is minus 0.57. There is no leverage; the company funds growth from its own resources and only recently began borrowing.
Interest expense is symbolic – $0.2 million for the quarter, against $5.5 million of interest income. Even with the new debt, servicing does not burden profit.
Over the last twelve months EBITDA was $597.1 million on revenue of $5,100.0 million. That is the base for leverage and for the valuation multiples.
The stock trades at 18.3 EV/EBITDA against its own three-year average of 30.0, i.e. 39% below its history
On EV/EBITDA over the last twelve months the stock trades at 18.3 against its own three-year average of 30.0 – 39% below its history. P/E over the last twelve months is 23.5. The market values the company below where it has stood for three years, even as revenue grows faster than 50%.
On the portal's model the upside to fair value is +18%. That is our own estimate, built on EBITDA growth and a target multiple, not a market consensus.
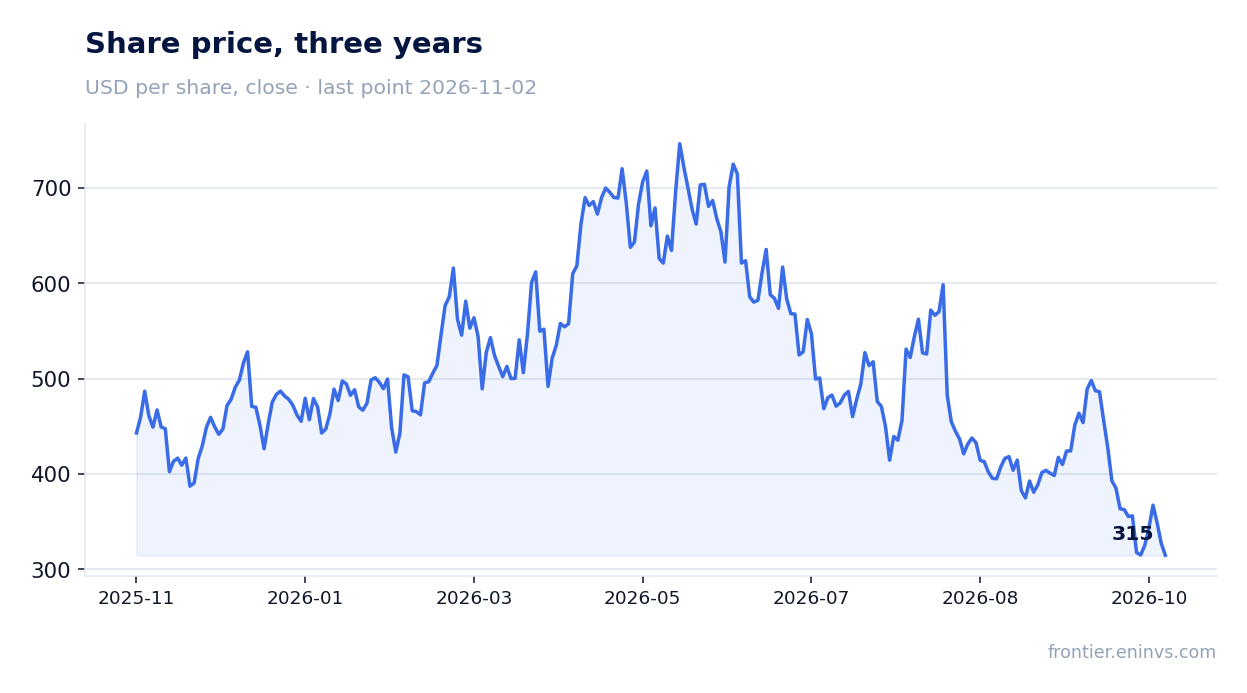
Since the release the share has lost 3.8%, and the same from the release to November 2. The market reaction was restrained: revenue growth impresses, but weak cash flow and one-off charges in profit outweighed it.
Valuation on the latest reported figures
| Metric | Value |
|---|---|
| Market cap | 11.3 bn USD |
| P/E (LTM) | 23.5 |
| EV/EBITDA (LTM) | 18.3 |
| P/B | 4.59 |
| Net debt / EBITDA (LTM) | -0.57 |
| Operating cash flow (LTM) | 0.18 bn |
| ROE | 16.7% |
| EV/EBITDA, 3-year average | 30.0 |
Bottom line
The strong side of the report remains revenue: $1,474.5 million and acceleration to 50.7% growth, with guidance for the next quarter above $1.6 billion. The weak spot is the quality of profit and cash: net income grew only 7.9% because of one-off items, and free cash flow went to minus $137.4 million amid a tripling of capex. Leverage is absent, and the 18.3 EV/EBITDA multiple is 39% below its own three-year history. The question for a holder now is not demand but when investment in capacity and working capital starts returning cash. At the current price the stock looks rather attractive.
Open the company's financial profile FN →
See also: market overview · valuation map · stock screeners