FORMFACTOR INC: profit nearly quintupled, but the market now pays twice its own history for it

On 28 October FORMFACTOR INC reported results for the quarter ended 26 September 2026. Revenue came in at $280.5m, operating profit at $81.6m, net profit at $73.8m and operating cash flow at $104.3m. Year on year revenue grew 38.4% and net profit 371.5%, while the net margin rose from 7.7% to 26.3%. The stock, however, trades at 51.7 EV/EBITDA against its own three-year average of 33.9, so much of the growth is already priced in: verdict – neutral.
Key takeaways
— Revenue accelerated to +38.4% year on year, and the whole gain flowed into operating profit
— The net margin rose from 7.7% to 26.3% – revenue outgrew costs
— Operating cash flow of $104.3m exceeded net profit of $73.8m
— Net debt is negative: the company holds more cash than it owes
— The 51.7 EV/EBITDA multiple is 52% above its own three-year average of 33.9
— On the portal's model the upside to fair value is +27%
Attractiveness
Key figures, USD bn
| Metric | Q3 2025 | Q3 2026 | Change |
|---|---|---|---|
| Revenue | 0.20 | 0.28 | +38.4% |
| EBITDA | 0.03 | — | — |
| Operating profit | 0.02 | 0.08 | +353.2% |
| Net profit | 0.02 | 0.07 | +371.5% |
| Operating cash flow | 0.03 | 0.10 | +286.3% |
| Capex | 0.01 | — | — |
| EBITDA margin | 14.7% | — | — |
| Net margin | 7.7% | 26.3% | +18.6 pp |
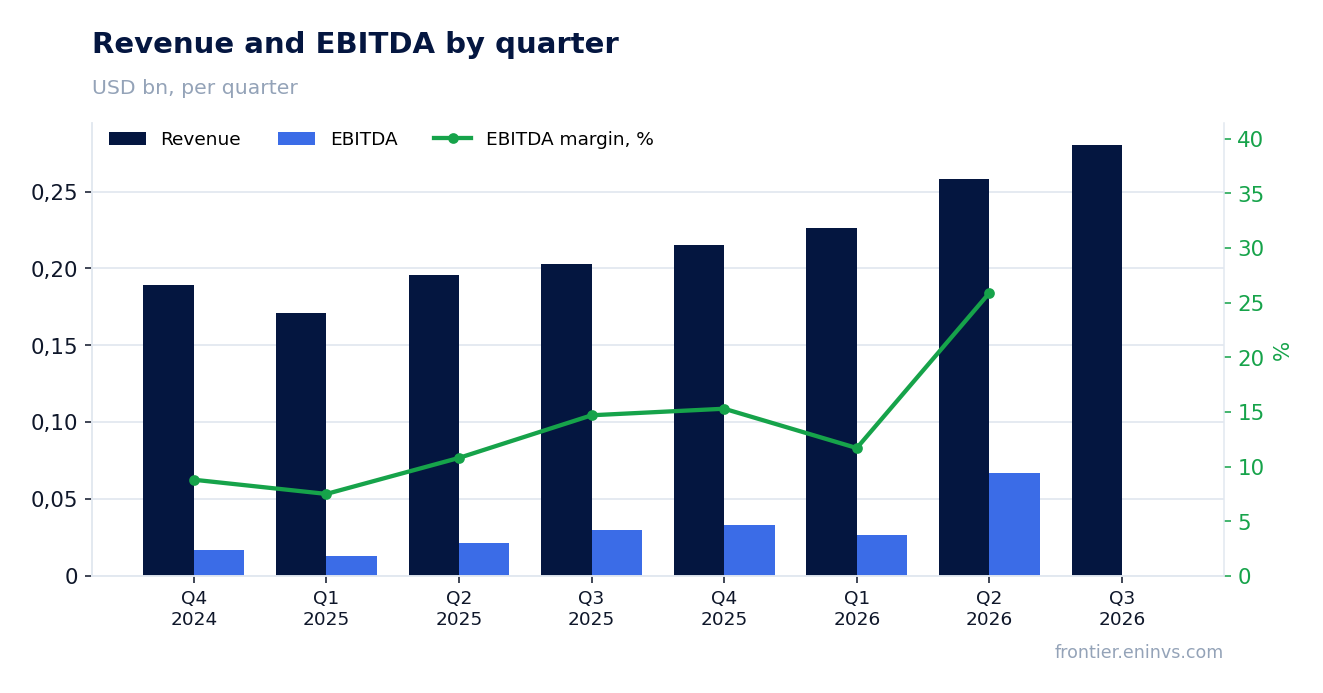
Revenue accelerated to +38.4% year on year, and the whole gain flowed into operating profit
Revenue for the quarter ended 26 September 2026 came to $280.5m, 38.4% more than a year earlier. That is an acceleration from the previous quarter's 31.9% growth. As recently as late 2025 the trend was far weaker: revenue grew 13.6% in Q4 2025 and was negative in Q3 2025.
Operating profit grew disproportionately, to $81.6m. On revenue of $280.5m that is an operating margin of about 29%, against operating profit of just $18.0m on revenue of $202.7m a year earlier. In other words, each extra dollar of revenue now brings in far more profit than it did a year ago.
This means fixed costs barely grew alongside revenue. For a holder the point is that the company is not merely growing turnover but doing so with rising returns. How durable that operating leverage is will be answered by the next report.
The net margin rose from 7.7% to 26.3% – revenue outgrew costs
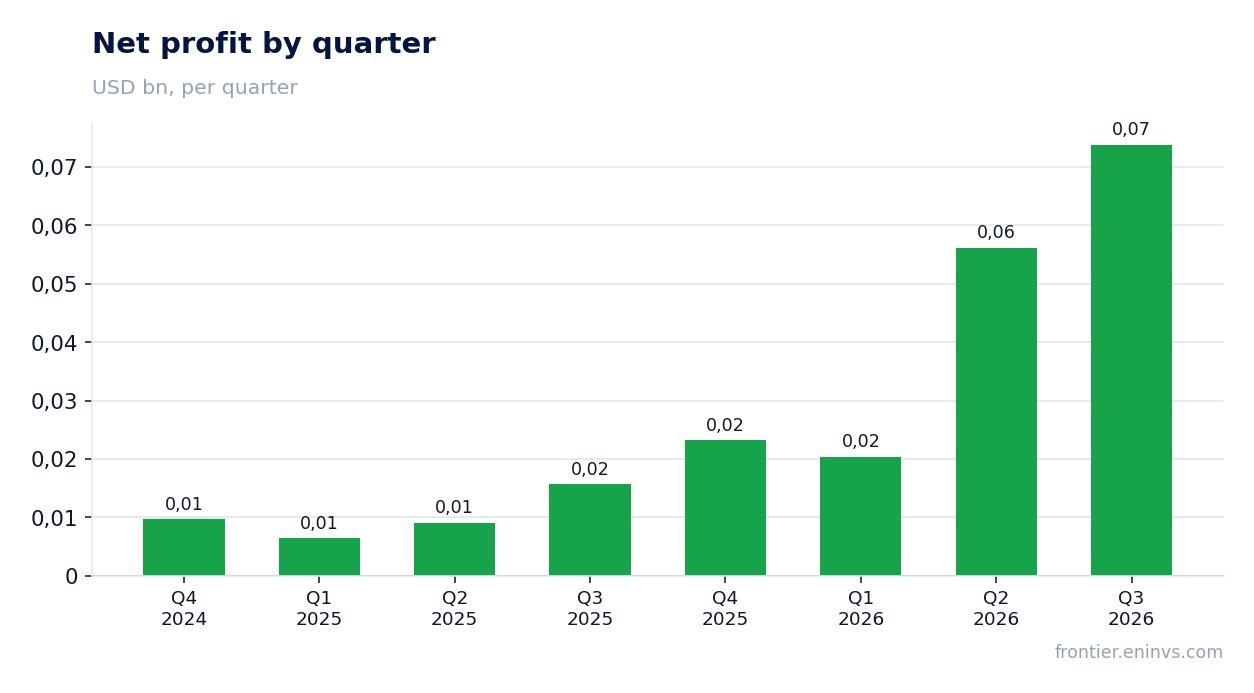
Net profit for the quarter was $73.8m against $15.7m a year earlier, up 371.5%. The net margin rose from 7.7% to 26.3%. The gap between operating and net profit is small: with operating profit of $81.6m, net profit of $73.8m is only $7.8m lower.
That narrow gap shows interest costs and taxes are not eating a large share of the result. The company has negative net debt, so interest expense does not weigh on profit. The main driver of the margin gain was the operating line, not one-off items below it.
Whether the 26.3% margin holds is the key question. If it does, profit stays high even on slower revenue growth. If the quarter rested on an unusually favourable order mix, the margin could give back some ground.
Operating cash flow of $104.3m exceeded net profit of $73.8m
Operating cash flow for the quarter was $104.3m, above net profit of $73.8m. Cash flow exceeding profit means the result is backed by real receipts, not just accruals. A year earlier operating cash flow was $27.0m on profit of $15.7m – the relationship holds.
Over the last twelve months operating cash flow was $257.0m on revenue of $980.1m. That is about a quarter of revenue, a strong figure for an equipment maker. Cash has been generated steadily across all four recent quarters.
Free cash flow also depends on capex. It has varied: $66.3m in Q2 2025, $15.2m in Q1 2026, $9.6m in Q2 2026. At that level of capex, operating cash flow of $104.3m leaves a substantial portion free.
Net debt is negative: the company holds more cash than it owes
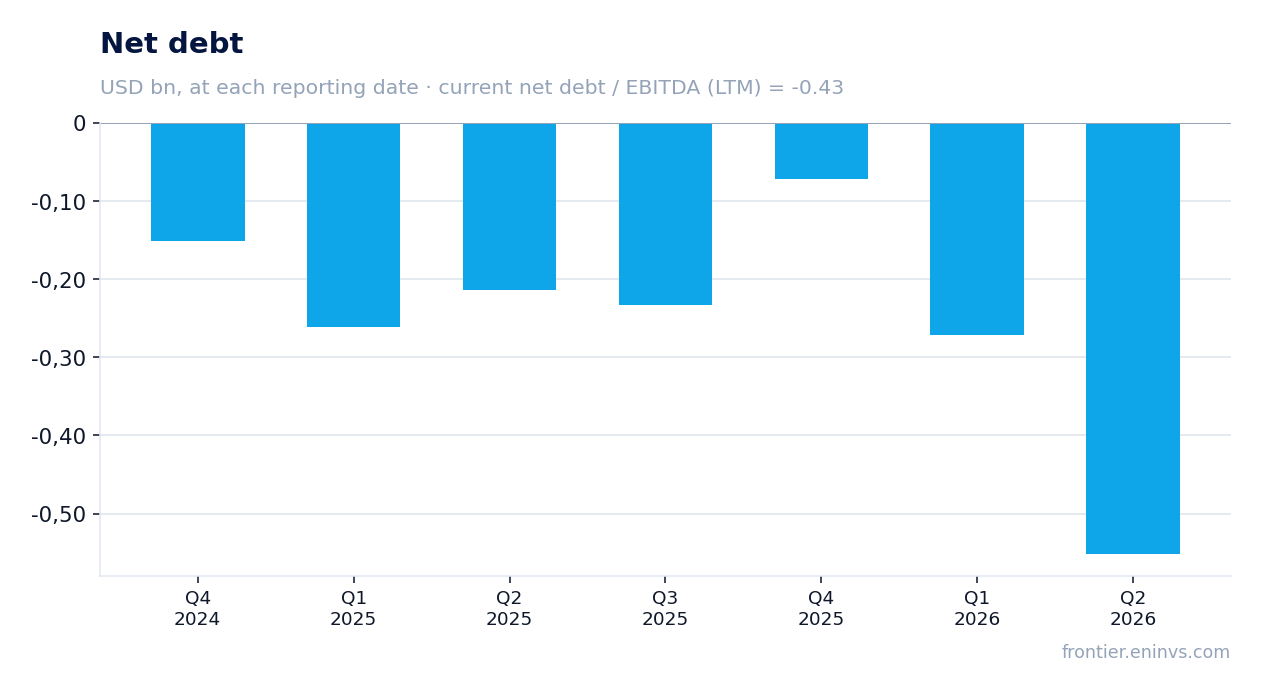
At the latest annual balance-sheet date net debt stood at minus $70.97m – cash exceeds debt. Net debt to EBITDA over the last twelve months is minus 0.43. A negative figure means the company funds itself and does not depend on borrowed money.
Net debt has swung widely by quarter: from minus $552.2m in Q2 2026 to minus $71.0m at the latest annual date. Such swings reflect cash movements and settlement timing rather than any change in leverage in either direction. The net debt to EBITDA ratio remains negative.
For a holder this means no interest pressure on profit and a liquidity cushion. The company can fund capex and return capital to shareholders without borrowing.
The 51.7 EV/EBITDA multiple is 52% above its own three-year average of 33.9
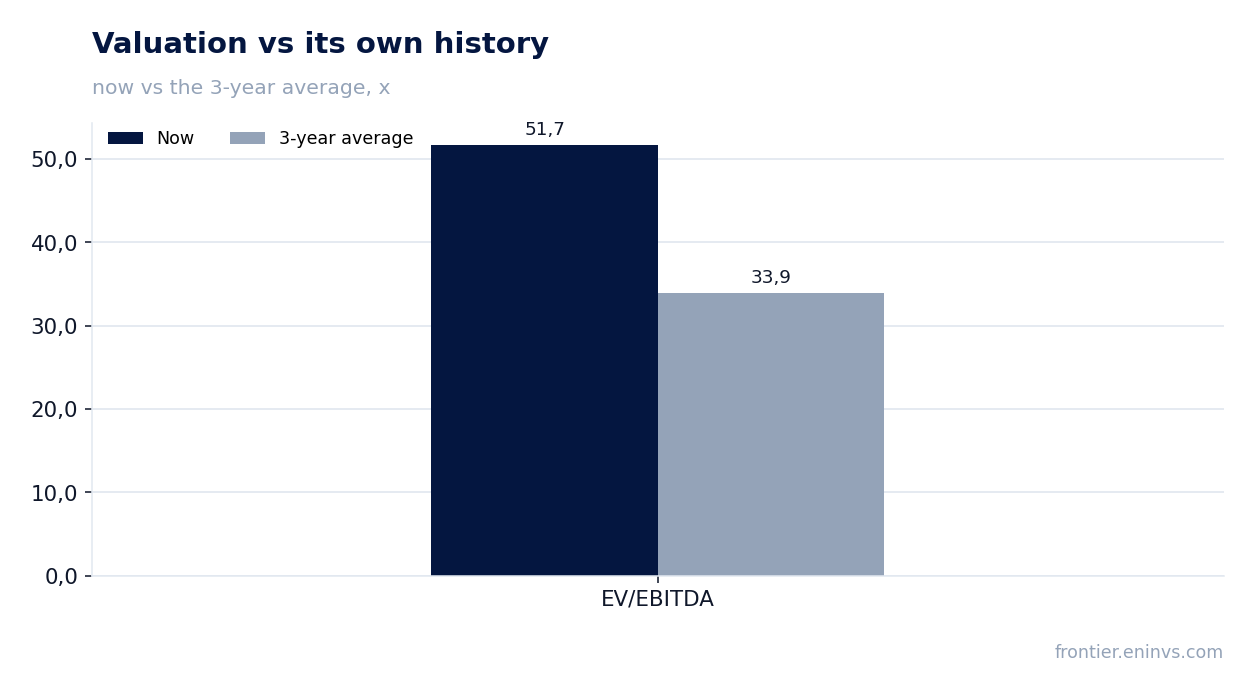
On the last twelve months EV/EBITDA is 51.7 against its own three-year average of 33.9, 52% higher. The stock trades dearer than it usually has over the past three years. P/E on the last twelve months is 49.8, which at net profit of $173.6m and a market cap of $8,638.7m matches the current valuation.
Profit growth partly justifies the high multiple: EBITDA over the last twelve months was $165.7m, and if profit keeps growing at this pace the multiple will come down on its own. But that requires the growth to persist rather than prove a one-quarter spike.
On the portal's model the upside to fair value is +27%. That is our own estimate, built on EBITDA growth and a target multiple, not a market consensus. It shows that if current momentum holds the stock has not exhausted its upside, though the cushion is no longer large.
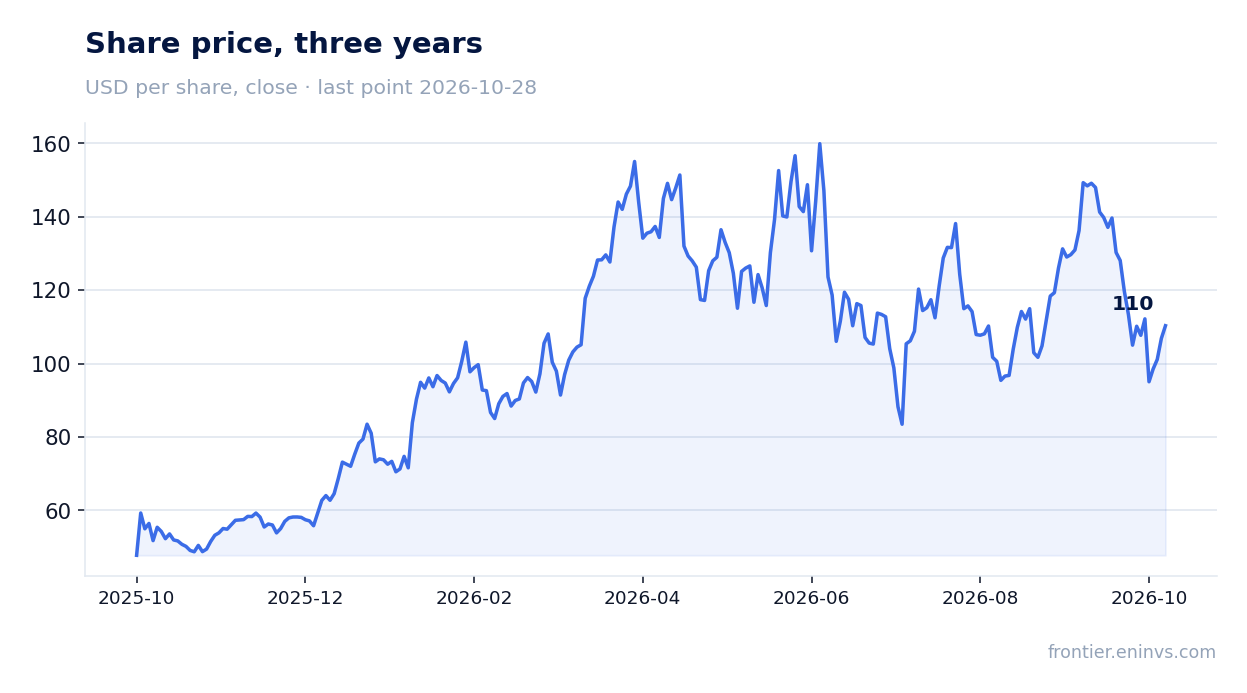
On the portal's model the upside to fair value is +27%
Our model values fair value through EBITDA growth times a target multiple and compares it with market cap. On that model the upside is +27%. This is not a target price or a recommendation but an estimate of how far the current price lags the fundamental trajectory.
The market reaction was restrained: the stock added 3.2% on the release day and the same 3.2% from the release to 28 October. The closing price before publication was $106.85. The market accepted the result but did not re-rate the stock sharply higher.
The combination of a strong report and a moderate reaction suggests investors had already priced in good results. Further gains will depend on the margin and revenue being confirmed next quarter.
Valuation on the latest reported figures
| Metric | Value |
|---|---|
| Market cap | 8.64 bn USD |
| P/E (LTM) | 49.8 |
| EV/EBITDA (LTM) | 51.7 |
| P/B | 8.34 |
| Net debt / EBITDA (LTM) | -0.43 |
| Operating cash flow (LTM) | 0.26 bn |
| ROE | 25.8% |
| EV/EBITDA, 3-year average | 33.9 |
Bottom line
The quarter ended 26 September 2026 was strong across every key line: revenue grew 38.4%, net profit 371.5%, the margin rose to 26.3%, and operating cash flow of $104.3m exceeded profit. Growth accelerated from the previous quarter, and the company carries negative net debt. The main question for a holder is price: the 51.7 EV/EBITDA multiple is 52% above its own history, and the market has already priced in continued growth. On the portal's model the +27% upside leaves room but not a large cushion. Verdict – neutral: the stock is attractive on momentum but not on valuation.
Open the company's financial profile FORM →
See also: market overview · valuation map · stock screeners