GE Vernova Inc.: revenue accelerated to +26.8% and EBITDA tripled, yet the market met the report with a decline
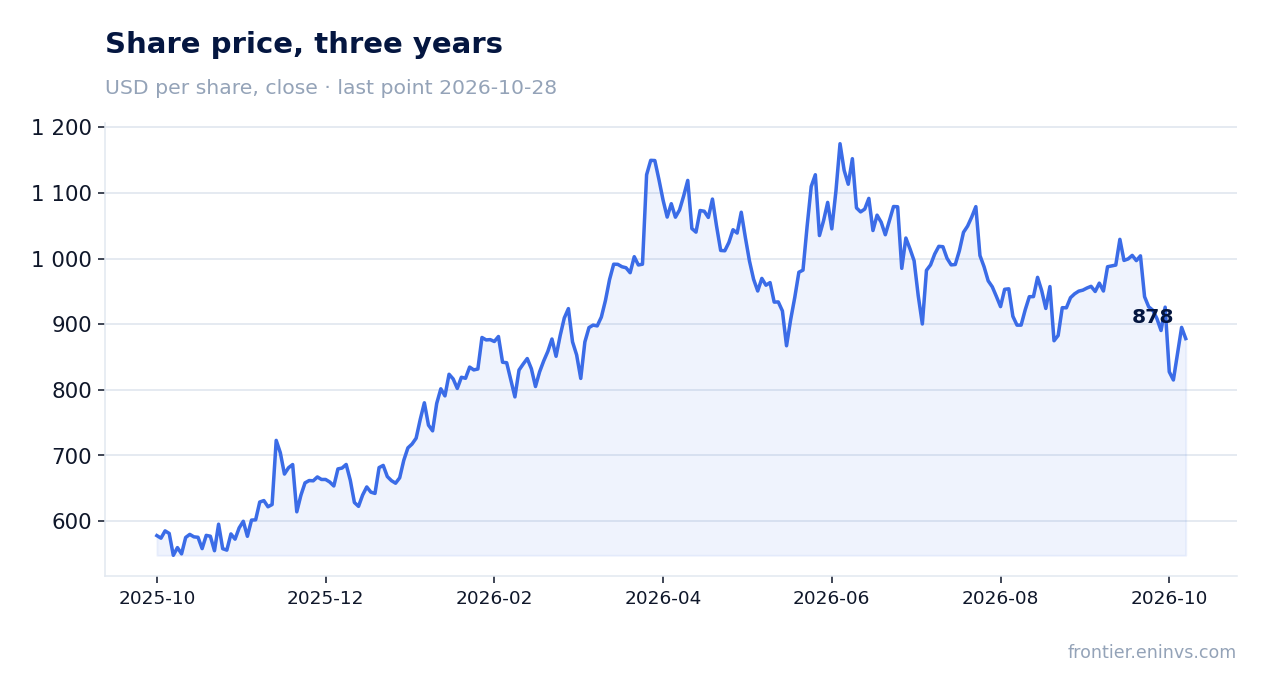
On 28 October GE Vernova Inc. released its third-quarter 2026 results. Revenue reached 12,642 million dollars, up 26.8% year on year, EBITDA came in at 1,833 million, 3.2 times the year-earlier level, and net profit at 1,291 million. Growth accelerated from the second quarter (+21.9%), the EBITDA margin rose to 14.5% from 5.8%, and net debt at the end of September was negative at 13,969 million. Yet the share fell 1.9% after the release and remains below its close before publication. At an EV/EBITDA of 52.8 the stock is cheaper than its own three-year average of 66.7, and the portal's model puts the upside to fair value at +29%, so at the current price the share looks rather attractive.
Key takeaways
— Revenue rose 26.8% year on year, and growth accelerated from +21.9% in the second quarter
— EBITDA tripled to 1,833 million and the margin rose to 14.5% from 5.8%
— Net profit of 1,291 million includes one-off items, without which the picture is more modest
— Operating cash flow of 6,057 million against capital expenditure of 647 million left free cash flow of about 5,410 million
— Net debt turned negative at 13,969 million on 30 September against 7,323 million on 30 June
— EV/EBITDA of 52.8 is below its own three-year average of 66.7, and the portal's model puts the upside at +29%
— A dividend yield of 0.23% plays no role in valuing the share
Attractiveness
Key figures, USD bn
| Metric | Q3 2025 | Q3 2026 | Change |
|---|---|---|---|
| Revenue | 9.97 | 12.6 | +26.8% |
| EBITDA | 0.58 | 1.83 | +216.6% |
| Operating profit | 0.37 | 1.39 | +280.9% |
| Net profit | 0.45 | 1.29 | +185.6% |
| Operating cash flow | 0.98 | 6.06 | +518.1% |
| Capex | 0.25 | 0.65 | +161.9% |
| EBITDA margin | 5.8% | 14.5% | +8.7 pp |
| Net margin | 4.5% | 10.2% | +5.7 pp |
Revenue rose 26.8% year on year, and growth accelerated from +21.9% in the second quarter
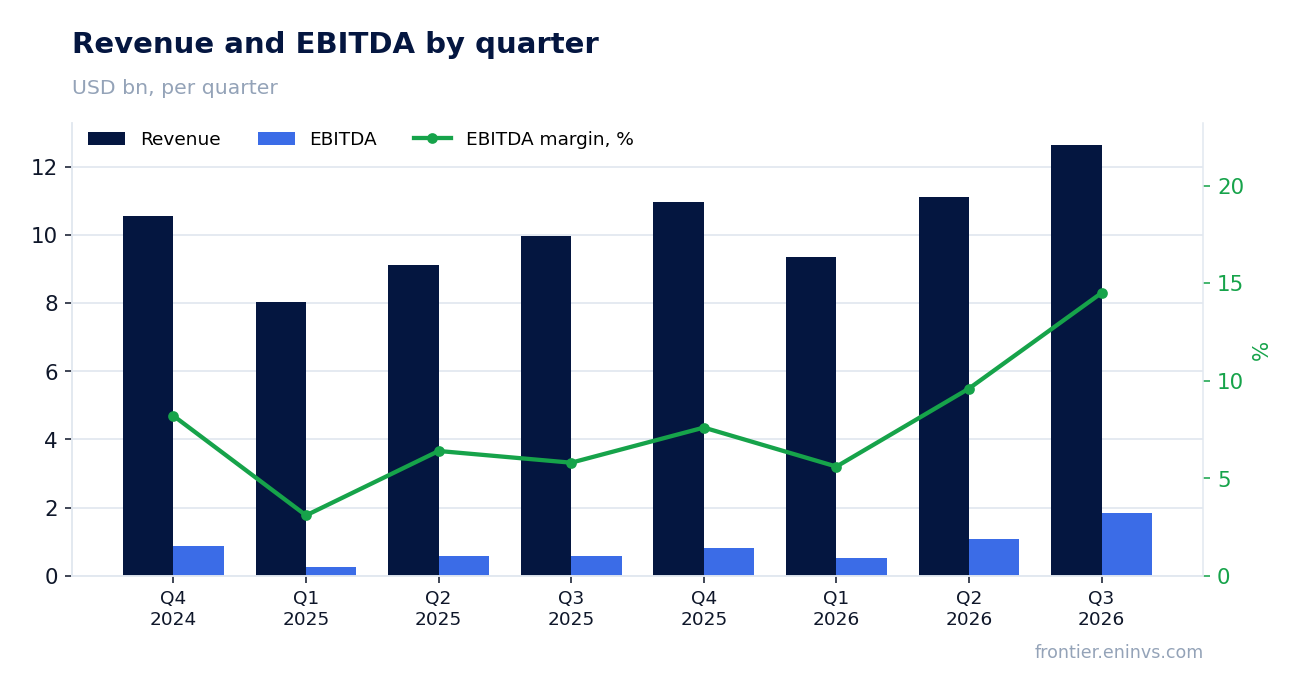
In the third quarter of 2026 revenue reached 12,642 million dollars, 26.8% more than a year earlier. That is the fastest pace in recent quarters: growth was 21.9% in the second quarter, 16.3% in the first and 3.8% in the fourth quarter of 2025. Acceleration has now run for two quarters in a row, and in absolute terms the quarter was a record in the available history.
The sequence of quarterly rates shows demand is not a one-off: 9,969 million in the third quarter of 2025, 10,956 million in the fourth, 9,339 million in the first quarter of 2026, 11,104 million in the second and 12,642 million in the third. The first-quarter dip reflects the calendar rather than demand, and already in the second quarter revenue returned above 11 billion.
For valuation, speed matters less than durability. Three consecutive quarters above 11 billion dollars is a new base from which both margin and cash flow are measured. The next report will show whether that base holds without the seasonal fourth-quarter factor.
EBITDA tripled to 1,833 million and the margin rose to 14.5% from 5.8%
EBITDA for the third quarter of 2026 was 1,833 million dollars against 579 million a year earlier, up 216.6%. The EBITDA margin rose to 14.5% from 5.8%. Operating profit reached 1,394 million, and the 439 million gap between EBITDA and operating profit shows that depreciation remains moderate relative to revenue.
Margin growth on revenue of +26.8% means costs rose more slowly than income. That is operating leverage: on a revenue base above 12 billion dollars each extra percentage point of margin adds about 126 million of EBITDA. This is why profit grows several times faster than revenue.
Durability of the margin is the main question. The 14.5% level was reached in a quarter of record revenue, and in quarters with lower loading the margin will be lower. For an annual assessment the four-quarter average margin matters more than the peak.
Net profit of 1,291 million includes one-off items, without which the picture is more modest
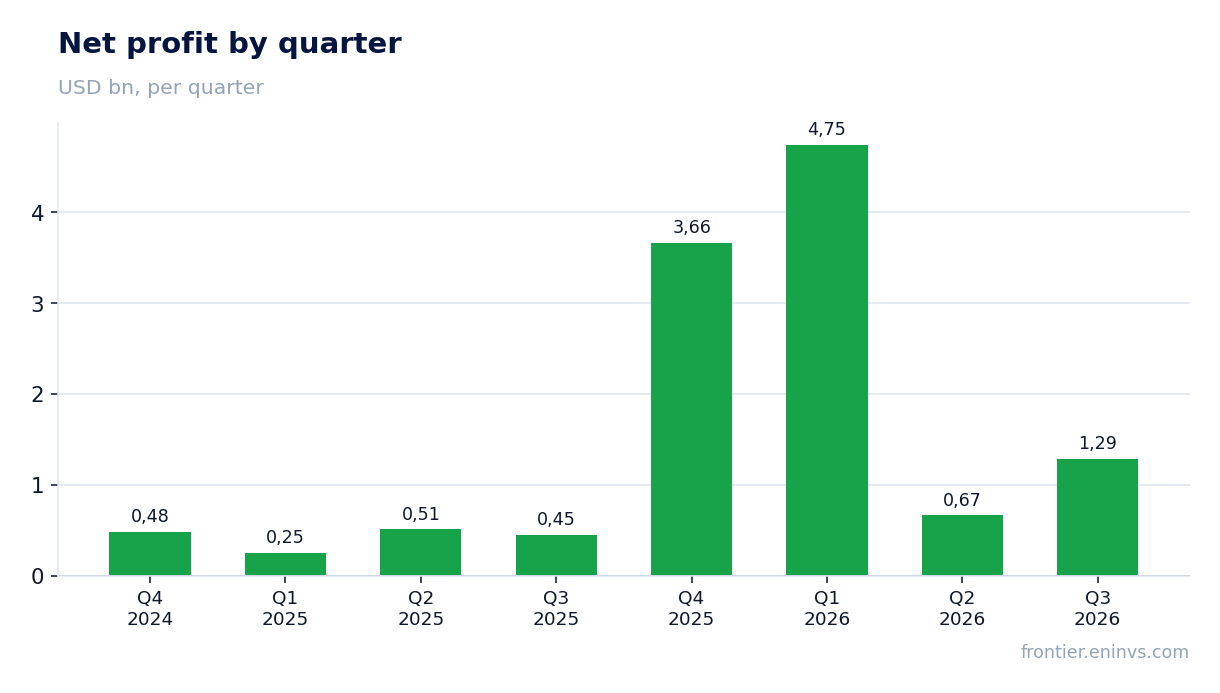
Net profit for the third quarter of 2026 was 1,291 million dollars against 452 million a year earlier, up 185.6%. The net margin rose to 10.2% from 4.5%. Profit grew more slowly than EBITDA, which points to higher interest, taxes or non-operating items.
In earlier quarters profit was well above operating dynamics: 4,745 million in the first quarter of 2026 and 3,664 million in the fourth quarter of 2025 on EBITDA of 521 million and 831 million respectively. Such a gap points to one-off gains in those periods. In the third quarter the gap between profit and EBITDA is much smaller, and profit is closer to the operating result.
Over the last twelve months net profit was 10,368 million dollars on EBITDA of 4,374 million. Profit exceeding EBITDA over that period confirms that large one-off items fell into the LTM, and the P/E of 23.0 should be read with that adjustment.
Operating cash flow of 6,057 million against capital expenditure of 647 million left free cash flow of about 5,410 million
Operating cash flow for the third quarter of 2026 was 6,057 million dollars, more than EBITDA of 1,833 million. Cash flow exceeding profit means working-capital release: the company collected cash faster than it recognised revenue. That is a one-off effect by nature and may not repeat next quarter.
Capital expenditure was modest at 647 million dollars, or 5.1% of revenue. Free cash flow, operating flow less capital expenditure, came to about 5,410 million. This is the main argument for the quality of the report: cash arrived not only in profit but in the account.
Over the last twelve months operating flow reached 19,216 million dollars. Consistently high conversion of profit into cash with capital expenditure below 6% of revenue is a strength of the model, and it matters more than one-off swings in quarterly profit.
Net debt turned negative at 13,969 million on 30 September against 7,323 million on 30 June
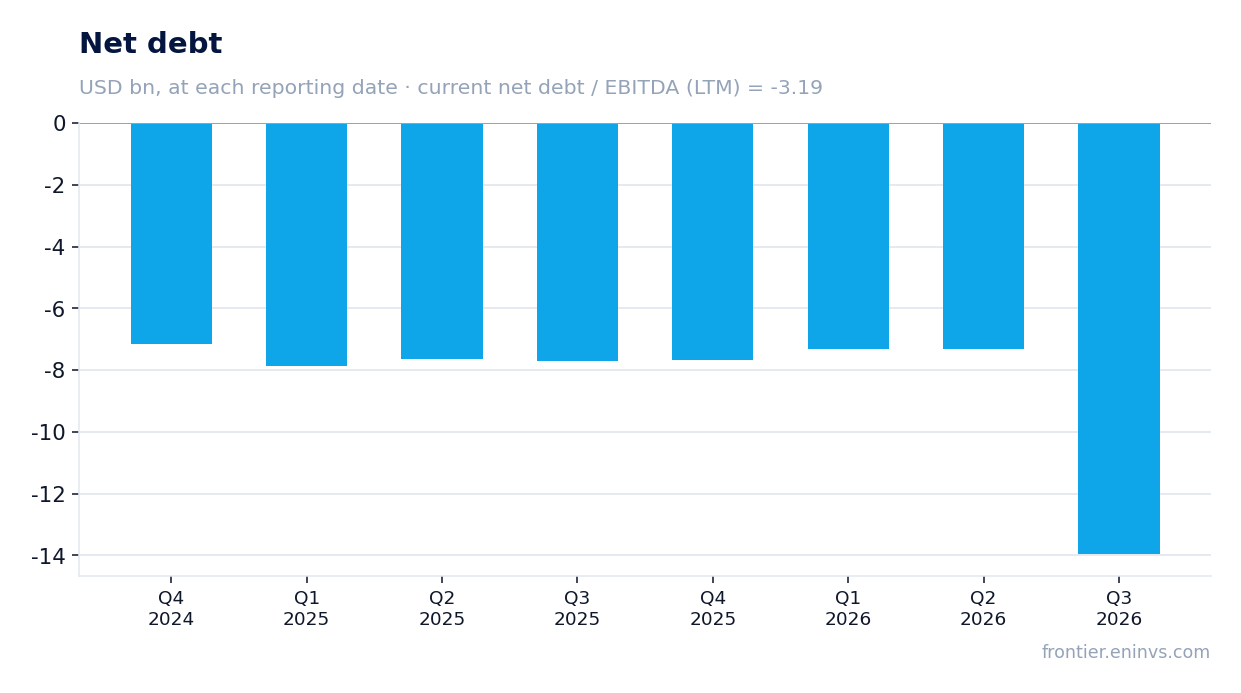
Net debt on 30 September 2026 was minus 13,969 million dollars, meaning cash exceeds debt obligations. On 30 June the figure was minus 7,323 million, a quarterly change of minus 6,566 million. A year earlier, on 30 September 2025, net debt was minus 7,704 million, a twelve-month change of minus 6,265 million.
Negative net debt means the company funds working capital and investment from its own resources. The ratio of net debt to EBITDA over the last twelve months is minus 3.19, a level at which there is effectively no debt burden. Interest on debt does not weigh on profit.
The cash inflow in the quarter coincided with strong operating flow of 6,057 million. This is not borrowed funding but earned money, and that is why balance-sheet quality improved without a rise in liabilities.
EV/EBITDA of 52.8 is below its own three-year average of 66.7, and the portal's model puts the upside at +29%
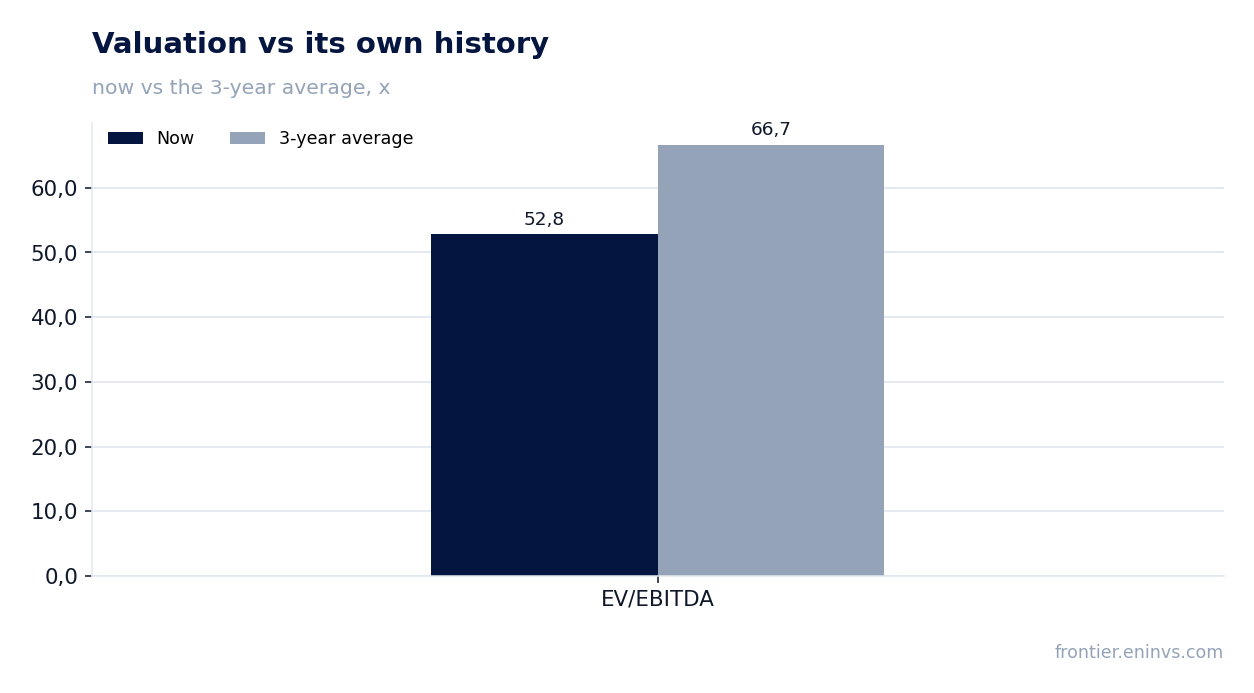
At an EV/EBITDA of 52.8 the share trades below its own three-year average of 66.7, 21% cheaper than usual over the past three years. This is the only valid comparison: we do not compare with industry peers or sector averages, as no such data is in the facts.
The trailing twelve-month P/E is 23.0, but LTM profit of 10,368 million includes one-off items. Stripping them out would raise the multiple. EV/EBITDA is therefore a more reliable anchor for this stock than P/E.
The portal's model, which sets EBITDA growth against the target multiple and market capitalisation, puts the upside to fair value at +29%. This is our own estimate, not a market consensus and not a target price. The market met the report with a decline: the share fell 1.9% on the publication day and remains 1.9% below its close before the release.
A dividend yield of 0.23% plays no role in valuing the share
The trailing twelve-month dividend yield is 0.23%, a figure that does not affect the return on an investment. At such a yield the dividend is not an argument for the share and does not offset risks.
The company directs money into investment and balance-sheet strength rather than payouts. Net debt is negative at 13,969 million, capital expenditure is moderate, and free cash flow of about 5,410 million for the quarter stays inside the business. That is sensible policy for a growing company, but the stock does not suit an income-oriented investor.
Against the key rate a yield of 0.23% is irrelevant: it is dozens of times lower. The share must be valued on growth and the multiple, not on payouts.
Valuation on the latest reported figures
| Metric | Value |
|---|---|
| Market cap | 239 bn USD |
| P/E (LTM) | 23.0 |
| EV/EBITDA (LTM) | 52.8 |
| P/B | 21.37 |
| Net debt / EBITDA (LTM) | -3.19 |
| Operating cash flow (LTM) | 19.2 bn |
| ROE | 44.3% |
| Dividend yield (12m) | 0.2% |
| EV/EBITDA, 3-year average | 66.7 |
Bottom line
The strength of the report is not profit but cash: operating flow of 6,057 million against capital expenditure of 647 million left about 5,410 million of free flow, and net debt turned negative at 13,969 million. Revenue accelerated to +26.8%, and an EBITDA margin of 14.5% against 5.8% a year earlier shows real operating leverage. Part of the LTM profit of 10,368 million came from one-off items, so the P/E of 23.0 understates the valuation, and EV/EBITDA of 52.8 is the better anchor. The share is cheaper than its own three-year average of 66.7, and the portal's model puts the upside at +29%. The question for a holder now is whether margin and cash flow hold at the new level once the seasonal fourth-quarter factor fades.
Open the company's financial profile GEV →
See also: market overview · valuation map · stock screeners