Alphabet Inc.: revenue up 24.7% but net profit down a quarter on investment markdowns

On 28 October Alphabet Inc. reported third-quarter 2026 results. Revenue rose 24.7% year on year to $127,577 million, operating profit added 30% to $40,576 million, while net profit fell 25.2% to $26,170 million – last year's quarter was inflated by a gain on securities, this year it was replaced by a loss. The stock trades at 22.1 EV/EBITDA LTM against its own three-year average of 20.4, i.e. above its history, yet the portal's model puts upside to fair value at +20%. Given strong revenue and cloud growth but a rich multiple and one-off profit, the share looks rather attractive.
Key takeaways
— Revenue grew 24.7% – roughly the same pace as 24.2% a quarter earlier
— Google Cloud grew 103% to $30,709 million and delivered $11,121 million of operating profit
— Operating margin rose to 31.8%, but net profit fell 25.2% on an $8,664 million investment loss
— Free cash flow turned negative at -$9,065 million on $51,355 million of capex
— Debt rose to $125,102 million, while equity and bond issuance brought in $41.4 billion
— The stock trades at 22.1 EV/EBITDA LTM against its own three-year average of 20.4 – above its history
— The $0.22 dividend yields just 0.26% – the payout is no argument for the share
Attractiveness
Key figures, USD bn
| Metric | Q3 2025 | Q3 2026 | Change |
|---|---|---|---|
| Revenue | 102 | 128 | +24.7% |
| EBITDA | 36.8 | — | — |
| Operating profit | 31.2 | 40.6 | +29.9% |
| Net profit | 35.0 | 26.2 | -25.2% |
| Operating cash flow | 48.4 | 42.3 | -12.6% |
| Capex | 24.0 | — | — |
| EBITDA margin | 36.0% | — | — |
| Net margin | 34.2% | 20.5% | -13.7 pp |
Revenue grew 24.7% – roughly the same pace as 24.2% a quarter earlier
Third-quarter 2026 revenue came to $127,577 million, up 24.7% year on year. A quarter earlier growth was 24.2%, so the pace is roughly unchanged. In constant currency revenue rose 25%, so FX is not the main driver here.
Google Services did the heavy lifting: $96,302 million, up 11%. Within it, Search & other grew 12% to $63,350 million, YouTube ads to $11,207 million, subscriptions, platforms and devices to $14,290 million. The company notes that year-on-year search query growth was the highest in five years.
But the main accelerator is Google Cloud: revenue grew 103% to $30,709 million. The company ties this to GCP growth in enterprise AI solutions and to TPU sales. Cloud's share of revenue rose from 14.8% to 24.1%, and it now sets the overall pace.
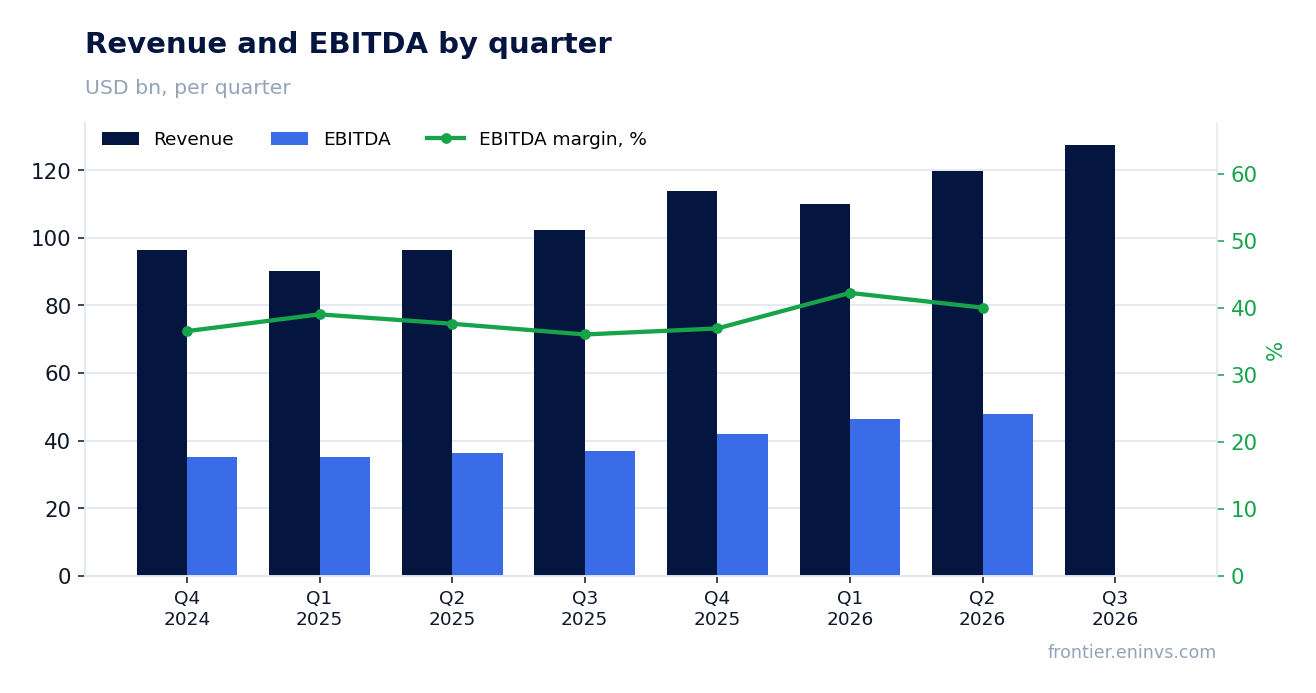
Google Cloud grew 103% to $30,709 million and delivered $11,121 million of operating profit
Google Cloud operating profit was $11,121 million versus $3,594 million a year earlier. On revenue of $30,709 million that is a margin of about 36.2% – cloud is no longer a subsidised segment and has become the second profit centre after services.
Google Services delivered $39,157 million of operating profit on $96,302 million of revenue, a margin of about 40.7%. Other Bets stayed loss-making: -$2,047 million versus -$1,426 million a year earlier. Alphabet-level activities – shared AI research – rose to $7,655 million from $4,467 million.
It was cloud growth and restrained growth in shared costs that lifted operating profit to $40,576 million, up 30% year on year. That is faster than revenue, so operating leverage worked.
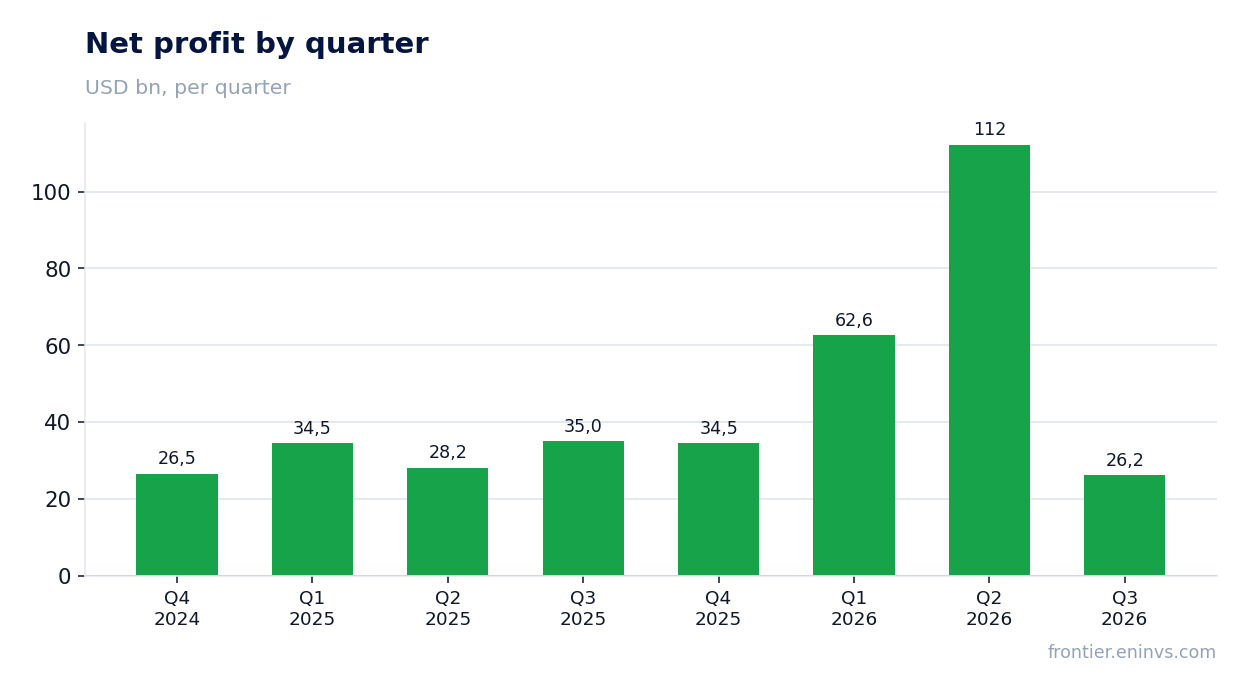
Operating margin rose to 31.8%, but net profit fell 25.2% on an $8,664 million investment loss
Operating margin for the quarter was 31.8% versus 30.5% a year earlier. Cloud and restrained shared costs drove it: operating profit grew 30% on 24.7% revenue growth.
Net profit, however, fell 25.2% to $26,170 million, and net margin to 20.5% from 34.2%. The cause is not the business: other income and expense came in at -$8,221 million versus +$12,759 million a year earlier. Inside is an $8,664 million loss on equity securities, which cut net profit by $6.7 billion.
A year earlier, by contrast, a $10,734 million gain on securities inflated profit. Both quarters are distorted by the same factor with opposite signs, so net profit does not measure operating momentum. Diluted EPS was $2.12 versus $2.87 a year earlier.
Free cash flow turned negative at -$9,065 million on $51,355 million of capex
Operating cash flow for the quarter was $42,290 million – less than $48,414 million a year earlier, even though revenue grew a quarter. The gap is working capital: inventory rose $3,220 million, other assets $7,807 million.
Capex jumped to $51,355 million from $23,953 million a year earlier – more than double. As a result free cash flow for the quarter was -$9,065 million. Over the last twelve months it remains positive at $19,747 million, but a quarter earlier it was -$5,855 million, so the investment phase continues.
The company is building AI infrastructure, and that absorbs almost all of operating cash flow. As long as cloud revenue growth outruns the spending, the model is justified, but the free-cash-flow cushion is thin right now.
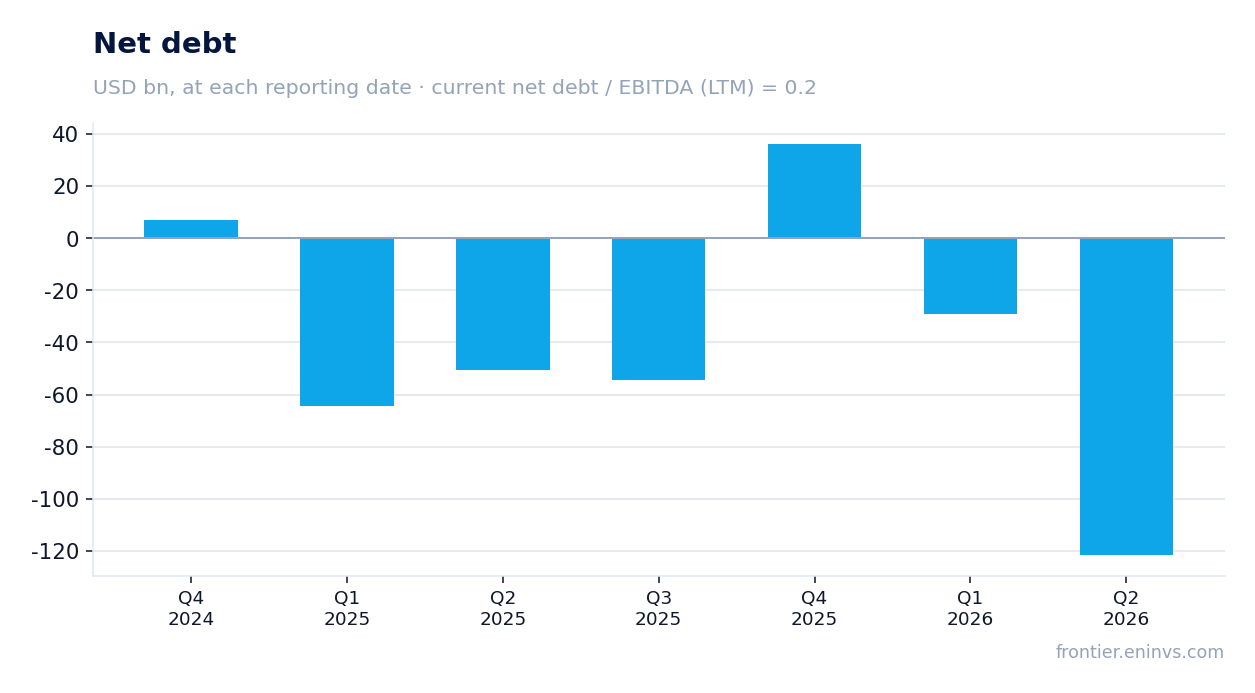
Debt rose to $125,102 million, while equity and bond issuance brought in $41.4 billion
Long-term debt at end-September was $125,102 million versus $46,547 million at end-2025. In the quarter the company issued $28.7 billion net of senior unsecured notes and raised $12.4 billion from Class A and C share sales. A further $19.1 billion came from preferred stock issuance.
The cash cushion also grew: cash and marketable securities reached $265,098 million versus $126,843 million at end-2025. Net debt to EBITDA LTM is 0.2, i.e. leverage is low. The direction of this ratio is not disclosed, so we state the level only.
Interest expense rose to $967 million from $143 million a year earlier – debt has started to cost money. Against $40,576 million of operating profit that is small, but debt and capex are rising at the same time.
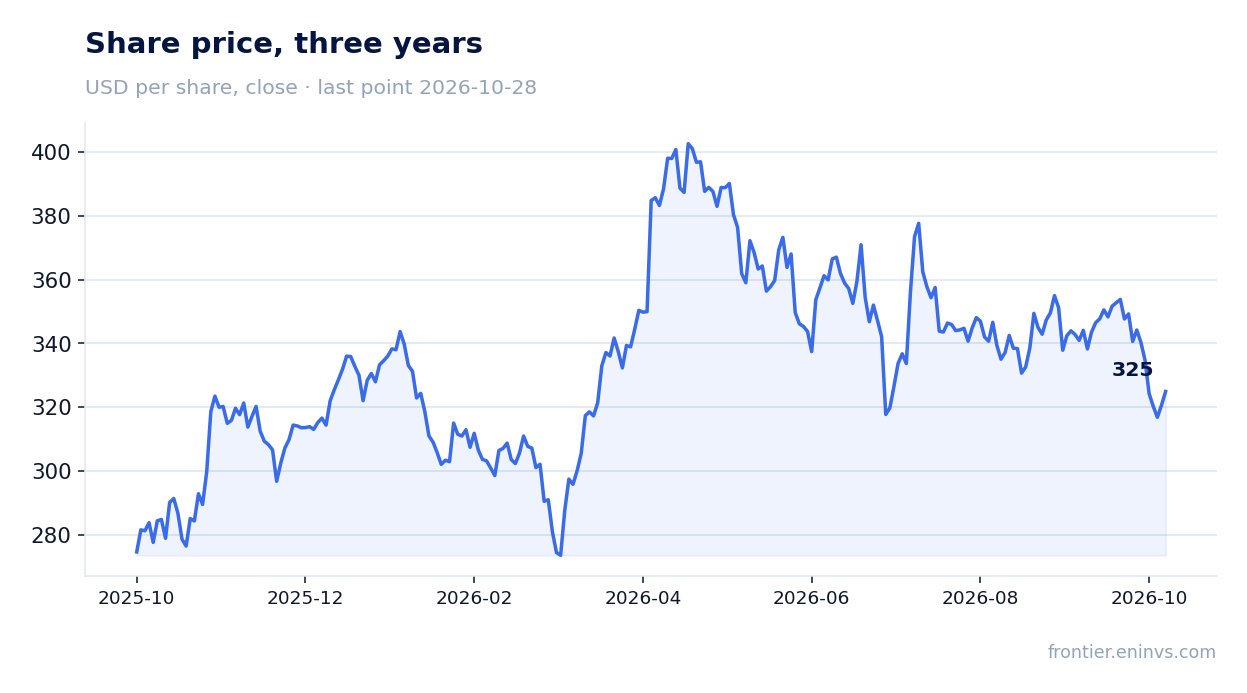
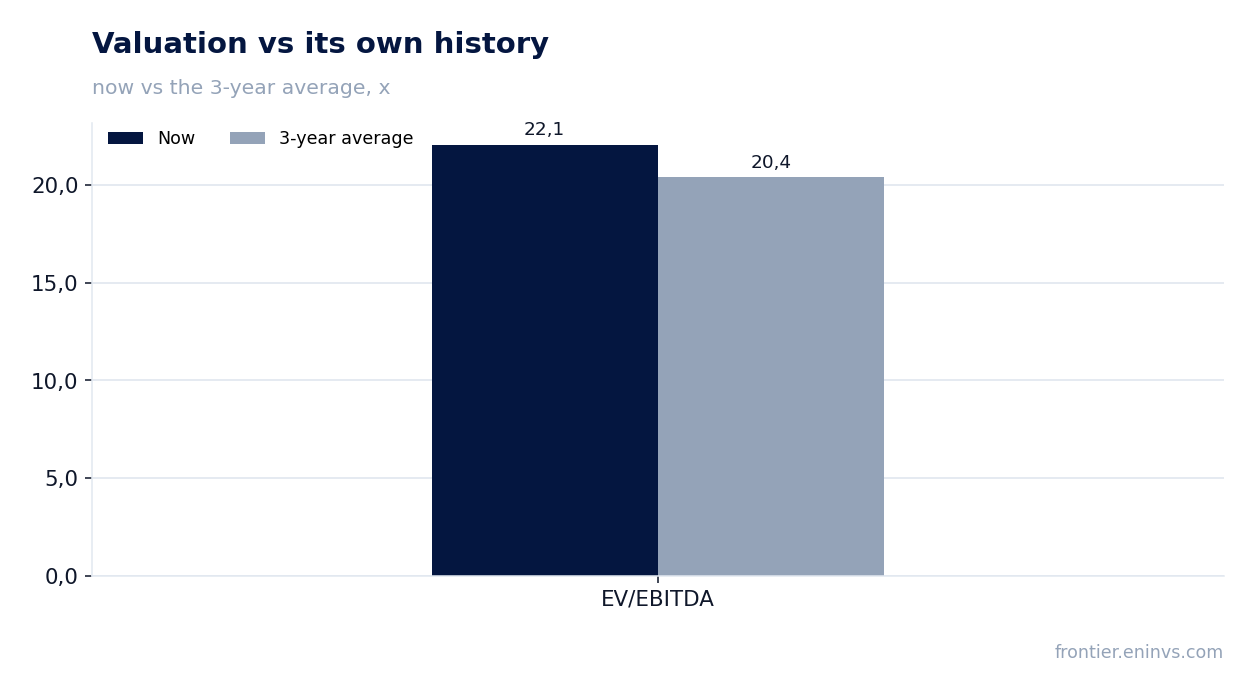
The stock trades at 22.1 EV/EBITDA LTM against its own three-year average of 20.4 – above its history
On EV/EBITDA LTM the stock trades at 22.1 – 8% above its own three-year average of 20.4. The market is paying more for Alphabet than it has over the past three years. P/E LTM is 16.7, lower than one might expect at this EV/EBITDA, but LTM profit is distorted by one-off investment markups.
The portal's model, which weighs EBITDA growth against the target multiple and market cap, puts upside to fair value at +20%. That is our own estimate, not a market consensus.
The share closed at $320.58 before the release, added 1.3% on the release day and has held that level since. The reaction was restrained: strong revenue and cloud are largely priced in, while the net profit decline keeps buyers cautious.
The $0.22 dividend yields just 0.26% – the payout is no argument for the share
The board declared a quarterly dividend of $0.22 per Class A, B and C share, payable on 14 December 2026. On Series A and B preferred stock the payout is $15.63 per share. Over the last twelve months the dividend yield was 0.26%.
At that yield the payout does not matter for total return: at $320.58 the annual dividend of about $0.88 is lost against quarterly price swings. The company channels the main cash flow into capex and buybacks, not dividends.
Our estimate for the current year's dividend is about $0.88 per share, based on the declared quarterly payment and assuming it is maintained. The risk of a cut is small, but so is the prospect of growth: the priority is AI infrastructure investment.
Valuation on the latest reported figures
| Metric | Value |
|---|---|
| Market cap | 3 936 bn USD |
| P/E (LTM) | 16.7 |
| EV/EBITDA (LTM) | 22.1 |
| P/B | 9.48 |
| Net debt / EBITDA (LTM) | 0.20 |
| Operating cash flow (LTM) | 180 bn |
| ROE | 15.9% |
| Dividend yield (12m) | 0.3% |
| EV/EBITDA, 3-year average | 20.4 |
Bottom line
The strong side of the report is revenue and cloud: growth of 24.7% and 103% respectively, a 31.8% operating margin and $40,576 million of operating profit. The weak side is net profit, down 25.2% on an $8,664 million one-off investment loss, and free cash flow, which turned negative at -$9,065 million on capex. Debt rose to $125,102 million, but leverage at 0.2 EBITDA LTM remains low. The stock trades at 22.1 EV/EBITDA LTM against its own three-year average of 20.4, i.e. above its history, and a 0.26% dividend yield does not change the picture. The verdict is rather attractive: business growth and the portal model's +20% upside outweigh the rich valuation, but confirmation requires a recovery in free cash flow.
Open the company's financial profile GOOGL →
See also: market overview · valuation map · stock screeners