Goldman Sachs: profit up 29%, but almost all of the growth came from one segment – equities

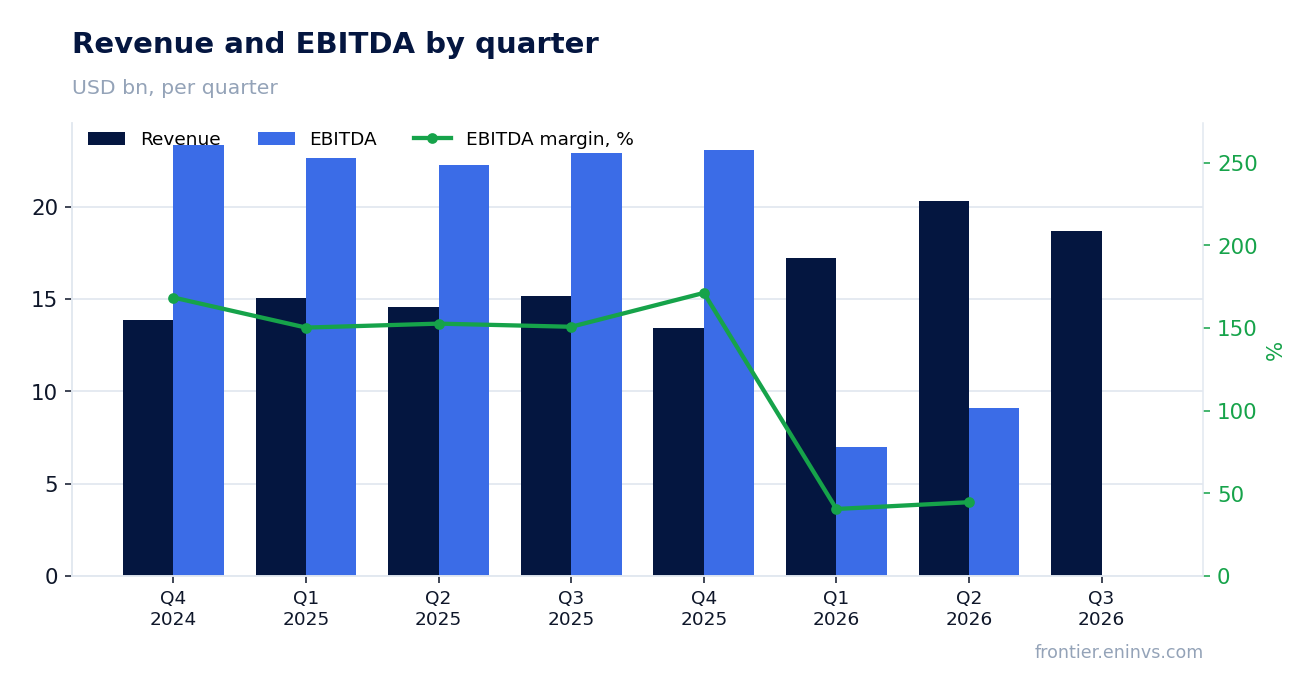
On October 13, Goldman Sachs reported third-quarter 2026 results. Revenue came in at $18.68 billion (+23.0% year on year), net earnings at $5.29 billion (+29.2%), and net margin rose from 27.0% to 28.3%. Growth was driven by equities trading and investment banking fees, while FICC was flat year on year and Platform Solutions fell 72%. The stock looks rather attractive: profit is growing faster than revenue, capital is being returned to shareholders, and multiples remain within historical ranges.
Key takeaways
— Revenue grew 23.0%, but almost all of the increase came from one segment – equities trading
— Net margin rose to 28.3% as profit grew faster than revenue
— Investment banking fees rose 21% on higher completed M&A volumes
— FICC was flat year on year: strength in currencies and commodities offset weakness in mortgages and credit
— Platform Solutions fell 72% due to markdowns on the Apple Card portfolio
— The firm returned $4.49 billion to shareholders, including $3.00 billion of buybacks
— Earnings per share rose to $17.01 from $12.25 a year earlier
Attractiveness
Key figures, USD bn
| Metric | Q3 2025 | Q3 2026 | Change |
|---|---|---|---|
| Revenue | 15.2 | 18.7 | +23.0% |
| EBITDA | 22.9 | — | — |
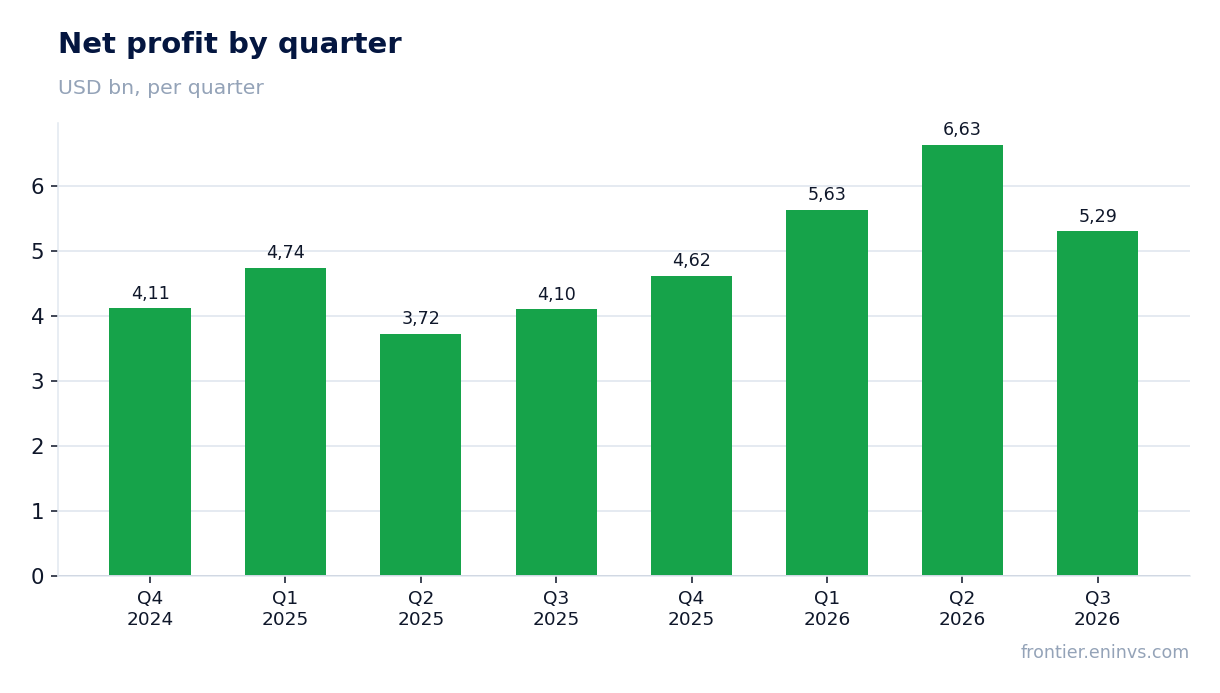
| Net profit | 4.10 | 5.29 | +29.2% |
| Operating cash flow | 2.68 | — | — |
| Capex | 0.56 | — | — |
| EBITDA margin | 150.8% | — | — |
| Net margin | 27.0% | 28.3% | +1.3 pp |
Revenue grew 23.0%, but almost all of the increase came from one segment – equities trading
Third-quarter 2026 revenue came in at $18.68 billion, up 23.0% year on year. However, growth was highly uneven: Global Banking & Markets rose 32% to $13.46 billion, while Asset & Wealth Management grew only 14% to $5.05 billion, and Platform Solutions collapsed 72% to $170 million.
The main driver was equities trading: Equities revenue jumped 72% year on year to $6.44 billion. This was driven by significantly higher revenues in equities financing (prime financing and portfolio financing) and in intermediation (primarily derivatives). By contrast, FICC was essentially flat at $3.47 billion, and investment banking fees rose 21% to $3.22 billion on advisory and equity underwriting strength.
The sustainability of this growth is questionable: excluding the exceptionally strong equities result, the overall picture is much more modest. In the next quarter, the market will watch whether the equities momentum persists and whether FICC can return to growth.
Net margin rose to 28.3% as profit grew faster than revenue
Net earnings for the reported quarter were $5.29 billion, up 29.2% year on year. This outpaced revenue growth of 23.0%, lifting the net margin from 27.0% to 28.3%.
The faster profit growth is explained by several factors. First, non-interest revenues rose 32% to $14.91 billion, with commissions and fees up 36% and market-making revenues up 46%. Second, the provision for credit losses was $368 million versus $339 million a year earlier, a modest change. Third, the effective tax rate for the nine months was 20.4%, but the quarterly rate may have been lower due to one-off effects.
Nevertheless, profit growth was partly supported by one-off factors: notably, other expenses rose 24%, driven by charitable contributions to Goldman Sachs Gives. Without this, profit could have been even higher. Overall, a 28.3% net margin is a strong result, but its sustainability depends on continued favourable market conditions.
Investment banking fees rose 21% on higher completed M&A volumes
Investment banking fees in Q3 2026 were $3.22 billion, up 21% year on year. Growth was mainly driven by advisory revenues, which reached $1.65 billion (+18% year on year), reflecting higher completed M&A volumes. Equity underwriting revenues also rose significantly to $666 million (+43%) on IPOs and secondary offerings.
Debt underwriting showed more modest growth of 15% to $904 million, driven by investment-grade activity. However, the investment banking fees backlog decreased compared with the end of Q2 2026 and slightly compared with the end of 2025. This may signal a slowdown in future activity.
Thus, current fee growth is supported by already completed deals, but the declining backlog poses a risk to revenue next quarter. Investors should watch the dynamics of new deal volumes.
FICC was flat year on year: strength in currencies and commodities offset weakness in mortgages and credit
FICC revenue in Q3 2026 was $3.47 billion, essentially flat year on year ($3.49 billion). Within the segment, dynamics were mixed: intermediation fell 7% due to significantly lower revenues in mortgages and credit products, as well as in interest rate products. This was partly offset by higher revenues in currencies and commodities.
FICC financing rose 14% to $1.21 billion on higher revenues in mortgages and structured lending. Overall, the result remained stable, but the mix shifted from intermediation to financing.
Amid market uncertainty, FICC remains vulnerable to changes in interest rates and credit spreads. Next quarter, investors will assess whether the segment can return to growth on the back of currencies and commodities.
Platform Solutions fell 72% due to markdowns on the Apple Card portfolio
Platform Solutions revenue in Q3 2026 was only $170 million, down 72% year on year ($598 million) and 23% quarter on quarter. The sharp decline was due to net markdowns on the Apple Card loan portfolio, which was transferred to held for sale in Q4 2025.
This segment had been problematic before, but its contribution to total revenue is now minimal. For comparison, in Q3 2025 Platform Solutions generated $598 million, about 4% of total revenue. Now its share has fallen to less than 1%.
The contraction of this business reduces diversification but also lowers risks associated with consumer lending. In the future, the company is likely to focus on more profitable segments.
The firm returned $4.49 billion to shareholders, including $3.00 billion of buybacks
In Q3 2026, Goldman Sachs returned $4.49 billion to shareholders, including $3.00 billion of buybacks (2.9 million shares at an average price of $1,048.73) and $1.49 billion of dividends. Additionally, the board declared a quarterly dividend of $5.00 per share, payable on December 30, 2026.
The firm also reported book value per common share rose to $372.64 (+1.4% for the quarter, +4.2% year to date). Annualised ROE was 18.7% for the quarter and 20.7% for the nine months. This supports a high level of capital return.
The $3.00 billion buyback represents about 2.7% of market capitalisation for the quarter, a significant support for shareholders. With growing profits and strong capital, the company is likely to continue returning capital.
Earnings per share rose to $17.01 from $12.25 a year earlier
Diluted earnings per share in Q3 2026 were $17.01, compared with $12.25 a year earlier, up 39%. This exceeds net earnings growth of 29.2%, explained by a reduction in shares outstanding due to buybacks. Average diluted shares fell to 301.1 million from 315.0 million a year earlier.
For the nine months of 2026, EPS was $55.56 versus $37.33 for the same period last year. This growth reflects both higher earnings and fewer shares.
EPS growth outpacing net earnings growth is a positive signal for shareholders. However, the buyback effect may slow in the future if the company does not maintain its current pace of repurchases.
Bottom line
Goldman Sachs delivered a strong quarter: revenue rose 23.0%, profit 29.2%, and margin reached 28.3%. However, growth was highly uneven – almost all of the increase came from equities trading, while FICC was flat and Platform Solutions contracted sharply. The firm is actively returning capital to shareholders, supporting EPS. The key question for a holder now is whether Goldman can sustain the equities momentum and revive other segments, or whether these results mark a cyclical peak. The stock looks rather attractive, albeit with the caveat of reliance on one segment.
Open the company's financial profile GS →
See also: market overview · valuation map · stock screeners