Host Hotels: RevPAR up 8.8% but net income halved as last year's asset-sale gain disappears

On 4 November Host Hotels & Resorts reported third-quarter 2026 results. Revenue was $1,347 million (+1.2% year on year), EBITDA $308 million (+3.7%), net income $70 million (-56.5%). Comparable RevPAR rose 8.8%, but total revenue barely moved because of disposed hotels, and profit fell as last year's large one-off asset-sale gain was absent. Net debt meanwhile jumped from -$1.9 billion to $4.2 billion during the quarter, sharply changing the balance-sheet picture. The share looks neutral: operating growth is solid, but leverage and the absence of a visible discount to its own history leave no edge for buyers.
Key takeaways
— Comparable RevPAR rose 8.8% – the room base earns materially more than total revenue suggests
— Total revenue added only 1.2% because disposed hotels absorbed almost all the operating growth
— Net income fell 56.5% as last year's one-off asset-sale gain was absent
— EBITDA margin edged up to 22.9%, but net margin compressed from 12.1% to 5.2%
— Net debt jumped from -$1.9 billion to $4.2 billion in the quarter – the balance sheet is no longer a source of cash
— The company raised full-year RevPAR guidance to 6.75% and bought two hotels for $374 million
— The $0.20 per-share dividend was paid, but with quarterly profit of $70 million coverage has thinned
Attractiveness
Key figures, USD bn
| Metric | Q3 2025 | Q3 2026 | Change |
|---|---|---|---|
| Revenue | 1.33 | 1.35 | +1.2% |
| EBITDA | 0.30 | 0.31 | +3.7% |
| Operating profit | 0.10 | 0.12 | +19.8% |
| Net profit | 0.16 | 0.07 | -56.5% |
| Operating cash flow | 0.22 | — | — |
| Capex | 0.00 | — | — |
| EBITDA margin | 22.3% | 22.9% | +0.6 pp |
| Net margin | 12.1% | 5.2% | -6.9 pp |
Comparable RevPAR rose 8.8% – the room base earns materially more than total revenue suggests
Comparable RevPAR in the third quarter was $219.50, up 8.8% on last year. The gain came from a 5.7% rise in average room rate and a 2.1 percentage-point increase in occupancy. Comparable Total RevPAR rose 7.3% to $348.19, helped by higher food and beverage revenue and leisure demand.
The improvement was broad: 11 of the 24 domestic markets posted double-digit Total RevPAR growth. The strongest were Austin (+51.8% RevPAR), Washington (+25.9%) and Florida Gulf Coast (+20.6%). The weak spot was Phoenix, where RevPAR fell 32.0% on low occupancy.
The company explicitly cites very strong transient demand boosted by the World Cup, plus growth in business transient and group bookings. An active hurricane season in Hawaii was a drag but did not offset the overall gain. It is the operating strength of the hotels, not total revenue, that shows the true state of the portfolio.
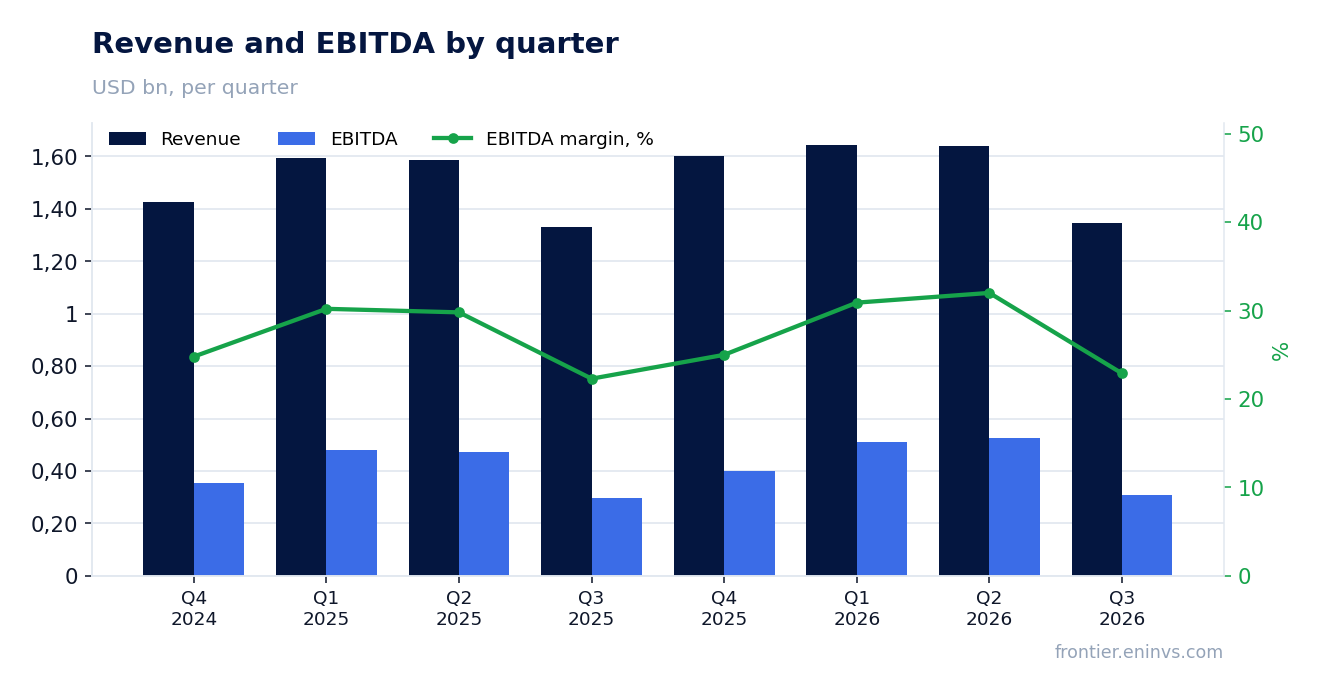
Total revenue added only 1.2% because disposed hotels absorbed almost all the operating growth
Total revenue for the quarter was $1,347 million against $1,331 million a year earlier – growth of just 1.2%. Comparable hotel revenue rose 7.4% to $1,312 million. The gap is explained by hotels sold in 2025 and 2026: they are excluded from the comparable base but were in total revenue a year ago.
The trend decelerated: revenue growth was 3.4% year on year in the prior quarter and 1.2% now. The slowdown reflects the base effect and disposals, not weakening demand. Comparable metrics are accelerating – the company raised full-year RevPAR guidance from 5.0% to 6.75%.
For the nine months revenue was $4,632 million, up 2.7% from $4,511 million. Comparable revenue rose 5.9% over the same period. The portfolio is performing better than the consolidated line suggests, which matters for assessing cash-flow durability.
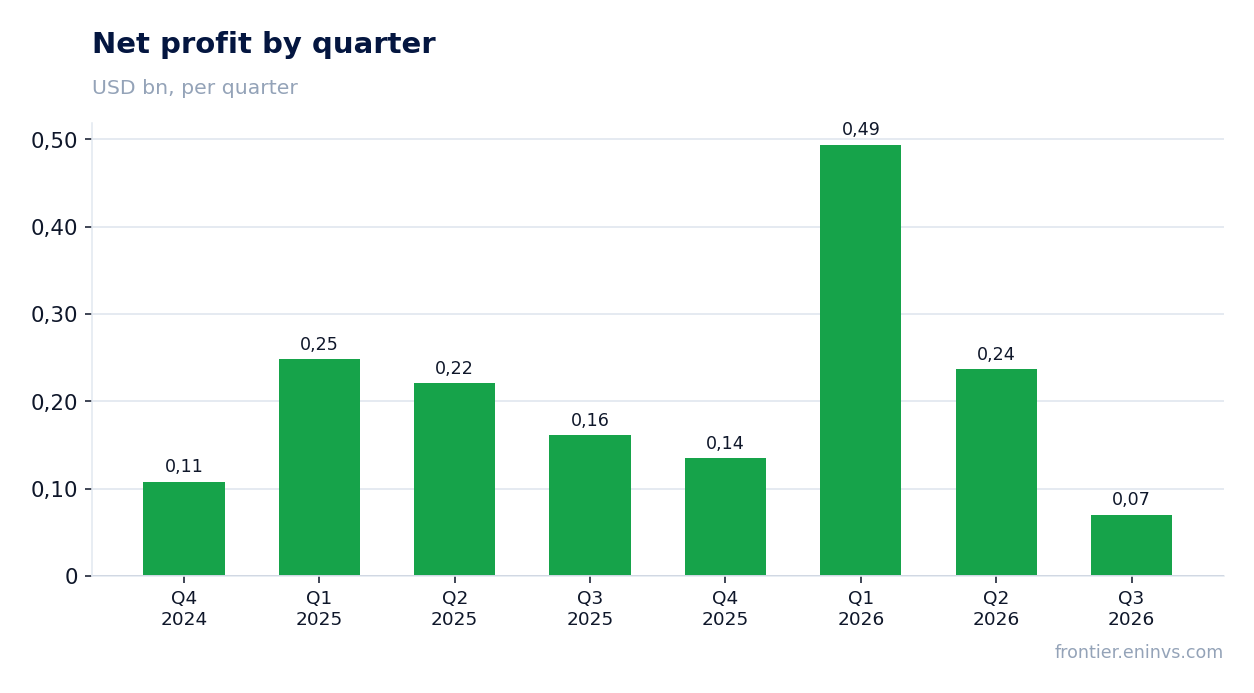
Net income fell 56.5% as last year's one-off asset-sale gain was absent
Net income for the quarter was $70 million against $161 million a year earlier – a 56.5% decline. The cause is not operations: a year ago there was a large one-off asset-sale gain booked in other income ($122 million), while this quarter has no such item – instead a $6 million loss.
Operating profit nevertheless rose from $101 million to $121 million, and operating margin improved from 7.6% to 9.0%. Higher room rates more than offset wage inflation. The business earns more; the profit decline is a base-effect accounting artefact.
For the nine months the picture reverses: net income rose 27.2% to $813 million, precisely because this year had its own asset sales. One-off items swing profit both ways, and the company cannot be judged on quarterly net income.
EBITDA margin edged up to 22.9%, but net margin compressed from 12.1% to 5.2%
EBITDA margin for the quarter was 22.9% against 22.3% a year earlier – a modest improvement. Comparable hotel EBITDA margin rose 90 basis points to 25.2%, as higher average rates more than offset wage inflation. This is an operating, not a one-off, result.
Net margin compressed from 12.1% to 5.2%. The cause is the same – the absence of the one-off sale gain that sat below operating profit a year ago. EBITDA margin and net margin diverge this quarter, and the former is the fairer gauge of operating efficiency.
Room expenses were almost flat ($225 million vs $222 million), food and beverage costs even fell ($273 million vs $278 million). Savings also came from other lines but were absorbed by interest and taxes. Operating efficiency is improving; financial burden is not.
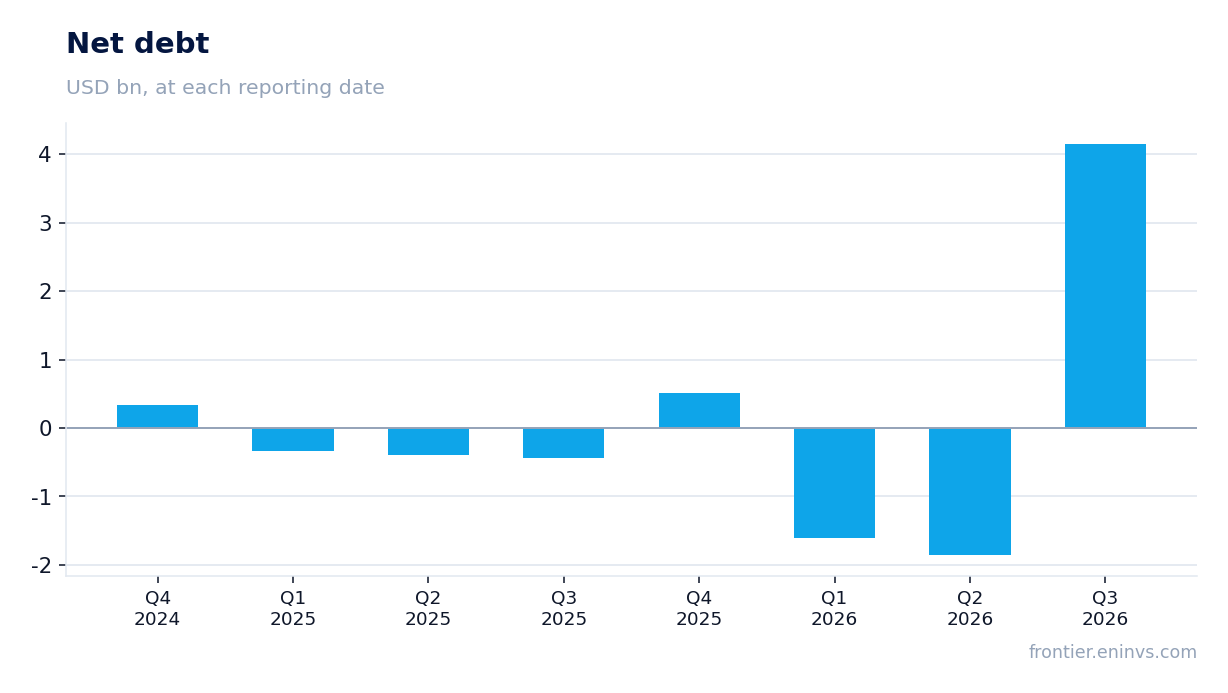
Net debt jumped from -$1.9 billion to $4.2 billion in the quarter – the balance sheet is no longer a source of cash
Net debt at 30 September 2026 was $4,153 million. At 30 June it was negative – minus $1.9 billion, meaning the company held more cash than debt. During the quarter the figure rose by $6.0 billion. Over twelve months, from 30 September 2025, net debt rose by $4.6 billion – from minus $0.4 billion to $4.2 billion.
The jump means the company spent its accumulated cash. After the reporting date it bought 1 Hotel Brooklyn Bridge for $202 million and Renaissance Dallas at Plano Legacy West for $172 million, and paid a quarterly dividend of $137 million. Adjusted cash after these transactions is estimated at $991 million.
Total debt is $5,084 million, of which $3,992 million is senior notes and $999 million is the credit facility. Weighted average maturity is 4.4 years, the rate 4.8%, with no significant maturities until December 2028. After the $2.5 billion facility was recast, maturity extended to 5.2 years. Liquidity is about $3.1 billion, including $1.5 billion available under the revolver.
The company raised full-year RevPAR guidance to 6.75% and bought two hotels for $374 million
Full-year 2026 comparable RevPAR guidance was raised to 6.75% from 5.0%, and Total RevPAR to 6.0% from 5.0%. Both are above the high end of the previous range. GAAP revenue guidance was lifted to $6,213 million, net income to $978 million, and Adjusted EBITDA re to $1,865 million.
October RevPAR grew about 6.5% year on year, so demand remains firm into the fourth quarter. Guidance includes $3 million of net income and $6 million of Adjusted EBITDA re from the two new hotels, plus $18 million from Florida condominium sales.
The two purchases – the 195-room 1 Hotel Brooklyn Bridge and the 308-room Renaissance Dallas at Plano Legacy West – expand presence in New York and establish the company in Dallas. Both are expected to be immediately accretive. These are growth investments, but they also explain where the balance-sheet cash went.
The $0.20 per-share dividend was paid, but with quarterly profit of $70 million coverage has thinned
The company paid a quarterly dividend of $0.20 per share on 15 October 2026 to holders of record on 30 September. The total payout was $137 million. This is the regular quarterly dividend, not a special one; all future payments, including any special dividends, require board approval.
With quarterly net income of $70 million, the $137 million payout is nearly twice profit. But a REIT dividend rests on operating cash flow and FFO, not net income. Adjusted FFO per share was $0.39, which covers the payout. At the current price the annualised yield is moderate in our view – it does not stand out against the policy rate.
The risk to the dividend is further debt growth and acquisition spending. If the company keeps funding purchases from the balance sheet, free cash will narrow. For now liquidity of $3.1 billion and no maturities until 2028 provide a cushion, but net debt rising to $4.2 billion signals that the cushion is not unlimited.
Bottom line
The strong side of the report is operating: comparable RevPAR rose 8.8%, EBITDA margin improved to 22.9%, and the company raised full-year guidance. The weak side is the balance sheet: net income fell 56.5% on the absence of last year's one-off gain, and net debt jumped from -$1.9 billion to $4.2 billion in the quarter. One-off items swing profit both ways, and the company cannot be judged on quarterly net income. The real question for a holder is not operating growth, which is there, but how quickly the company will restore its balance sheet after spending on acquisitions and dividends. Verdict: neutral – operating strength is present, but leverage and the absence of a discount to its own history leave no edge.
Open the company's financial profile HST →
See also: market overview · valuation map · stock screeners