HUBBELL INC: revenue up 24.6% but profit only 2.7% – growth is being eaten by margin

On 27 October HUBBELL INC reported results for the third quarter of 2026. Revenue came in at USD 1,872.5 million, up 24.6% year on year, operating profit at USD 408.7 million, and net profit at USD 262.5 million, only 2.7% above the level of a year earlier. Net margin compressed from 17.0% to 14.0%, and the market responded with a 5.5% drop in the share on the release day. With an EV/EBITDA multiple of 18.8, in line with its own three-year average, and the portal model's upside at -6%, the share looks neutral: revenue acceleration is there, but it does not reach profit.
Key takeaways
— Revenue grew 24.6% year on year, an acceleration from 15.3% in the second quarter
— Net profit added only 2.7% because margin compressed from 17.0% to 14.0%
— Operating profit rose to USD 408.7 million, but its growth lags revenue growth
— Operating cash flow of USD 323.0 million covers profit but does not offset the margin compression
— Leverage at 1.5x EBITDA LTM remains moderate
— The EV/EBITDA multiple of 18.8 is in line with its own three-year average of 18.6
— Dividend yield of 1.3% is modest and provides no support to the share
Attractiveness
Key figures, USD bn
| Metric | Q3 2025 | Q3 2026 | Change |
|---|---|---|---|
| Revenue | 1.50 | 1.87 | +24.6% |
| EBITDA | 0.38 | — | — |
| Operating profit | 0.33 | 0.41 | +23.6% |
| Net profit | 0.26 | 0.26 | +2.7% |
| Operating cash flow | 0.28 | 0.32 | +13.6% |
| Capex | 0.03 | — | — |
| EBITDA margin | 25.3% | — | — |
| Net margin | 17.0% | 14.0% | -3.0 pp |
Revenue grew 24.6% year on year, an acceleration from 15.3% in the second quarter
In the third quarter of 2026, HUBBELL INC's revenue reached USD 1,872.5 million, 24.6% above the level of the same quarter a year earlier. This is a marked acceleration from 15.3% in the second quarter of 2026 and from 4.1% in the third quarter of 2025.
The acceleration began in the fourth quarter of 2025, when growth was 11.9%, and continued in the first quarter of 2026 at 11.1%. The third quarter was therefore the fastest in terms of growth over recent periods.
Such revenue growth is a strong point of the report, but it does not translate into profit in the same proportion, as the margin dynamics show.
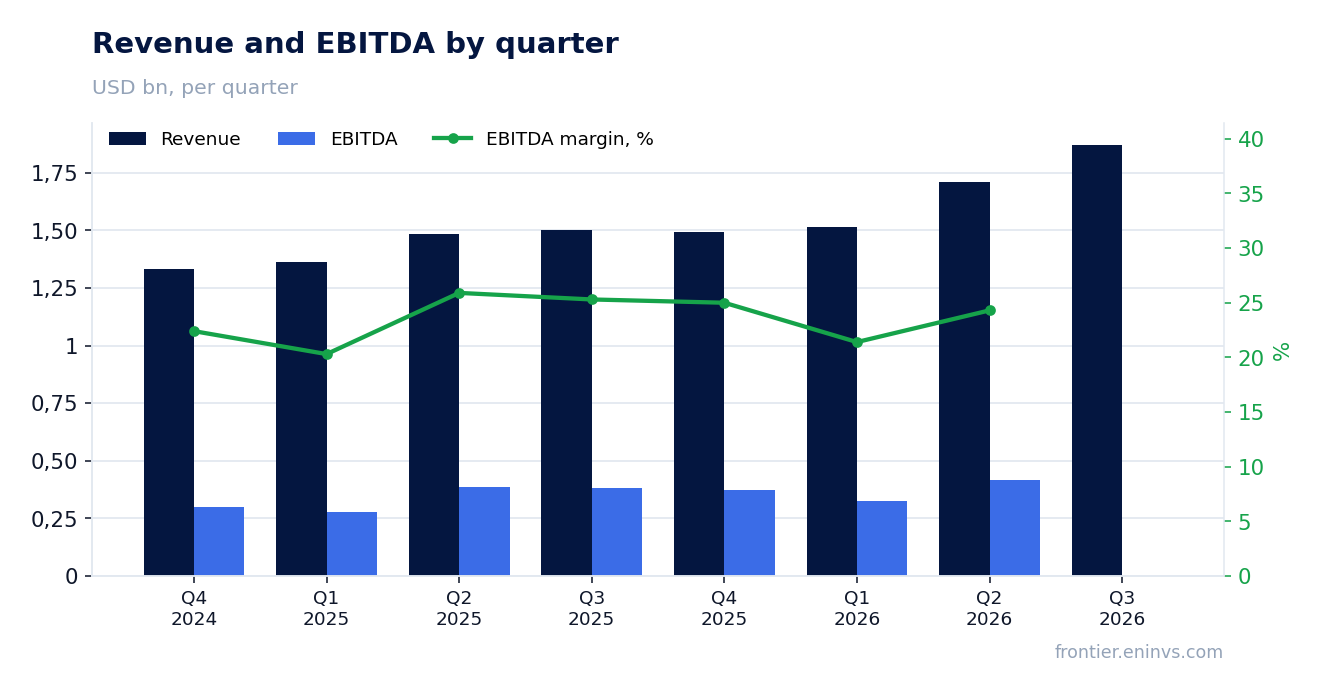
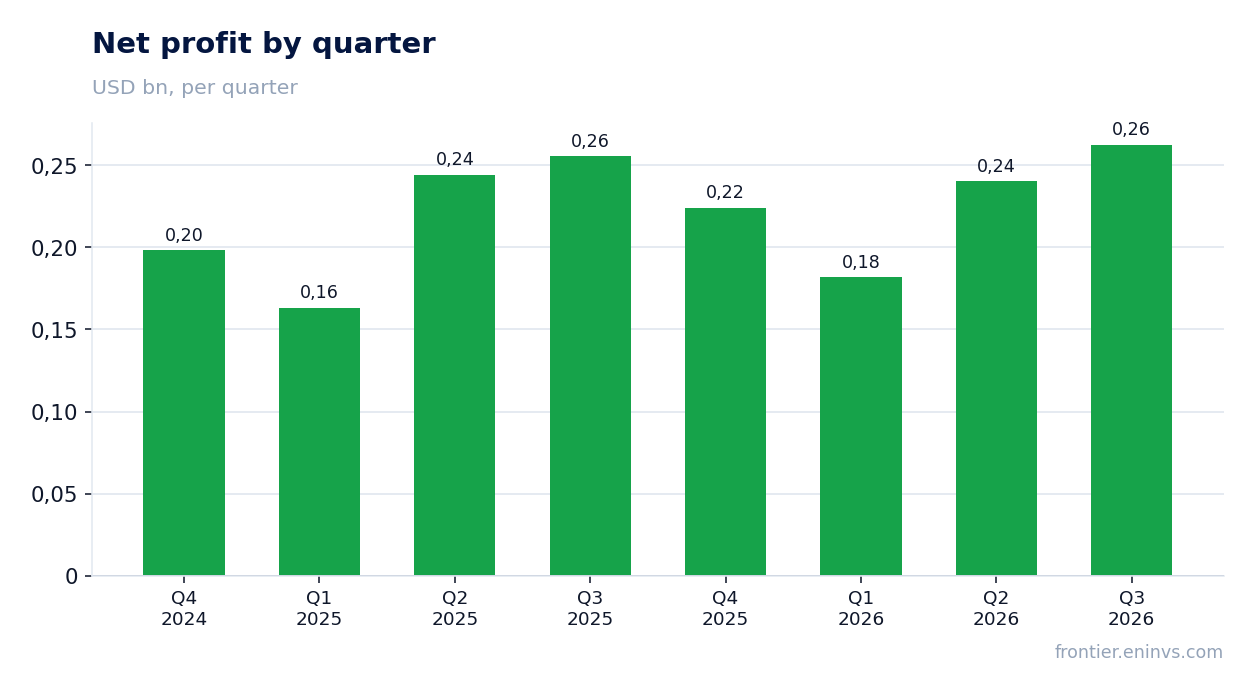
Net profit added only 2.7% because margin compressed from 17.0% to 14.0%
Net profit in the third quarter of 2026 was USD 262.5 million, only 2.7% above the level of a year earlier. With revenue growth of 24.6%, such profit dynamics mean that net margin compressed from 17.0% to 14.0%.
The 3 percentage point compression in margin meant that profit barely grew despite strong revenue growth. This is the key contradiction of the report: the company is scaling up, but earning less on each dollar of revenue than a year ago.
The reason for the margin compression is not disclosed in the facts, so we limit ourselves to stating it: revenue growth is not accompanied by proportional profit growth.
Operating profit rose to USD 408.7 million, but its growth lags revenue growth
Operating profit in the third quarter of 2026 was USD 408.7 million. This is above the level of the third quarter of 2025, when the figure was USD 330.6 million, but operating profit growth is noticeably slower than revenue growth.
Operating margin therefore also declined: with revenue of USD 1,872.5 million and operating profit of USD 408.7 million it is about 21.8%, whereas a year earlier with revenue of USD 1,502.4 million and profit of USD 330.6 million it was about 22.0%.
The decline in operating margin is less pronounced than in net margin, but it confirms the overall picture: costs are growing faster than revenue.
Operating cash flow of USD 323.0 million covers profit but does not offset the margin compression
Operating cash flow in the third quarter of 2026 was USD 323.0 million, above net profit of USD 262.5 million. This means the company converts profit into cash, and the quality of earnings remains acceptable.
For comparison, in the third quarter of 2025 operating cash flow was USD 284.3 million, implying growth of about 13.6%. This is slower than revenue growth but still positive.
Over the last twelve months operating cash flow was USD 1,020.3 million against net profit of USD 908.9 million, which also points to healthy conversion.
Leverage at 1.5x EBITDA LTM remains moderate
Net debt at the latest balance sheet date was USD 2,004.8 million, and the ratio of net debt to EBITDA over the last twelve months was 1.5. This is a moderate level of leverage.
EBITDA over the last twelve months was USD 1,334.5 million. Against such a base, debt of USD 2,004.8 million looks manageable.
The direction of change in the ratio is not disclosed in the facts, so we limit ourselves to stating the level: 1.5x EBITDA is not a leverage that creates risk by itself.
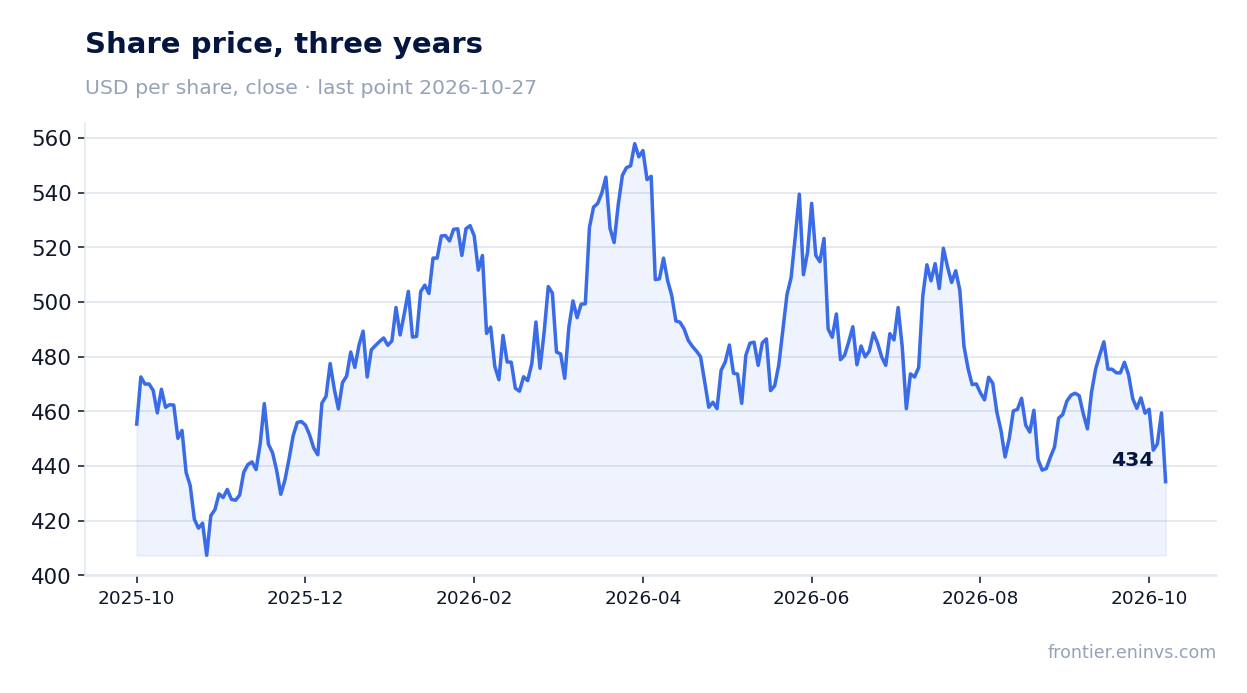
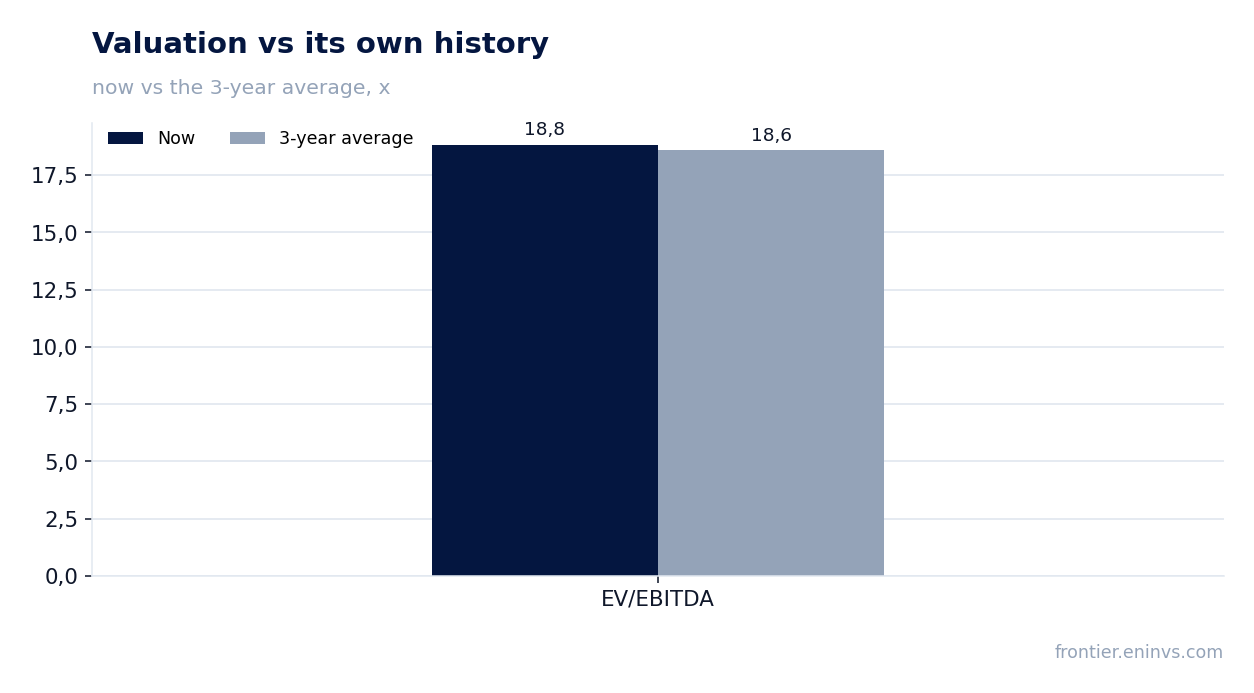
The EV/EBITDA multiple of 18.8 is in line with its own three-year average of 18.6
EV/EBITDA over the last twelve months is 18.8, almost exactly in line with its own three-year average of 18.6. The share is valued by the market the same way as on average over the last three years.
P/E over the last twelve months is 25.4. With net profit of USD 908.9 million and market capitalisation of USD 23,127.1 million, this corresponds to the current valuation.
On the portal's model, the upside of the share to fair value is estimated at -6%. This means the current price is somewhat above what our model, based on EBITDA growth and the target multiple, implies.
Dividend yield of 1.3% is modest and provides no support to the share
Dividend yield over the last twelve months is 1.3%. This is a low level that does not provide meaningful support for the share.
With net profit over the last twelve months of USD 908.9 million and market capitalisation of USD 23,127.1 million, dividend payments at a 1.3% yield correspond to about USD 302.7 million, or about 33% of profit. This is a moderate payout ratio.
Compared with the key rate: a yield of 1.3% is well below the risk-free rate, so the dividend is not an argument in favour of the share.
Valuation on the latest reported figures
| Metric | Value |
|---|---|
| Market cap | 23.1 bn USD |
| P/E (LTM) | 25.4 |
| EV/EBITDA (LTM) | 18.8 |
| P/B | 6.01 |
| Net debt / EBITDA (LTM) | 1.50 |
| Operating cash flow (LTM) | 1.02 bn |
| ROE | 8.7% |
| Dividend yield (12m) | 1.3% |
| EV/EBITDA, 3-year average | 18.6 |
Bottom line
The strong point of the report is the acceleration of revenue to 24.6% year on year, the fastest in recent periods. The weak point is profit: net profit grew only 2.7% because margin compressed from 17.0% to 14.0%. Operating cash flow of USD 323.0 million covers profit, and leverage at 1.5x EBITDA LTM remains moderate. The EV/EBITDA multiple of 18.8 is in line with its own three-year average, and the portal model's upside is -6%. The question for a holder now is whether the company can restore margin while maintaining revenue growth.
Open the company's financial profile HUBB →
See also: market overview · valuation map · stock screeners