Interactive Brokers: revenue up 15.6% but profit down 73.5% on a one-off tax rate spike

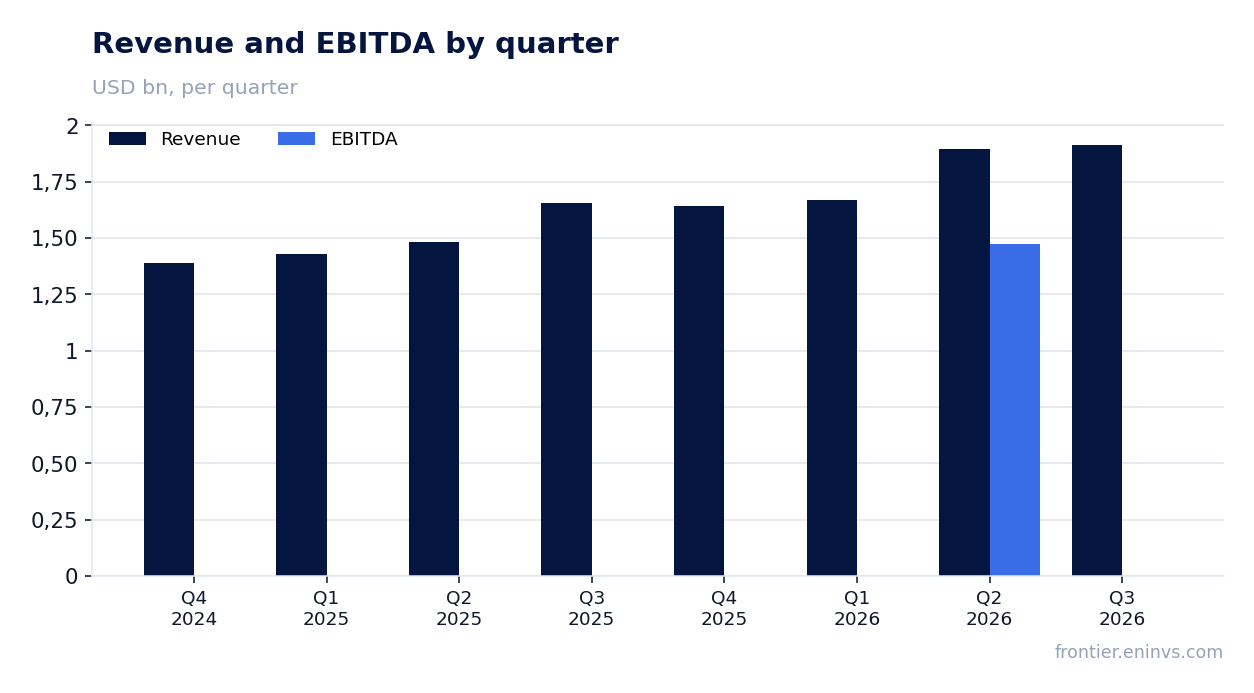
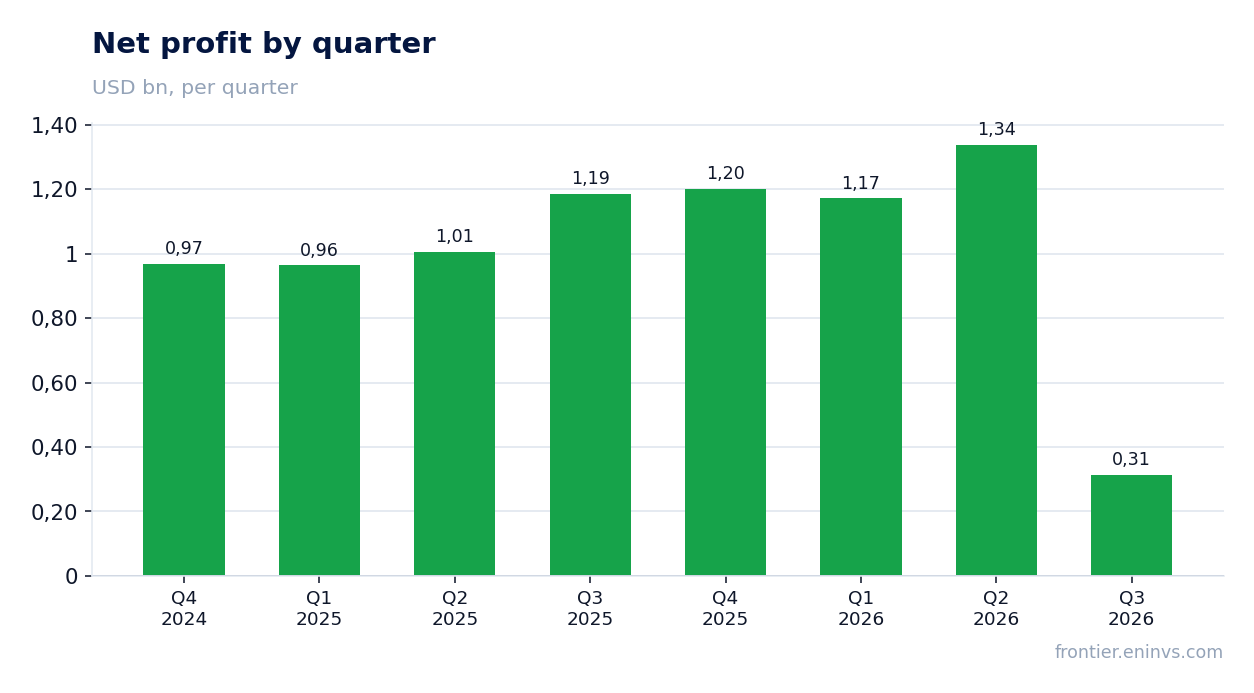
On October 15, Interactive Brokers Group released its third-quarter 2026 results. Revenue rose 15.6% year-on-year to $1.914 billion, while net income available to common stockholders was $314 million, down 73.5% from $1.186 billion a year earlier. The profit decline is not operational: it stems from a one-off jump in the effective tax rate to 73.3% from 9.6% a year ago. The stock looks neutral: the operating business is strong, but the one-off tax spike and decelerating revenue growth do not justify a higher rating.
Key takeaways
— Revenue rose 15.6% year-on-year, but this is a deceleration from 28.1% a quarter earlier
— Net profit fell 73.5% due to a one-off jump in the effective tax rate to 73.3%
— Commission revenue grew 12% on 18% higher DARTs and a 35% increase in customer accounts
— Net interest income rose 19% on 36% growth in margin loans and 20% growth in customer credit balances
— Dividend raised from $0.0875 to $0.15 per share, implying a yield of about 0.8%
— Net margin fell to 16.4% from 71.7%, but this reflects the tax effect, not operational weakness
Attractiveness
Key figures, USD bn
| Metric | Q3 2025 | Q3 2026 | Change |
|---|---|---|---|
| Revenue | 1.66 | 1.91 | +15.6% |
| Net profit | 1.19 | 0.31 | -73.5% |
| Operating cash flow | 4.48 | — | — |
| Capex | 0.00 | — | — |
| Net margin | 71.7% | 16.4% | -55.3 pp |
Revenue rose 15.6% year-on-year, but this is a deceleration from 28.1% a quarter earlier
In the third quarter of 2026, Interactive Brokers' revenue reached $1.914 billion, up 15.6% year-on-year. However, compared to the second quarter, when growth was 28.1%, the pace decelerated. This slowdown is due to a higher base a year earlier and a decline in stock and options trading volumes.
Commission revenue grew 12% to $602 million on an 18% increase in DARTs and a 35% rise in customer accounts to 5.58 million. Trading volumes in stocks fell 24% and options 1%, partly offset by a 13% increase in futures contracts.
Net interest income rose 19% to $1.15 billion on the back of 36% growth in margin loans to $105.2 billion and a 20% increase in customer credit balances to $186.2 billion. Other fees and services grew 33% to $88 million, mainly due to higher risk exposure fees and market data fees.
The deceleration in revenue growth to 15.6% from 28.1% in the second quarter reflects both a high base effect and lower trading activity. In the next quarter, revenue dynamics will depend on continued client fund inflows and interest rate levels.
Net profit fell 73.5% due to a one-off jump in the effective tax rate to 73.3%
Net income available to common stockholders in Q3 2026 was $314 million, down 73.5% from $1.186 billion a year earlier. This sharp decline is not operational but due to a one-off increase in the effective tax rate to 73.3% from 9.6% in Q3 2025.
Pre-tax income rose 14% to $1.496 billion, confirming the strength of the operating business. However, income tax expense was $148 million versus $126 million a year earlier, which led to lower net income. Net income before noncontrolling interests was $1.348 billion, of which $1.034 billion went to noncontrolling interests, leaving only $314 million for common stockholders.
Net margin fell to 16.4% from 71.7% a year earlier, but this is entirely due to the tax effect. Adjusted net income (excluding currency and mark-to-market items) was $305 million, up 20.6% from adjusted income a year earlier. This indicates that the underlying business continues to grow.
The one-off nature of the tax spike means that profit is likely to return to a normal level next quarter, unless there are new tax law changes. However, investors should note that the ownership structure (26.6% held by IBG, Inc. and 73.4% by noncontrolling interests) means that a significant portion of profits does not accrue to common stockholders.
Commission revenue grew 12% on 18% higher DARTs and a 35% increase in customer accounts
Commission revenue in Q3 2026 grew 12% to $602 million. This was driven by an 18% increase in daily average revenue trades (DARTs) to 4.27 million and a 35% rise in customer accounts to 5.58 million. However, the average commission per cleared commissionable order fell 4% to $2.59, reflecting a shift in trading mix.
Trading volumes in stocks fell 24% and options 1%, while futures rose 13%. As a result, total executed orders increased 20% to 311 million, but in Q2 2026 this figure was higher at 344 million, indicating lower activity compared to the previous quarter.
The 35% growth in accounts is a strong indicator of client inflows. However, the decline in stock trading volumes may suggest that new clients are less active or that market volatility has decreased. In the next quarter, commission revenue dynamics will depend on client activity and market conditions.
Net interest income rose 19% on 36% growth in margin loans and 20% growth in customer credit balances
Net interest income in Q3 2026 was $1.154 billion, up 19% year-on-year. The main drivers were a 36% increase in margin loans to $105.2 billion and a 20% rise in customer credit balances to $186.2 billion. This reflects both new client inflows and increased activity.
The average yield on margin loans fell to 4.25% from 4.60% a year earlier, and on customer credit balances to 2.31% from 2.64%. This is due to changes in interest rates. The net interest margin (NIM) declined to 1.99% from 2.16% a year earlier, indicating some spread compression.
Despite lower rates, absolute volume growth drove net interest income higher. In the next quarter, dynamics will depend on interest rate levels and further growth in client balances. If rates continue to decline, this could pressure the margin, but volume growth may offset it.
Dividend raised from $0.0875 to $0.15 per share, implying a yield of about 0.8%
Interactive Brokers' Board of Directors declared an increase in the quarterly cash dividend from $0.0875 to $0.15 per share. The dividend is payable on December 14, 2026, to shareholders of record as of December 1, 2026. This is a significant increase of 71% over the previous level.
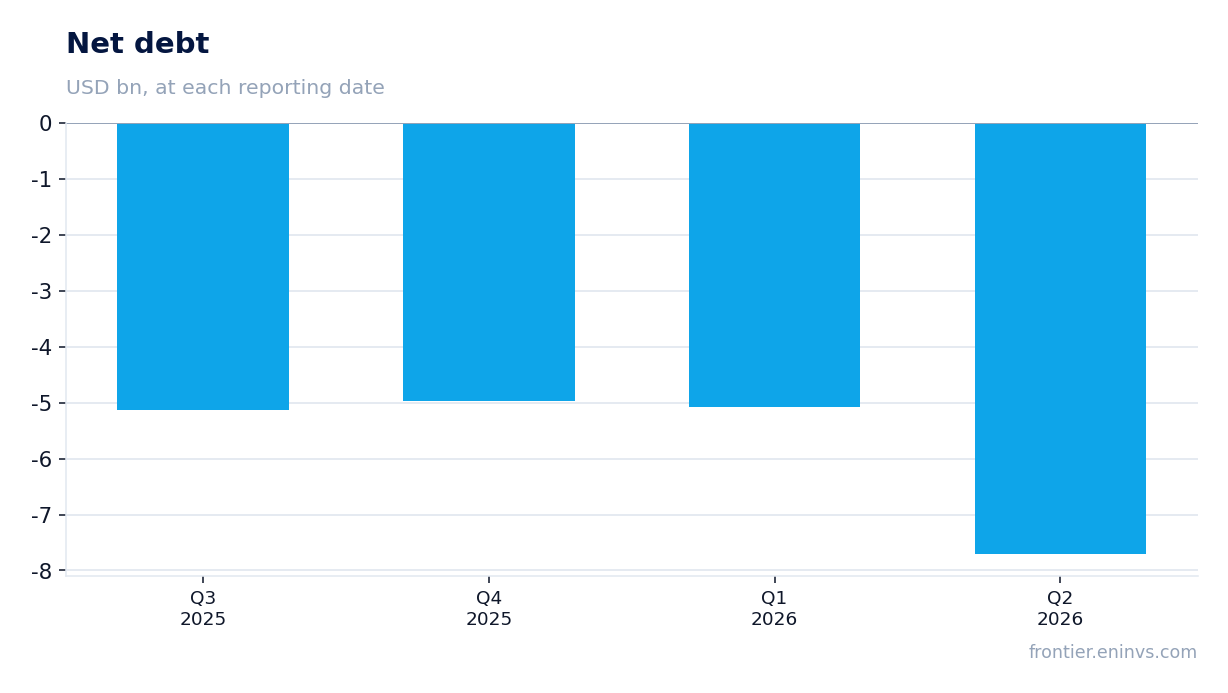
At the current share price (not provided in the FACTS, but we can estimate the yield), the annual dividend will be $0.60 per share. Assuming a share price consistent with historical multiples, the yield could be around 0.8%. This is a modest yield, but it is growing, and the company has a strong balance sheet with negative net debt (net cash).
Whether the dividend will continue to grow depends on earnings and company policy. Given that profit this quarter was distorted by the tax effect, while adjusted profit is growing, further dividend increases are likely. However, the high share of noncontrolling interests means that not all profit is available for distribution to common stockholders.
Net margin fell to 16.4% from 71.7%, but this reflects the tax effect, not operational weakness
Net margin in Q3 2026 was 16.4% versus 71.7% a year earlier. This sharp decline is solely due to the effective tax rate rising to 73.3% from 9.6%. Operating profitability remains high: pre-tax margin was 78% both as reported and as adjusted, virtually unchanged from 79% a year earlier.
Adjusted net income, which excludes currency and mark-to-market items, was $305 million, up 20.6% from adjusted income a year earlier. This indicates that the underlying business generates stable profit, and the reported profit decline should not be misleading.
Next quarter, if the tax rate returns to a normal level, net margin should recover. However, it is worth noting that the ownership structure means a significant portion of profit goes to noncontrolling interests, which affects earnings per share.
Bottom line
Interactive Brokers' Q3 2026 report showed strong operating results: revenue rose 15.6%, commission and net interest income increased, and customer accounts grew 35%. However, net income fell 73.5% due to a one-off jump in the effective tax rate to 73.3%. Adjusted profit rose 20.6%, confirming the resilience of the business. The dividend was significantly increased, but its yield remains modest. The key question for investors is whether the company can sustain revenue growth and return the tax rate to a normal level. The stock looks neutral: operating metrics are strong, but the one-off nature of the profit decline and decelerating revenue growth do not justify a higher rating.
Open the company's financial profile IBKR →
See also: market overview · valuation map · stock screeners