ICHOR HOLDINGS, LTD.: profit turns positive for the first time in two years, but the cash has not followed yet

On 2 November ICHOR HOLDINGS, LTD. released its results for the third quarter of 2026. Revenue reached $328.7 million, up 37.4% year on year, operating profit came to $22.8 million and net profit to $20.9 million at a 6.4% margin against minus 9.6% a year earlier. Operating cash flow for the quarter was negative, however, at minus $28.8 million. The share fell 5.3% after the release, and with an LTM EV/EBITDA of 137.2 the equity looks expensive; the verdict is neutral.
Key takeaways
— Revenue grew 37.4% year on year, accelerating from 22.7% a quarter earlier
— Operating profit of $22.8 million arrived after five loss-making quarters in a row
— Net profit of $20.9 million produced a 6.4% margin against minus 9.6% a year earlier
— Operating cash flow for the quarter was negative at minus $28.8 million against $20.9 million of profit
— Leverage of 6.52x LTM EBITDA is a level, not a trend
— A valuation of 137.2x LTM EV/EBITDA and 354.0x LTM P/E leaves no room for error
— The portal's model implies +11% upside to fair value
Attractiveness
Key figures, USD bn
| Metric | Q3 2025 | Q3 2026 | Change |
|---|---|---|---|
| Revenue | 0.24 | 0.33 | +37.4% |
| EBITDA | -0.01 | — | — |
| Operating profit | -0.02 | 0.02 | to profit |
| Net profit | -0.02 | 0.02 | to profit |
| Operating cash flow | 0.01 | -0.03 | -411.7% |
| Capex | 0.01 | — | — |
| EBITDA margin | -5.0% | — | — |
| Net margin | -9.6% | 6.4% | +16.0 pp |
Revenue grew 37.4% year on year, accelerating from 22.7% a quarter earlier
Revenue for the third quarter of 2026 came to $328.7 million, up 37.4% year on year. Growth was 22.7% in the second quarter, so the acceleration is clear: quarter on quarter revenue rose from $294.8 million to $328.7 million.
This is the highest quarterly figure in the data available: the previous peak was $294.8 million in the second quarter of 2026. Growth has now run for three quarters in a row after a weak end to 2025, when revenue fell 4.2%.
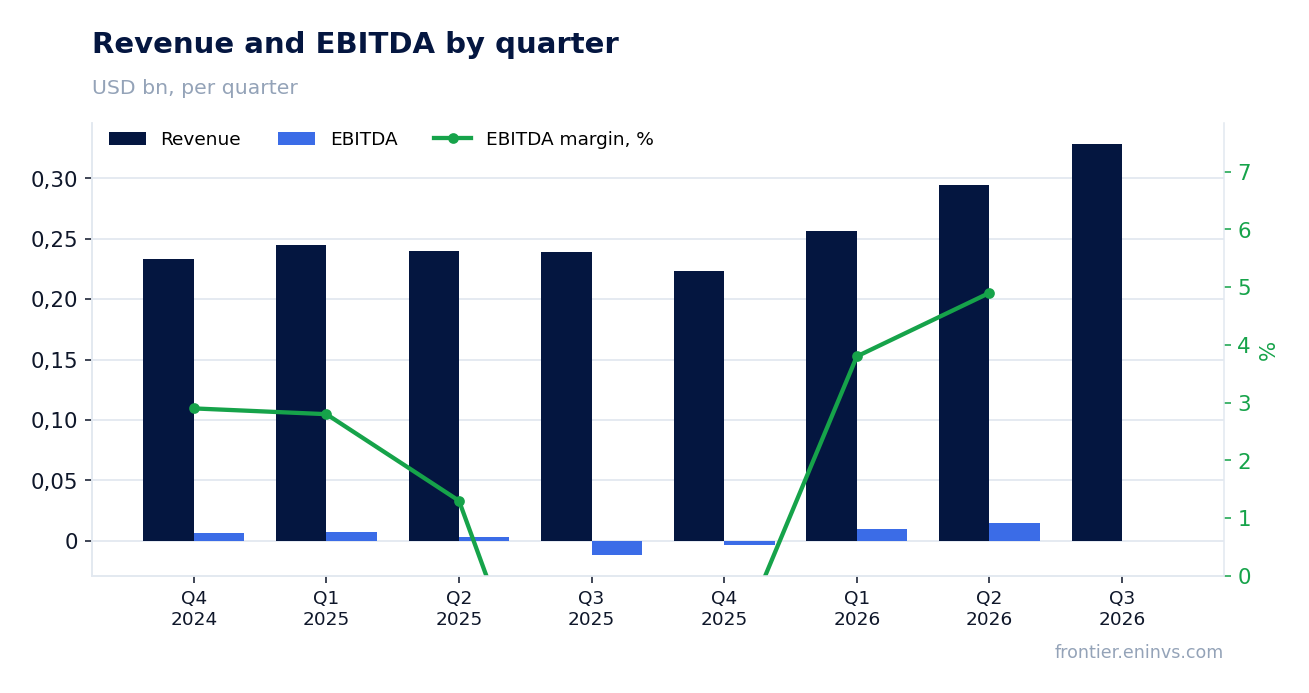
Operating profit of $22.8 million arrived after five loss-making quarters in a row
Operating profit for the quarter was $22.8 million against a loss of $19.4 million a year earlier. Before this the company had reported an operating loss for five quarters in a row, from the fourth quarter of 2024 through the fourth quarter of 2025.
The turn was already visible in the first quarter of 2026, when operating profit was $2.1 million, rising to $7.2 million in the second and $22.8 million in the third. On revenue of $328.7 million that is an operating margin of about 7%, positive for the first time in a long while.
Profit grew faster than revenue: the year-on-year revenue increase was $89.4 million, while the operating result improved by $42.2 million. Volume growth is therefore flowing through the cost base with a positive scale effect.
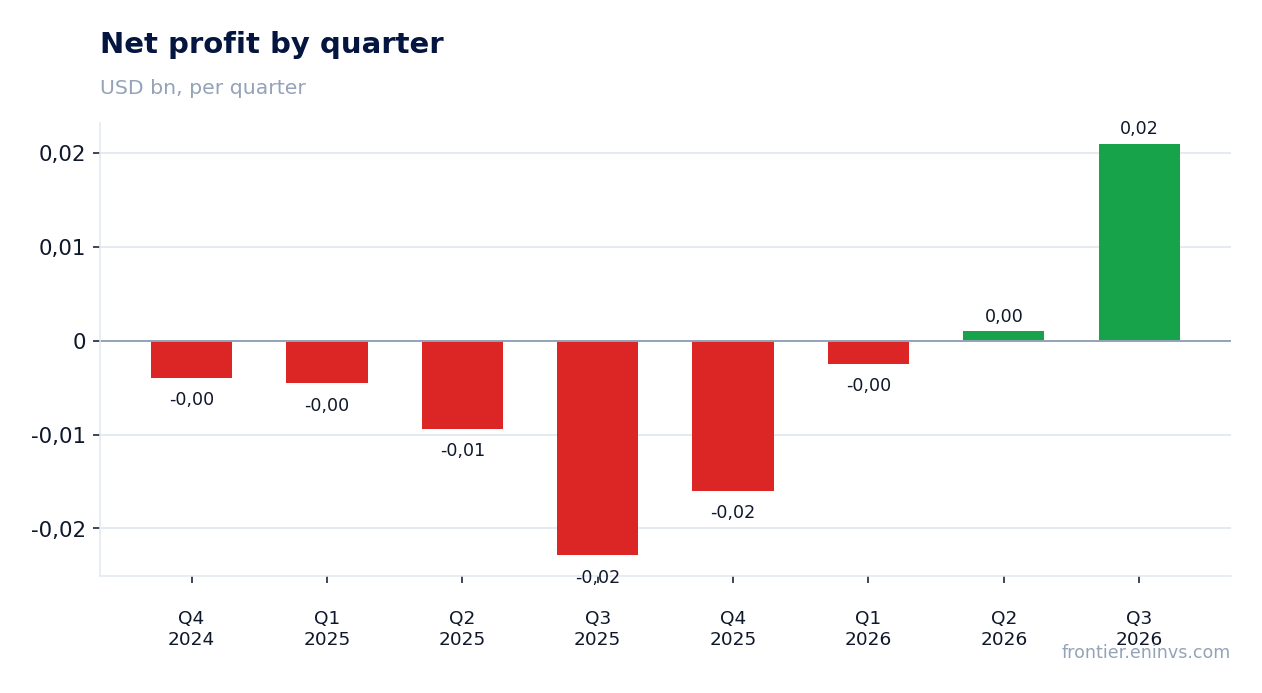
Net profit of $20.9 million produced a 6.4% margin against minus 9.6% a year earlier
Net profit for the third quarter of 2026 was $20.9 million, a 6.4% margin. A year earlier there was a loss of $22.9 million and a margin of minus 9.6%.
Net profit is close to operating profit – $20.9 million against $22.8 million – so only about $1.9 million was lost below the operating line. That is little for a company of this revenue size, and means interest and other charges did not eat into the quarter's result.
Over the last twelve months, however, net profit is only $3.5 million, because the loss-making quarters at the end of 2025 are included. The quarterly result has not yet offset the accumulated losses of earlier periods.
Operating cash flow for the quarter was negative at minus $28.8 million against $20.9 million of profit
Operating cash flow for the third quarter was minus $28.8 million against net profit of $20.9 million. The gap between profit and cash is about $49.7 million, and it sits in working capital: with revenue growing fast, inventories and receivables grow too.
This is not a one-off: cash flow was also negative in the second quarter at minus $15.9 million and in the first at minus $2.9 million. Over the last twelve months operating cash flow is minus $38.4 million.
Negative cash flow alongside positive profit is the main question raised by the report. While revenue growth is financed from the balance sheet rather than from own inflows, the quality of the profit remains in doubt.
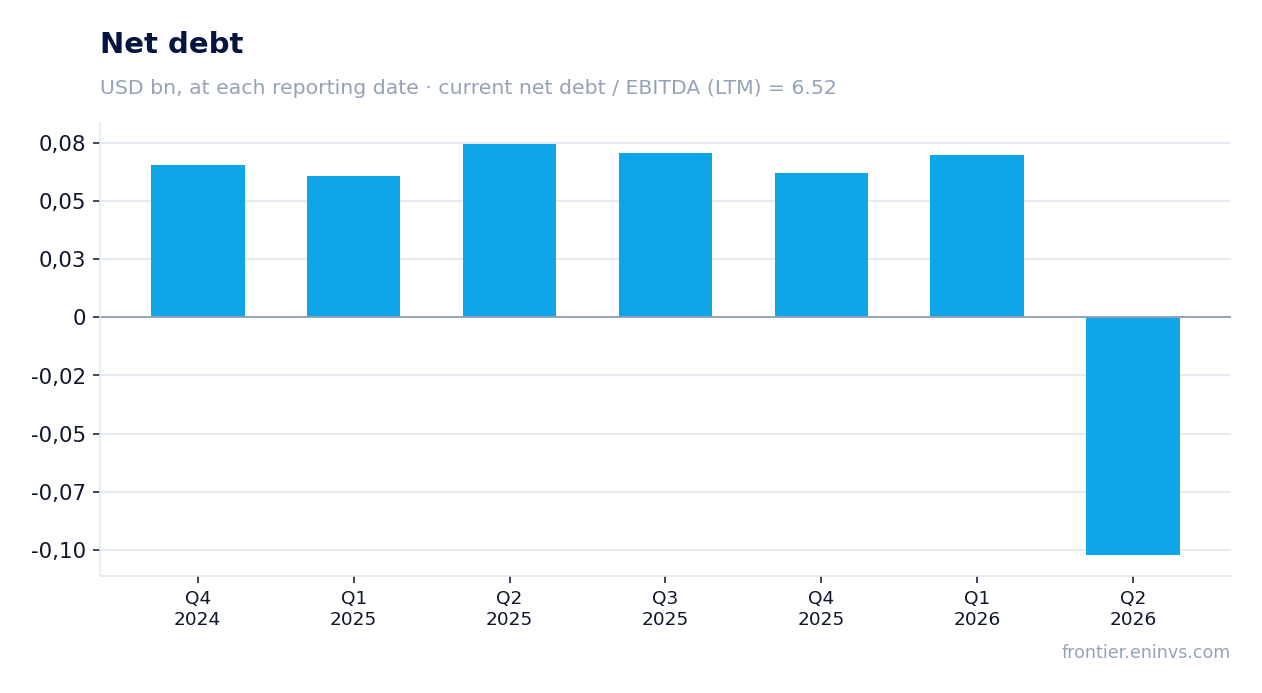
Leverage of 6.52x LTM EBITDA is a level, not a trend
Net debt at the latest annual balance-sheet date was $61.9 million, equal to 6.52x LTM EBITDA. The ratio is high: almost seven times annual EBITDA.
LTM EBITDA itself is $9.5 million, low precisely because it includes the loss-making quarters at the end of 2025. As operating profit turns positive the EBITDA base will grow, but at the reporting date leverage is measured off a low base.
Interest on that debt – about $1.9 million below the operating line in the quarter – looks moderate, but with negative operating cash flow debt service relies on external financing.
A valuation of 137.2x LTM EV/EBITDA and 354.0x LTM P/E leaves no room for error
LTM EV/EBITDA is 137.2x and LTM P/E is 354.0x. The multiples look extreme but are explained by a low base: both EBITDA and profit over twelve months are distorted by the losses at the end of 2025.
Market capitalisation is $1,244.5 million, and it reflects not current profit but the expectation of a durable positive margin. If the quarterly profit of $20.9 million becomes the norm, the annual result would be about $84 million and P/E would fall to roughly 15 – but only if the quarter repeats.
Return on equity is 9.6%, modest for such a valuation. The multiples leave no room for error: any slowdown in growth or return to losses would again make the valuation unjustified.
The portal's model implies +11% upside to fair value
On the portal's model, which sets EBITDA growth against a target multiple and market capitalisation, the upside of the share to fair value is +11%. This is our own estimate, not a market consensus and not a target price.
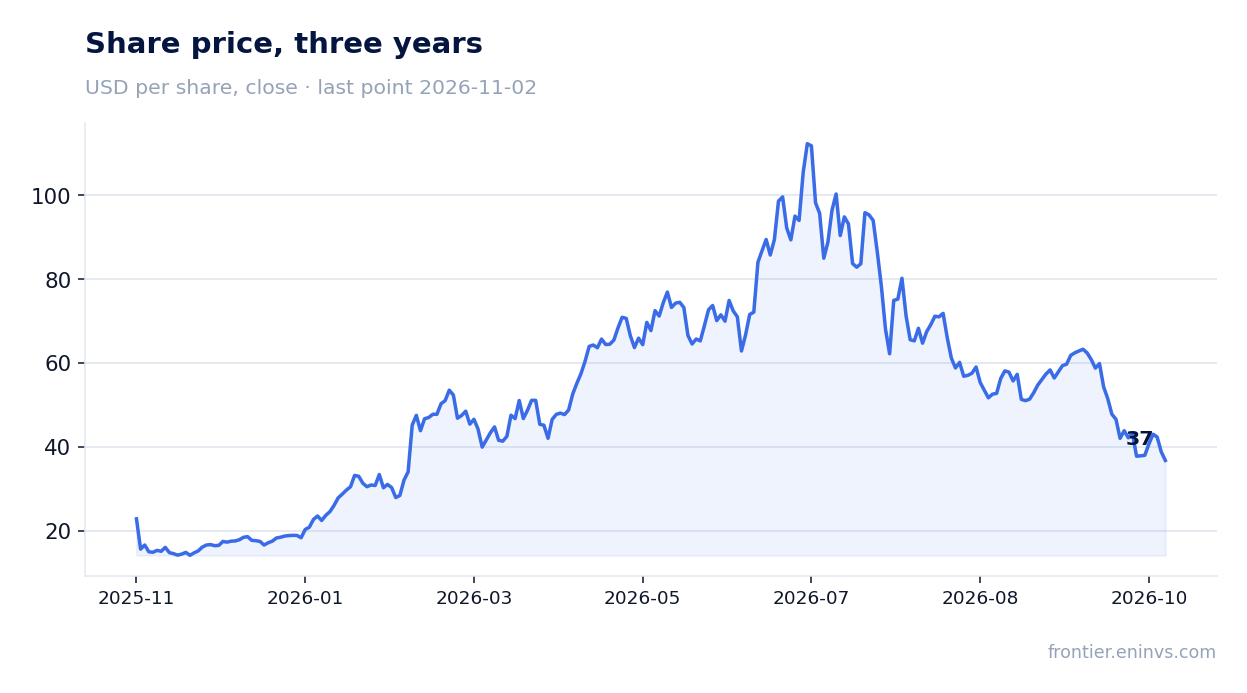
The market reacted to the report with a decline: the share lost 5.3% on the publication day and the same from the release to 2 November. The closing price before the release was $38.9.
Upside of 11% is modest and rests on the assumption that the quarterly profit is sustainable. If operating cash flow stays negative, the model will have to be revised down.
Valuation on the latest reported figures
| Metric | Value |
|---|---|
| Market cap | 1.24 bn USD |
| P/E (LTM) | 354.0 |
| EV/EBITDA (LTM) | 137.2 |
| P/B | 1.87 |
| Net debt / EBITDA (LTM) | 6.52 |
| Operating cash flow (LTM) | -0.04 bn |
| ROE | 9.6% |
Bottom line
What was strong in the report was everything above the cash line: revenue grew 37.4%, operating profit of $22.8 million arrived after five loss-making quarters, and net profit of $20.9 million produced a 6.4% margin. But the profit did not turn into cash – operating flow was minus $28.8 million, and over twelve months it is negative too. A valuation of 137.2x LTM EV/EBITDA and 354.0x LTM P/E rests on a low base and leaves no room for error. The verdict is neutral: the turn in profit is real but not yet confirmed by cash flow, and the price already discounts a lot.
Open the company's financial profile ICHR →
See also: market overview · valuation map · stock screeners