INTEL CORP: revenue up 20.9% but net profit down 18.3% – growth rests on a single segment

On 29 October INTEL CORP released its third-quarter 2026 results. Revenue came in at $16,513 million, up 20.9% year-over-year, operating profit reached $2,522 million versus $683 million a year earlier, while net profit fell 18.3% to $3,320 million. Revenue growth was driven by the Data Center and AI segment, while the client segment contracted and prior-year profit was inflated by a one-off gain. With an EV/EBITDA LTM of 40.2 and a -29% upside on the portal's model, the share looks rather unattractive at the current level.
Key takeaways
— Revenue grew 20.9%, but all the growth came from one segment – Data Center and AI
— The client segment contracted 5%, which limits the sustainability of overall growth
— Net profit fell 18.3% due to a one-off effect in the prior year, not because of deteriorating operations
— Operating margin rose from 5.0% to 15.3% on higher gross margin
— Free cash flow remains positive, but capital expenditure is rising
— Leverage at 2.64x EBITDA LTM is moderate, but the EV/EBITDA multiple of 40.2 looks high
— Q4 guidance implies revenue deceleration to $15.0–16.0 billion
Attractiveness
Key figures, USD bn
| Metric | Q3 2025 | Q3 2026 | Change |
|---|---|---|---|
| Revenue | 13.7 | 16.5 | +20.9% |
| EBITDA | 3.67 | — | — |
| Operating profit | 0.68 | 2.52 | +269.3% |
| Net profit | 4.06 | 3.32 | -18.3% |
| Operating cash flow | 2.55 | 5.10 | +100.3% |
| Capex | 2.42 | — | — |
| EBITDA margin | 26.9% | — | — |
| Net margin | 29.8% | 20.1% | -9.7 pp |
Revenue grew 20.9%, but all the growth came from one segment – Data Center and AI
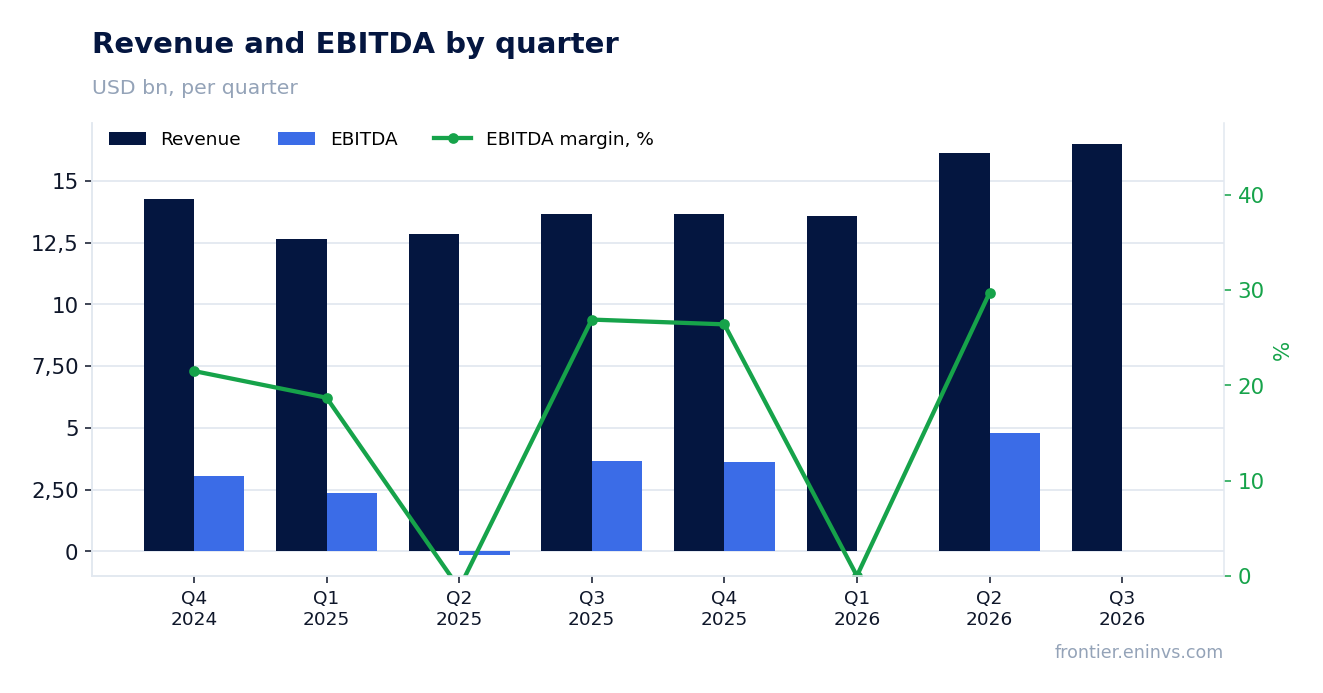
Revenue in Q3 2026 was $16,513 million, up 20.9% from Q3 2025. However, growth was highly uneven: the Data Center and AI segment grew 78% to $7,318 million, while the client segment CCPG contracted 5% to $8,097 million. Thus, all the growth came from one segment while the other dragged.
The Intel Foundry segment grew 58% to $6,697 million but remains loss-making at the operating level: the loss was $1,853 million versus $2,321 million a year earlier. The narrowing loss is a positive signal, but breakeven is still far off. The All Other segment fell 30% to $692 million, reflecting the deconsolidation of Altera after the sale of 51% of its shares in September 2025.
Revenue growth decelerated from 25.4% in Q2 2026. The slowdown to 20.9% reflects both a high base and the onset of a PC market downturn that the CFO warned about. The company expects the PC slowdown to continue at least through the first half of next year.
The client segment contracted 5%, which limits the sustainability of overall growth
Revenue of the client segment CCPG fell 5% to $8,097 million. This is the company's largest segment by revenue, and its contraction means overall growth rests on a single direction – server processors. Segment operating profit fell to $2,285 million from $2,694 million a year earlier.
CFO David Zinsner explicitly pointed to the PC market slowdown continuing at least through the first half of next year. This creates a risk that the client segment will continue to weigh on overall revenue, and all growth will depend on the sustainability of Xeon demand. CEO Lip-Bu Tan noted that CPU demand remains robust and the priority is to expand Xeon supply.
The 5% contraction in the client segment against 20.9% overall growth means that without the Data Center and AI contribution, company revenue would likely have declined. This makes overall growth less sustainable and more dependent on a single driver.
Net profit fell 18.3% due to a one-off effect in the prior year, not because of deteriorating operations
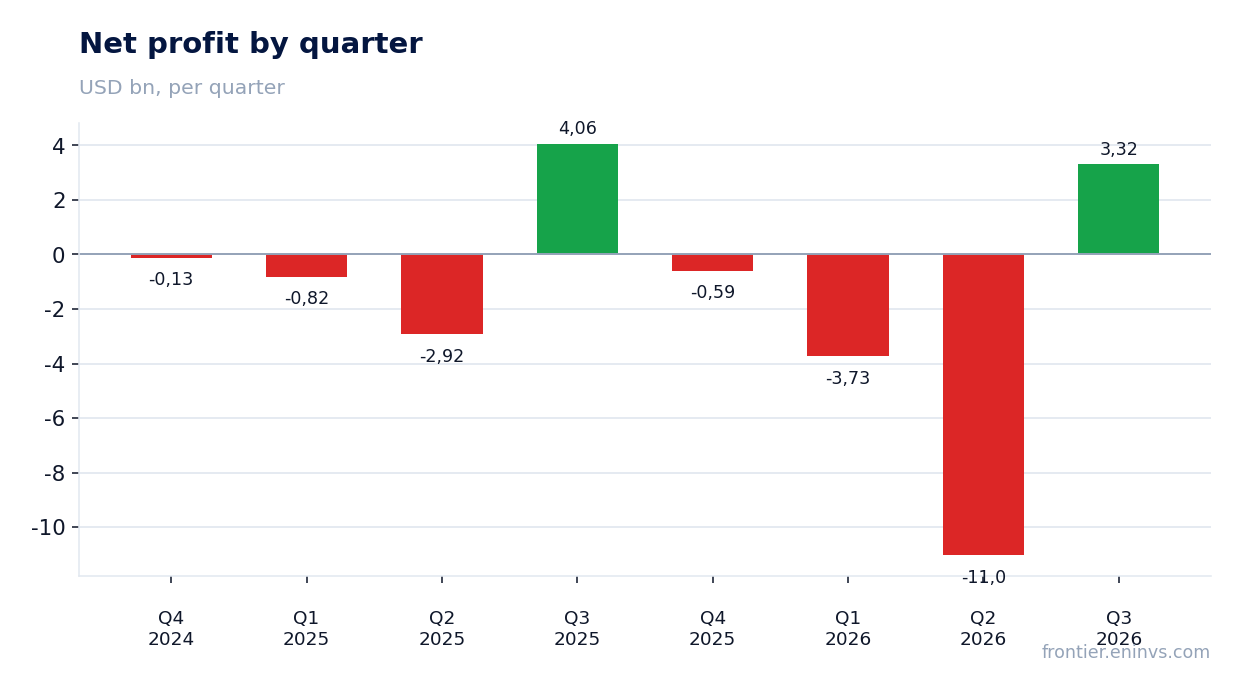
Net profit in Q3 2026 was $3,320 million versus $4,063 million a year earlier – a decline of 18.3%. However, this drop is explained by a one-off factor: in Q3 2025 the company recognised a $5,452 million gain from the sale of 51% of Altera shares, which inflated the comparison base. Excluding this effect, current-quarter profit looks significantly better.
Operating profit rose to $2,522 million from $683 million a year earlier, reflecting improved operating performance. One-off items in the current quarter include a $1,005 million gain from the mark-to-market of Escrowed Shares, which also supported net profit. Thus, current-quarter net profit includes both operational improvement and a one-off financial gain.
Net margin fell to 20.1% from 29.8% a year earlier, but this is a consequence of the high prior-year base, not a deterioration of the business. Operating margin, by contrast, rose from 5.0% to 15.3%, which is a more indicative measure of the company's health.
Operating margin rose from 5.0% to 15.3% on higher gross margin
Gross margin in Q3 2026 was 43.0% versus 38.2% a year earlier – an increase of 4.8 percentage points. This is the key factor behind the improvement in operating margin, which reached 15.3% versus 5.0% a year earlier. The gross margin increase reflects a better revenue mix: the more profitable Data Center and AI segment grew 78% to $7,318 million, while the less profitable client segment contracted.
Operating expenses grew 4% to $4,520 million, significantly slower than revenue. This provided positive operating leverage: with revenue up 20.9%, expenses rose only 4%. As a result, operating profit more than tripled from $683 million to $2,522 million.
Non-GAAP operating margin was 19.6% versus 11.2% a year earlier. The difference between GAAP and non-GAAP is mainly due to share-based compensation of $586 million and one-off charges. The margin improvement looks sustainable as it is based on a structural shift toward the more profitable server segment.
Free cash flow remains positive, but capital expenditure is rising
Operating cash flow in Q3 2026 was $5,100 million versus $2,546 million a year earlier. Adjusted free cash flow reached $1,639 million versus $896 million a year earlier. The cash flow improvement reflects higher operating profit but is partly held back by rising capital expenditure.
Gross capital expenditures were $4,219 million versus $2,956 million a year earlier. The company continues to invest in expanding production capacity, which is necessary to meet Xeon demand. For the nine months, capital expenditures were $10,216 million, below the prior-year level of $11,158 million, but quarterly growth has accelerated.
The company completed a $23 billion public equity offering, strengthening its balance sheet. Cash and short-term investments at quarter-end were $54,005 million ($21,846 + $32,159). This provides a buffer to fund capital expenditure and reduces reliance on the debt market.
Leverage at 2.64x EBITDA LTM is moderate, but the EV/EBITDA multiple of 40.2 looks high
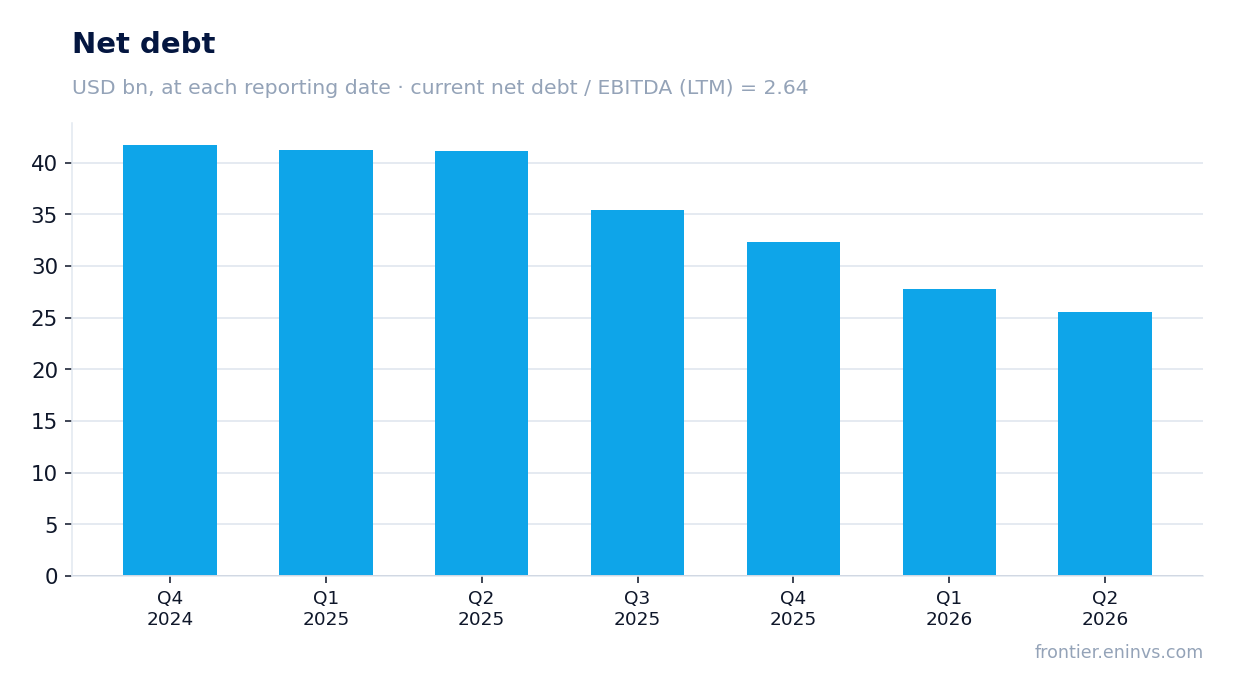
Net debt at the end of the latest annual balance sheet (27 December 2025) was $32,320 million. The net debt to EBITDA ratio for the trailing twelve months is 2.64. This is a moderate level for a company with capital-intensive manufacturing, but it does not account for seasonal cash flow fluctuations. There is no data on the earlier value of the ratio, so its direction of change is not given.
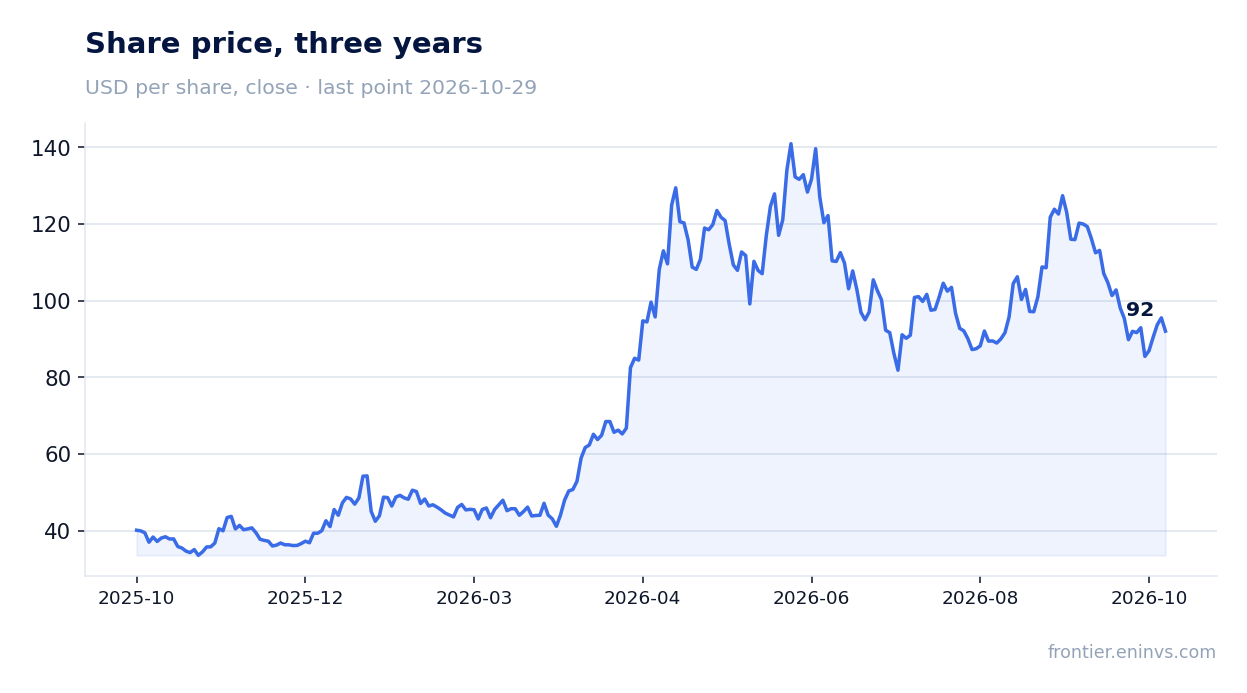
The EV/EBITDA LTM multiple is 40.2 with a market capitalisation of $459,798 million. This is a high level that reflects market expectations for future growth, especially in the Data Center and AI segment. However, it also creates a risk of correction if growth slows. For comparison, historical levels of the multiple are not provided in the facts.
Return on equity (ROE) is 13.1%, which is below the cost of capital for a company with such risks. This means the company is not yet generating sufficient returns for shareholders despite improving operating metrics.
Q4 guidance implies revenue deceleration to $15.0–16.0 billion
The company forecasts Q4 2026 revenue in the range of $15.0 to $16.0 billion. This is below the Q3 level ($16,513 million) and implies further deceleration from the 20.9% growth in Q3. The guidance reflects the expected continuation of the PC market slowdown.
GAAP EPS guidance is $0.10, significantly below the $0.60 in Q3. Non-GAAP EPS is forecast at $0.25 versus $0.52 in Q3. The lower guidance is due to seasonal factors and the ongoing downturn in the client segment.
Gross margin in Q4 is forecast at 37.1% (GAAP) and 38.0% (non-GAAP), below the Q3 level of 43.0% and 44.1% respectively. This points to an expected deterioration in revenue mix: the share of the less profitable client segment may rise while the server segment's share may fall. The guidance creates a risk for the shares if actual results come in below expectations.
Valuation on the latest reported figures
| Metric | Value |
|---|---|
| Market cap | 460 bn USD |
| EV/EBITDA (LTM) | 40.2 |
| P/B | 4.02 |
| Net debt / EBITDA (LTM) | 2.64 |
| Operating cash flow (LTM) | 12.6 bn |
| ROE | 13.1% |
Bottom line
The report's strength was the 20.9% revenue growth and more than tripling of operating profit, reflecting an improved business mix and higher margins. However, this growth was driven by a single segment – Data Center and AI – while the client segment is contracting, and Q4 guidance implies further deceleration. Net profit fell 18.3% due to a one-off effect in the prior year, but operating metrics improved. With an EV/EBITDA multiple of 40.2 and a -29% upside on the portal's model, the share looks rather unattractive at the current level. The key question for a holder is whether the company can sustain growth in the server segment while the client segment goes through a downturn.
Open the company's financial profile INTC →
See also: market overview · valuation map · stock screeners