INTUITIVE SURGICAL INC: revenue accelerated to +21.7%, but a one-off antitrust settlement cut profit by a quarter
On 20 October INTUITIVE SURGICAL INC released its third-quarter 2026 results. Revenue grew 21.7% year on year to 3,048.7 million dollars, operating profit was 592.6 million, net profit – 522.8 million. Profit fell 25.8% because of a one-off 450 million charge for an antitrust settlement; excluding it, adjusted earnings per share rose to 3.00 dollars. The stock trades below its own three-year history on EV/EBITDA, but the portal model shows a 14% downside to fair value, so the verdict is neutral.
Key takeaways
— Revenue accelerated to +21.7% year on year, and almost two-thirds of the gain came from consumables
— A one-off 450 million payment for the antitrust settlement cut net profit by a quarter
— Adjusted earnings per share rose to 3.00 dollars, and the gap to GAAP is almost twofold
— The installed base of systems grew 12%, while da Vinci 5 placements jumped 31%
— The company bought back 2.94 billion dollars of stock, which consumed almost the entire quarter's cash cushion
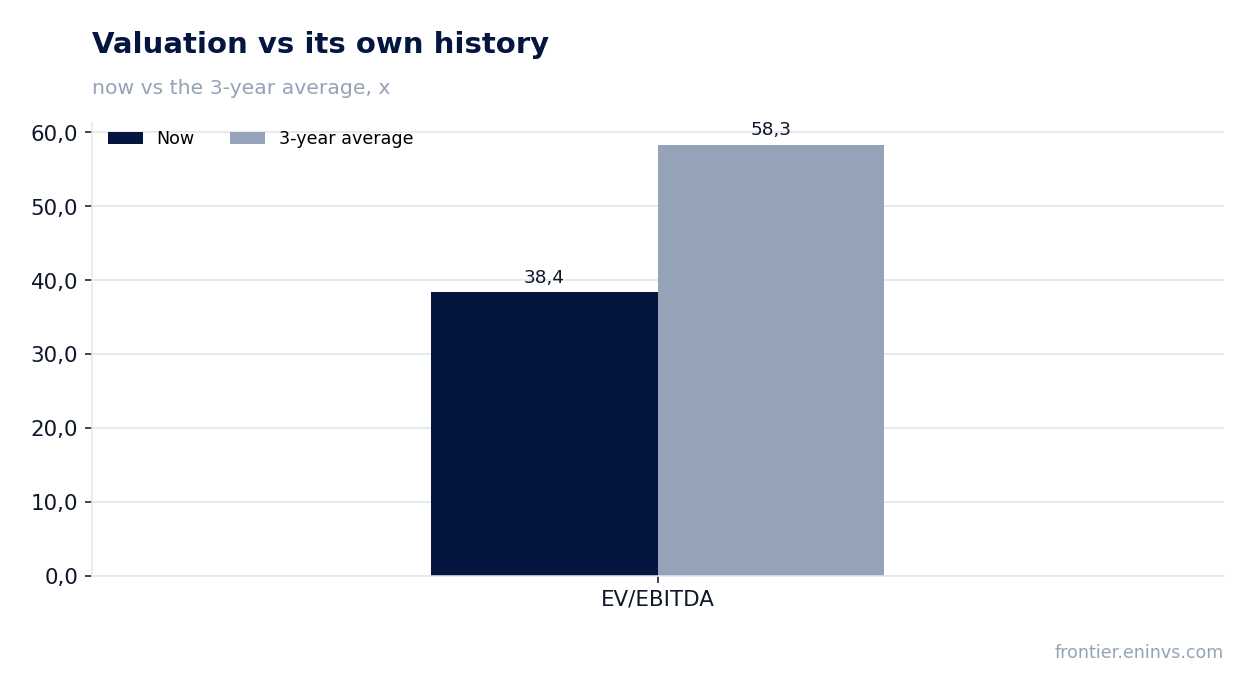
— The EV/EBITDA multiple of 38.4 is 34% below its own three-year average of 58.3
— The portal model shows a 14% downside to fair value, the main counterargument to the cheap multiple
Attractiveness
Key figures, USD bn
| Metric | Q3 2025 | Q3 2026 | Change |
|---|---|---|---|
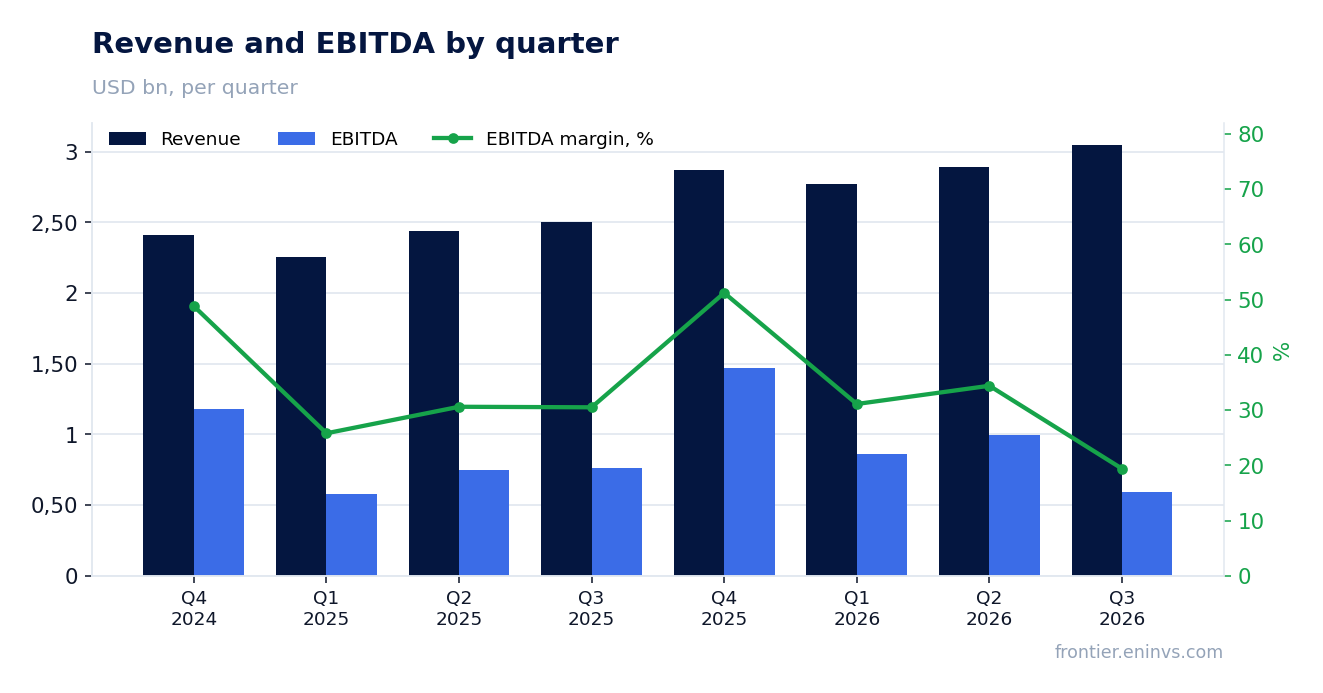
| Revenue | 2.51 | 3.05 | +21.7% |
| EBITDA | 0.76 | — | — |
| Operating profit | 0.76 | 0.59 | -22.0% |
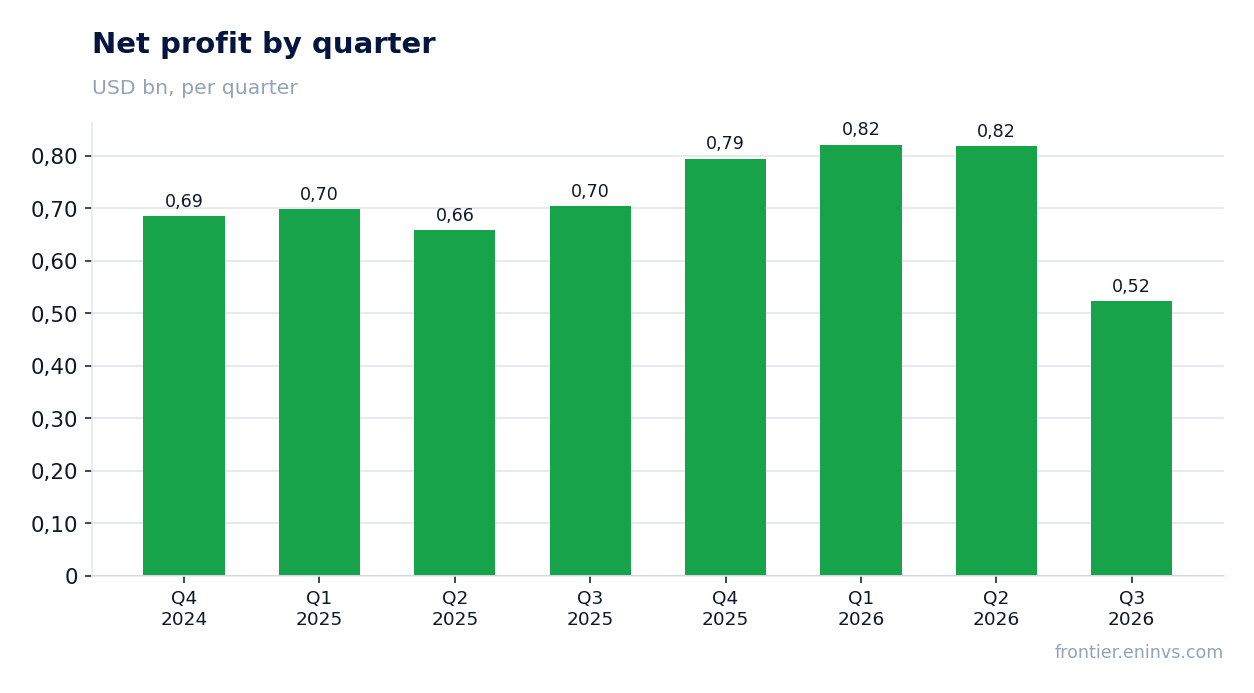
| Net profit | 0.70 | 0.52 | -25.8% |
| Operating cash flow | 0.84 | — | — |
| Capex | 0.11 | — | — |
| EBITDA margin | 30.5% | — | — |
| Net margin | 28.1% | 17.1% | -11.0 pp |
Revenue accelerated to +21.7% year on year, and almost two-thirds of the gain came from consumables
Revenue for the third quarter of 2026 was 3,048.7 million dollars, 21.7% more than a year earlier. The pace accelerated from the second quarter, when growth was 18.5%. The acceleration came not from one line but from a combination: da Vinci procedures grew about 14%, Ion – 31%, and placements under operating leases added revenue without one-off sale recognition.
Instruments and accessories brought 1,797.4 million dollars against 1,518.8 million a year earlier, up 18%. This is the largest and most recurring part of revenue: it grows with the number of operations, not with hardware sales. Systems brought 769.1 million against 590.4 million, services – 482.2 million against 395.9 million.
The installed base of da Vinci systems reached 12,094 units, 12% more than a year earlier. The Ion base grew 21% to 1,152 systems. It is the base, not quarterly placements, that determines how many consumables the company sells in subsequent periods, and its 12% growth against 21.7% revenue growth says revenue per system is also rising.
A one-off 450 million payment for the antitrust settlement cut net profit by a quarter
Net profit for the third quarter of 2026 was 522.8 million dollars against 704.4 million a year earlier, a fall of 25.8%. The reason is named in the release itself: the company reached a settlement in the antitrust class action and recorded 450 million in selling, general and administrative expenses. After tax that is 347 million, or 0.99 dollars per share.
The same charge pulled operating profit down to 592.6 million from 759.7 million a year earlier, and the net margin to 17.1% from 28.1%. The settlement has not yet received preliminary and final court approval, and the company explicitly warns that class members may object. So the amount is in the report, but the legal story is not closed.
There is also a positive one-off inside profit: refunds of tariffs paid in prior periods added 22 million after tax, or 0.06 dollars per share. It partly offset the settlement but is an order of magnitude smaller. Without both items the quarter looks calmer than the headline.
Adjusted earnings per share rose to 3.00 dollars, and the gap to GAAP is almost twofold
Adjusted net profit was 1,054.5 million dollars, or 3.00 dollars per diluted share, against 867.2 million and 2.40 dollars a year earlier. Adjusted operating profit rose to 1,269.7 million from 975.9 million. The gap to GAAP is almost twofold, and it is not explained by the one-off lawsuit alone.
The largest recurring item the company excludes is share-based compensation: 212.6 million in the quarter. This is not a one-off but a permanent cost component, and the company acknowledges it. So adjusted profit shows operating dynamics, but not what remains for the shareholder after all forms of employee pay.
Adjusted gross margin rose to 69.9% from 68.0% a year earlier. Tariff refunds helped here too: 25.7 million of refunds sit in product cost of revenue and 2.1 million in service cost. Without that item the margin would be lower, and next quarter may not bring the same tailwind.
The installed base of systems grew 12%, while da Vinci 5 placements jumped 31%
The company placed 546 da Vinci systems in the quarter against 427 a year earlier. Of these, 315 were new da Vinci 5 against 240 a year earlier, up 31%. The new platform already accounts for more than half of placements, and this changes the revenue mix: the transition supports both the system price and subsequent consumables.
The placement mix is shifting to leasing: 291 of 546 systems were placed under operating leases, of which 160 under usage-based leases. A year earlier it was 231 and 115 respectively. Leasing brings recurring revenue and raises the base, but defers one-off sale recognition, so the link between placements and quarterly revenue has weakened.
Ion placed 56 systems against 50 a year earlier, and the base grew to 1,152. This line is still small in revenue but grows faster than da Vinci, and the release names it as one of the procedure growth drivers. For an investor this is a second, not yet saturated market inside the same customer base.
The company bought back 2.94 billion dollars of stock, which consumed almost the entire quarter's cash cushion
In the quarter the company repurchased 7.8 million shares for 2.94 billion dollars. Cash, equivalents and investments fell by 1.83 billion to 6.80 billion. The release cites buybacks and capital expenditure, partly offset by operating cash flow. This is a large sum relative to quarterly profit, and it explains why the net cash position shrank.
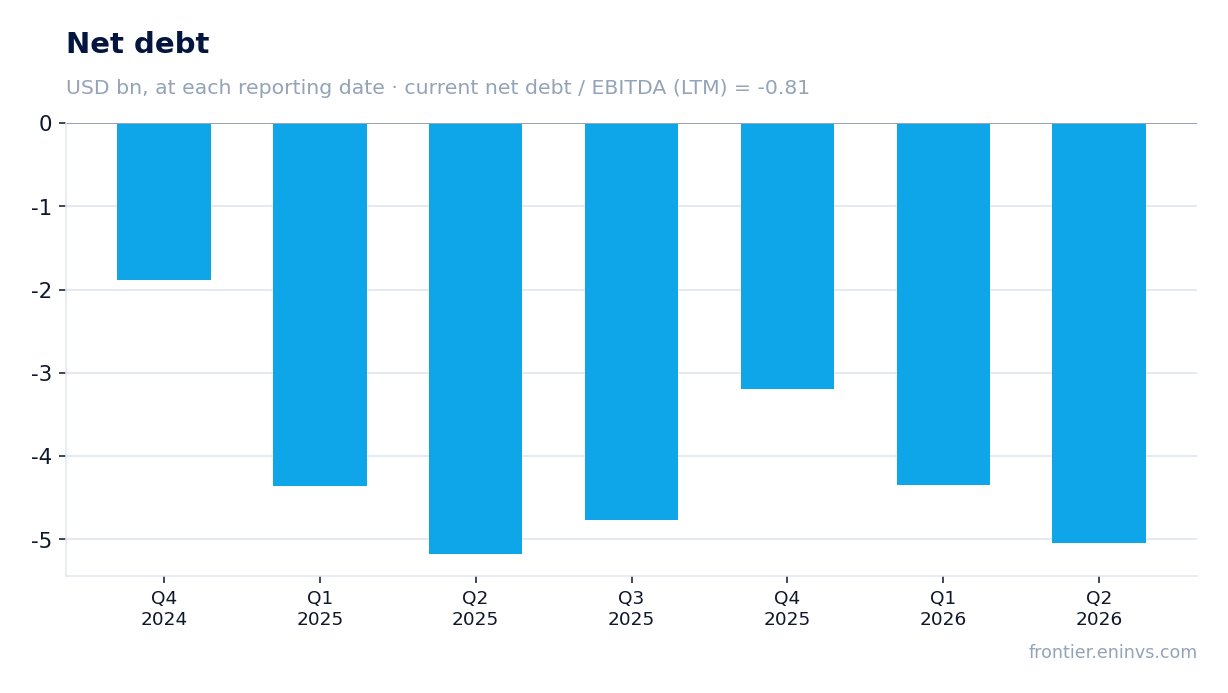
Leverage remains negative: net debt at the last annual balance sheet was minus 3,197.1 million dollars, and net debt to trailing-twelve-month EBITDA was minus 0.81. The company funds buybacks and construction from its own cash, not from borrowing. The direction of the ratio is not disclosed in the release, so we state the level only.
Operating cash flow for the quarter is not disclosed in the provided data, so profit quality cannot be judged by it. For the nine months adjusted profit was 2,957.7 million, and the buyback of 2.94 billion roughly equals it. That scale of capital return supports the share price but reduces the buffer for large investments or another one-off payment.
The EV/EBITDA multiple of 38.4 is 34% below its own three-year average of 58.3
On a trailing-twelve-month basis EV/EBITDA is 38.4 against its own three-year average of 58.3, 34% below. On this multiple the stock is cheaper than it was on average over three years. The trailing P/E is 52.6, which for a company with double-digit revenue growth does not look overheated.
Trailing-twelve-month profit is 2,957.2 million dollars, EBITDA – 3,966.6 million, revenue – 11,600.0 million. Return on equity is 18.4%. The multiples are calculated from profit already cleaned of the one-off lawsuit, so the discount to history reflects a general re-rating of expensive medical technology names rather than a deterioration in the business.
The portal model, which compares EBITDA growth with a target multiple and market capitalisation, shows a 14% downside to fair value. This is our own estimate, not a market consensus. It says that even with a multiple cheap relative to history, the price already discounts a significant part of future growth.
The portal model shows a 14% downside to fair value, the main counterargument to the cheap multiple
Market capitalisation is 155,533.8 million dollars. At that capitalisation and trailing-twelve-month EBITDA of 3,966.6 million, the EV/EBITDA multiple of 38.4 looks below its historical norm, yet the portal model still shows a 14% downside. The reason is that the model compares EBITDA growth with a target multiple, not with the current one.
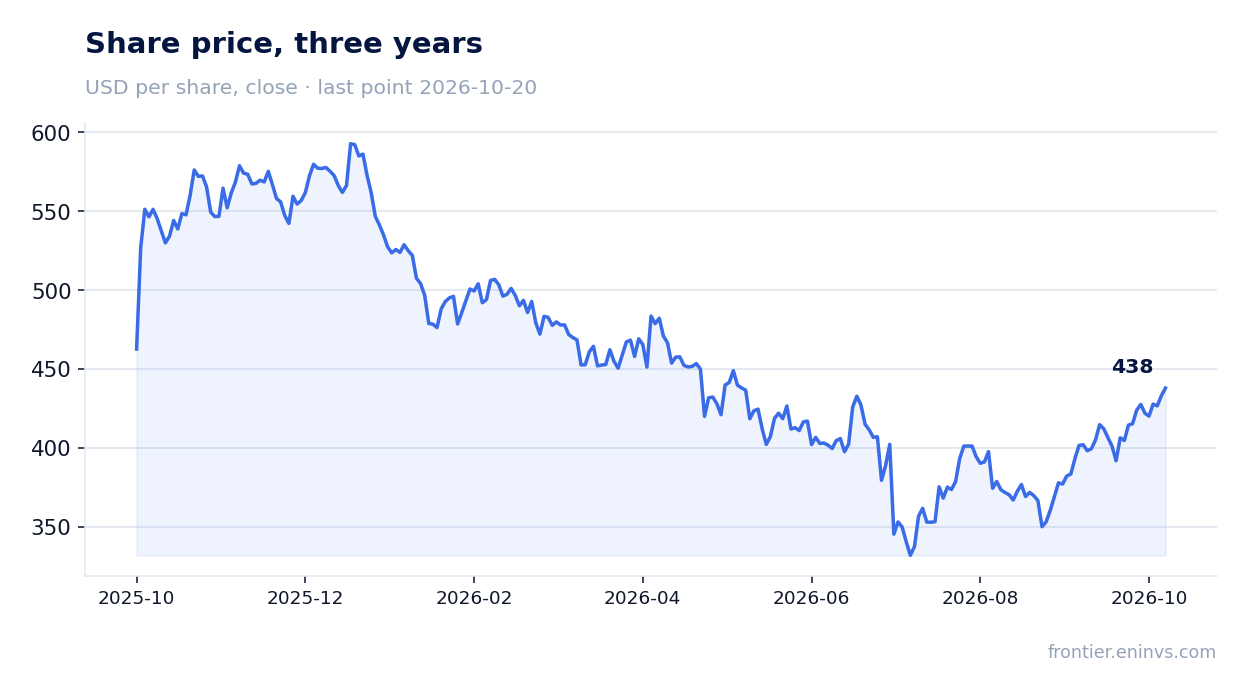
The market reaction was restrained: the share added 1.1% on the release day, and the same from the release day to 20 October. The closing price before publication was 433.18 dollars. The market did not re-rate the stock on either the one-off loss or the strong revenue, which suggests both were broadly expected.
For the verdict this means the multiple cheap relative to history and the 14% downside on the model offset each other. Revenue acceleration and base growth argue for, the one-off lawsuit and the lack of model headroom argue against. So far the balance has not tipped either way.
Valuation on the latest reported figures
| Metric | Value |
|---|---|
| Market cap | 156 bn USD |
| P/E (LTM) | 52.6 |
| EV/EBITDA (LTM) | 38.4 |
| P/B | 8.73 |
| Net debt / EBITDA (LTM) | -0.81 |
| ROE | 18.4% |
| EV/EBITDA, 3-year average | 58.3 |
Bottom line
The strong part of the report is revenue: 21.7% year on year with acceleration from 18.5% in the second quarter, a 12% rise in the da Vinci base and a 31% jump in da Vinci 5 placements. The weak part is profit: the 25.8% fall is entirely explained by the one-off 450 million lawsuit, but even without it the adjusted margin rests partly on tariff refunds. The EV/EBITDA multiple of 38.4 is 34% below its own three-year average of 58.3, yet the portal model shows a 14% downside to fair value. For a holder the main question is not the quality of the quarter but whether revenue acceleration holds once one-off items leave the report. The verdict is neutral: the arguments for and against balance out at the current price.
Open the company's financial profile ISRG →
See also: market overview · valuation map · stock screeners