JPMorgan: quarterly profit rose 6.3%, but revenue growth decelerated from 27.7% to 8.1%

On September 30, 2026, JPMorgan Chase & Co. released its third-quarter 2026 results. Revenue came in at $50,172 million, net profit at $15,305 million, up 8.1% and 6.3% year-on-year, respectively. Revenue growth decelerated from 27.7% in the second quarter. Net margin declined to 30.5% from 31.0% a year earlier. The share looks neutral: decelerating growth and margin pressure are offset by stable profit and no clear signs of asset-quality deterioration.
Key takeaways
— Revenue grew 8.1% year-on-year, but that is markedly slower than the 27.7% seen in the second quarter
— Net profit added 6.3% year-on-year, lagging revenue dynamics
— Net margin declined to 30.5% from 31.0% a year earlier
— Trailing twelve-month profit reached $203,200 million
— Net debt at the end of 2025 stood at $64,776 million
— Return on equity (ROE) came in at 5.46%
— The share is held in the portal's model strategies US Financials (banks)
Attractiveness
Key figures, USD bn
| Metric | Q3 2025 | Q3 2026 | Change |
|---|---|---|---|
| Revenue | 46.4 | 50.2 | +8.1% |
| EBITDA | 21.0 | — | — |
| Net profit | 14.4 | 15.3 | +6.3% |
| Operating cash flow | -45.2 | — | — |
| EBITDA margin | 45.3% | — | — |
| Net margin | 31.0% | 30.5% | -0.5 pp |
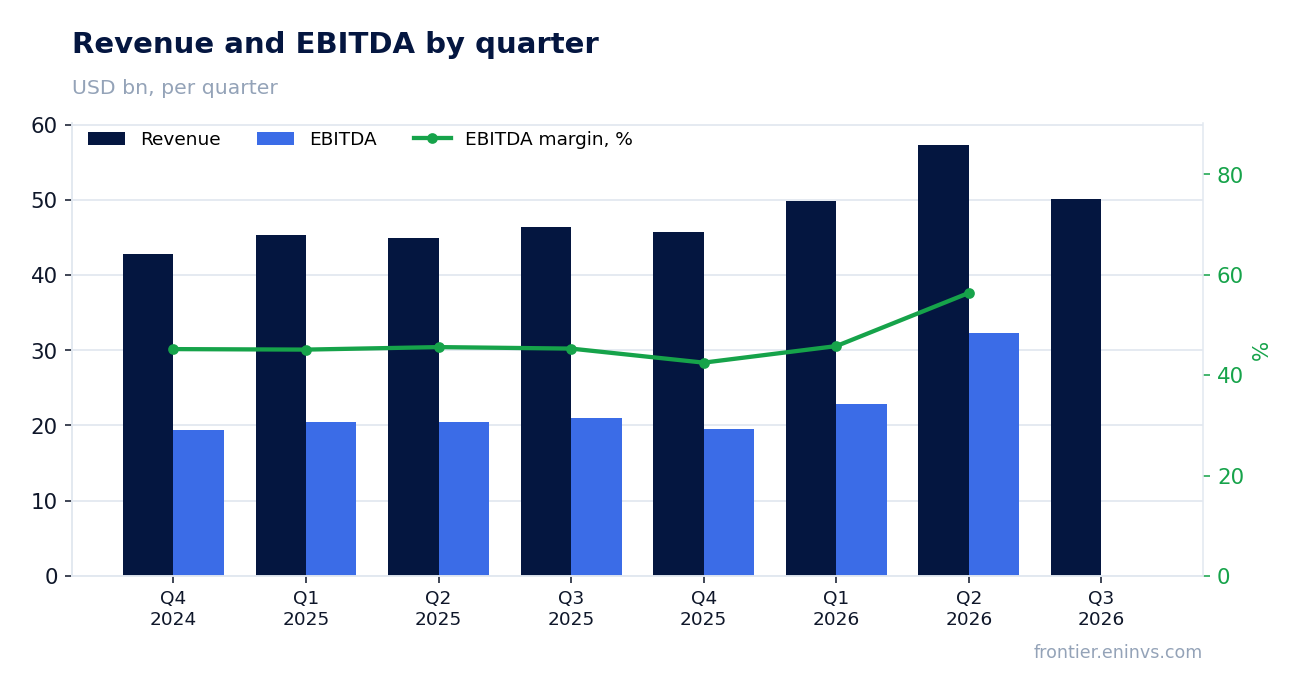
Revenue grew 8.1% year-on-year, but that is markedly slower than the 27.7% seen in the second quarter
In the third quarter of 2026, JPMorgan's revenue came in at $50,172 million, up 8.1% from the same period last year. This is a deceleration from the second quarter, when growth reached 27.7%. The slowdown may reflect a high base effect as well as changing market conditions, though the provided data does not specify the exact causes.
For comparison: revenue growth was 10.0% in the first quarter of 2026 and 7.1% in the fourth quarter of 2025. Thus, the current growth rate sits in the middle of the range of recent quarters but is significantly below the peak seen in the second quarter.
Net profit added 6.3% year-on-year, lagging revenue dynamics
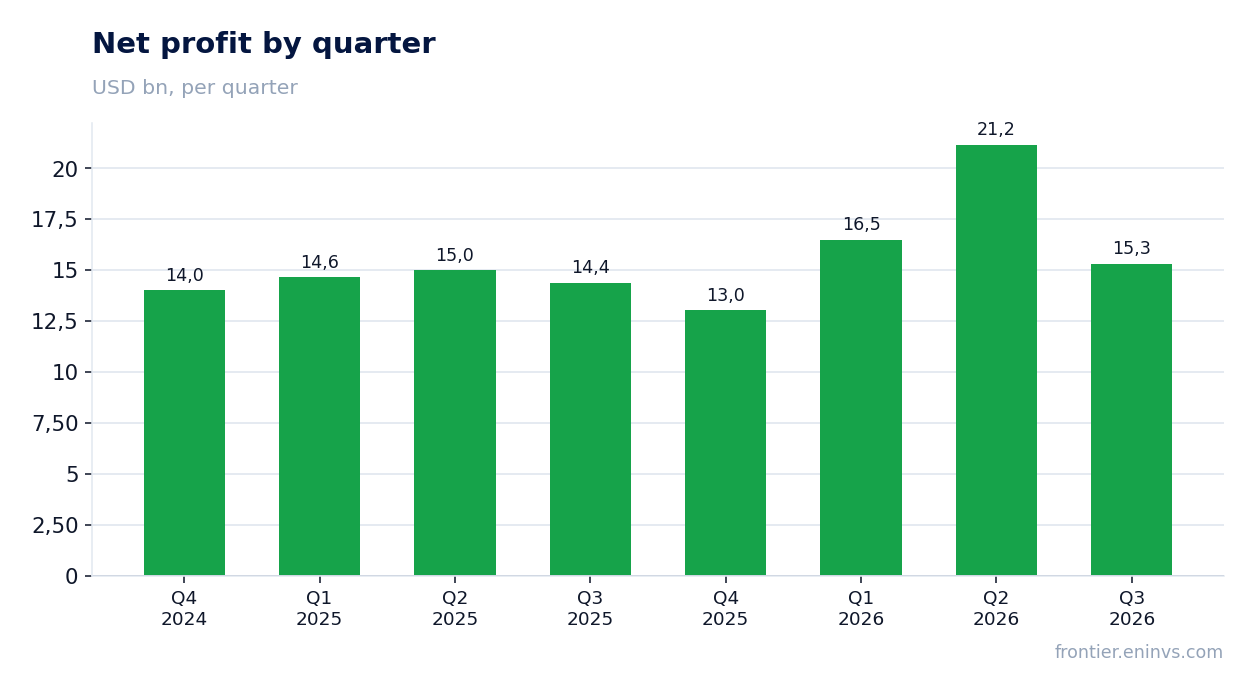
Net profit for the third quarter of 2026 was $15,305 million, up 6.3% compared to the third quarter of 2025. Profit growth lagged revenue growth, indicating faster growth in expenses or a decline in efficiency.
Nevertheless, the absolute profit level remains high. Over the trailing twelve months, net profit reached $203,200 million, confirming the scale of the business, although this figure should not be directly compared with quarterly dynamics.
Net margin declined to 30.5% from 31.0% a year earlier
Net margin in the third quarter of 2026 was 30.5%, down from 31.0% a year earlier. This 0.5 percentage point decline reflects expenses growing faster than revenue.
The margin decline could be linked to changes in revenue mix or rising costs, but the specific reasons are not detailed in the provided data. For a bank, the margin level remains high, but the downward trend warrants attention.
Trailing twelve-month profit reached $203,200 million
Cumulative net profit for the trailing twelve months ended September 30, 2026, amounted to $203,200 million. This figure reflects the combined result over four quarters and is not the result of a single reporting period.
For comparison, revenue for the same period is not provided in the data, so analysis of LTM dynamics is limited. Nevertheless, the profit level confirms the bank's ability to generate significant income over an extended period.
Net debt at the end of 2025 stood at $64,776 million
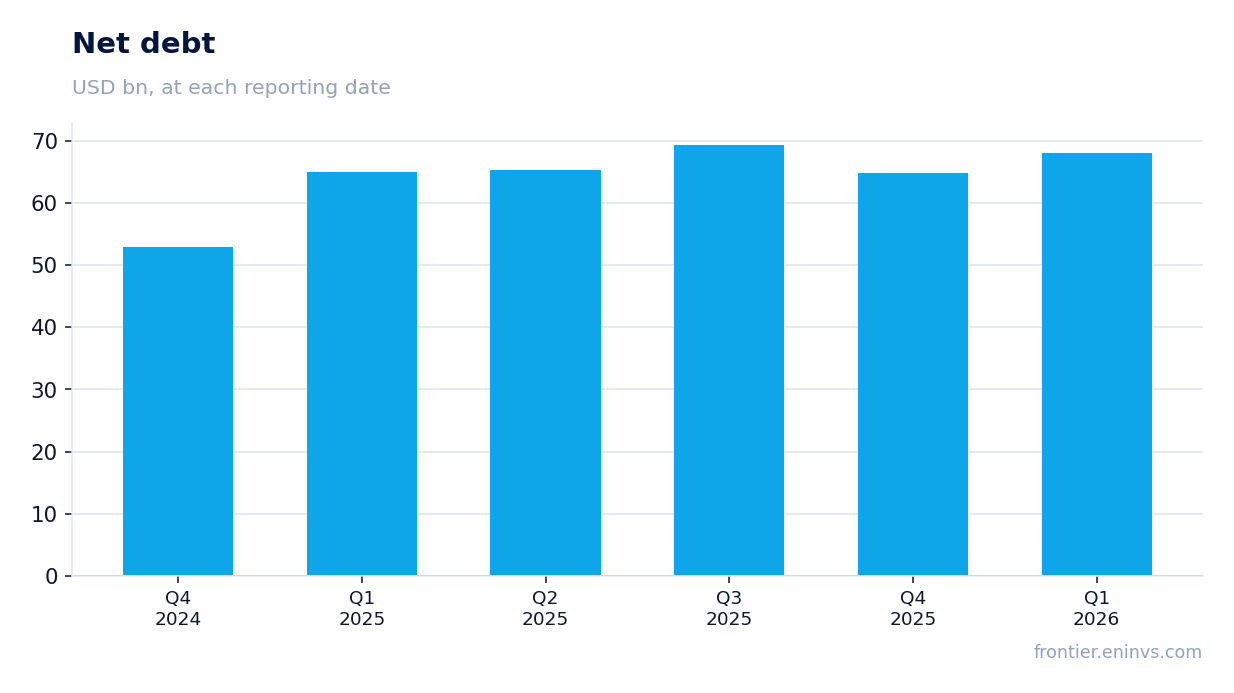
Net debt at the end of 2025 stood at $64,776 million. This is the latest available balance sheet data, as no net debt information is provided for 2026.
For a bank, the net debt level is not a direct indicator of leverage, as the balance sheet includes client funds and trading positions. Nevertheless, the increase in debt from $52,893 million at the end of 2024 to $64,776 million at the end of 2025 indicates growing liabilities.
Return on equity (ROE) came in at 5.46%
Return on equity (ROE) stands at 5.46%. This is significantly below typical levels for large banks, which may be due to calculation specifics or capital structure.
The low ROE alongside a high net margin suggests the presence of a significant volume of low-yielding assets or a conservative approach to provisioning. Without additional data, it is difficult to assess the cause.
The share is held in the portal's model strategies US Financials (banks)
JPMorgan's share is held in the portal's model strategies US Financials (banks). This is a fact that does not serve as an argument for the investment verdict but merely reflects current positioning.
Inclusion in the strategy is based on a screen that may consider various factors, including liquidity and fundamentals. However, the decision to buy or sell should not be based solely on this fact.
Bottom line
The report's strength remains the bank's ability to generate significant profit: $15,305 million for the quarter and $203,200 million over the trailing twelve months. However, revenue growth decelerated to 8.1% from 27.7% in the second quarter, and net margin declined to 30.5% from 31.0%. Net debt at the end of 2025 rose to $64,776 million, which requires monitoring. The key question for a holder now is whether the bank can accelerate revenue growth and stabilize margins amid changing conditions.
Open the company's financial profile JPM →
See also: market overview · valuation map · stock screeners