Kimco: profit doubled on asset sales while revenue growth slowed to 1.9%
On October 29 Kimco Realty reported third-quarter 2026 results. Revenue came in at $546.1 million, up 1.9% year over year, EBITDA rose 26.2% to $435.9 million, and net income more than doubled to $279.1 million. The profit jump came not from operations but from a $122.4 million increase in gains on property sales, while revenue growth slowed from 4.9% in the second quarter to 1.9%. At the current price the share looks rather attractive on dividend yield and record occupancy, but slowing revenue and the one-off nature of the profit limit the upside.
Key takeaways
— Revenue grew just 1.9% – half the 4.9% pace of the prior quarter
— Profit doubled, but $122.4 million of the increase came from property sales
— EBITDA margin jumped to 79.8% on one-off items, not operations
— Occupancy hit a record 96.6%, and new-lease rents rose 31.5%
— Net debt fell from $7.6 billion to $7.5 billion over the year
— The dividend was raised 7.7% to $0.28 per share, a yield of about 4.7%
— 2026 FFO guidance was raised to $1.84–$1.86 per share
Attractiveness
Key figures, USD bn
| Metric | Q3 2025 | Q3 2026 | Change |
|---|---|---|---|
| Revenue | 0.54 | 0.55 | +1.9% |
| EBITDA | 0.35 | 0.44 | +26.2% |
| Operating profit | 0.19 | 0.28 | +49.6% |
| Net profit | 0.14 | 0.28 | +102.5% |
| Operating cash flow | 0.33 | 0.39 | +17.2% |
| Capex | 0.00 | — | — |
| EBITDA margin | 64.5% | 79.8% | +15.3 pp |
| Net margin | 25.7% | 51.1% | +25.4 pp |
Revenue grew just 1.9% – half the 4.9% pace of the prior quarter
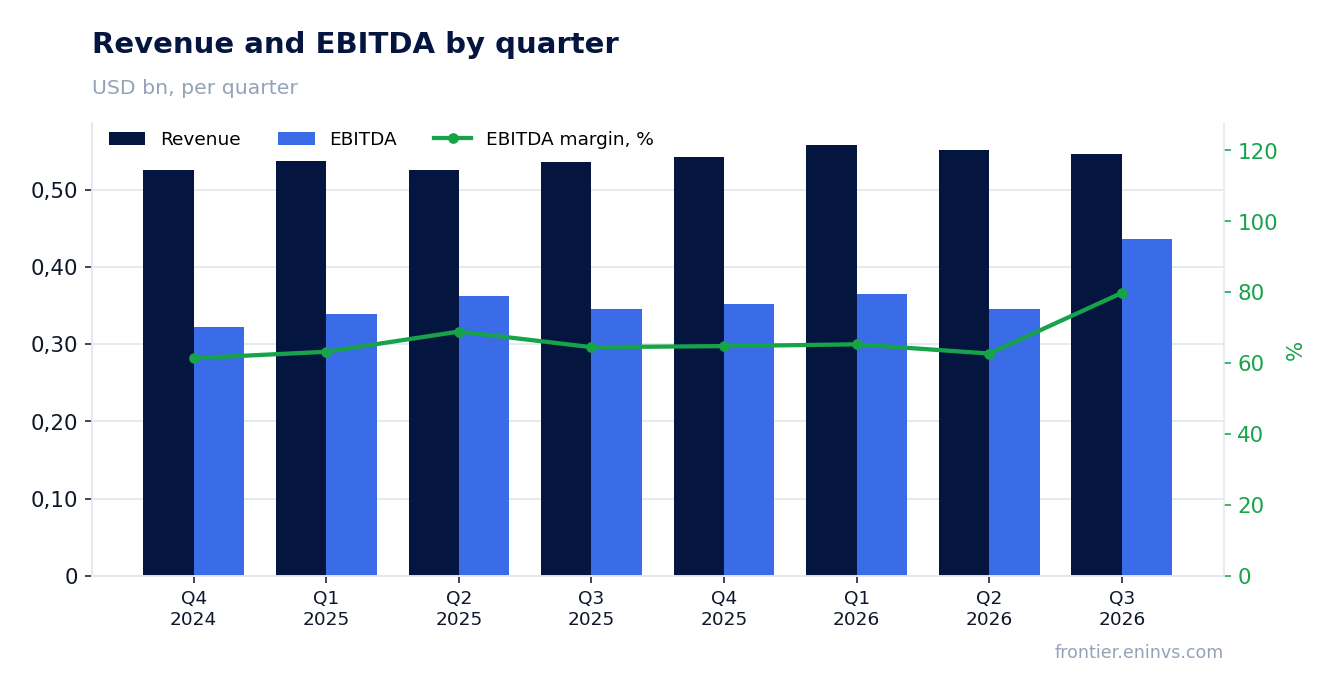
Third-quarter 2026 revenue was $546.1 million versus $535.9 million a year earlier, with growth slowing to 1.9% from 4.9% in the second quarter. Rental revenue added only $8.6 million to $539.7 million, while management and other fee income rose from $4.7 million to $6.4 million.
The slowdown mainly reflects the base effect: growth was 5.6% a year earlier, and the company is now settling into more mature rates. Asset sales – the Witmer multifamily building for $211.5 million and four Costco-anchored assets for about $127 million – shrink the rental revenue base, though proceeds are recycled into higher-yielding shopping centers.
Rent growth supports revenue: new leases signed at 31.5% higher rents and renewals at 7.3%. But the effect flows into reported results gradually, and the 390-basis-point gap between leased and economic occupancy represents $76 million of annual rent from signed leases that have not yet commenced.
Profit doubled, but $122.4 million of the increase came from property sales
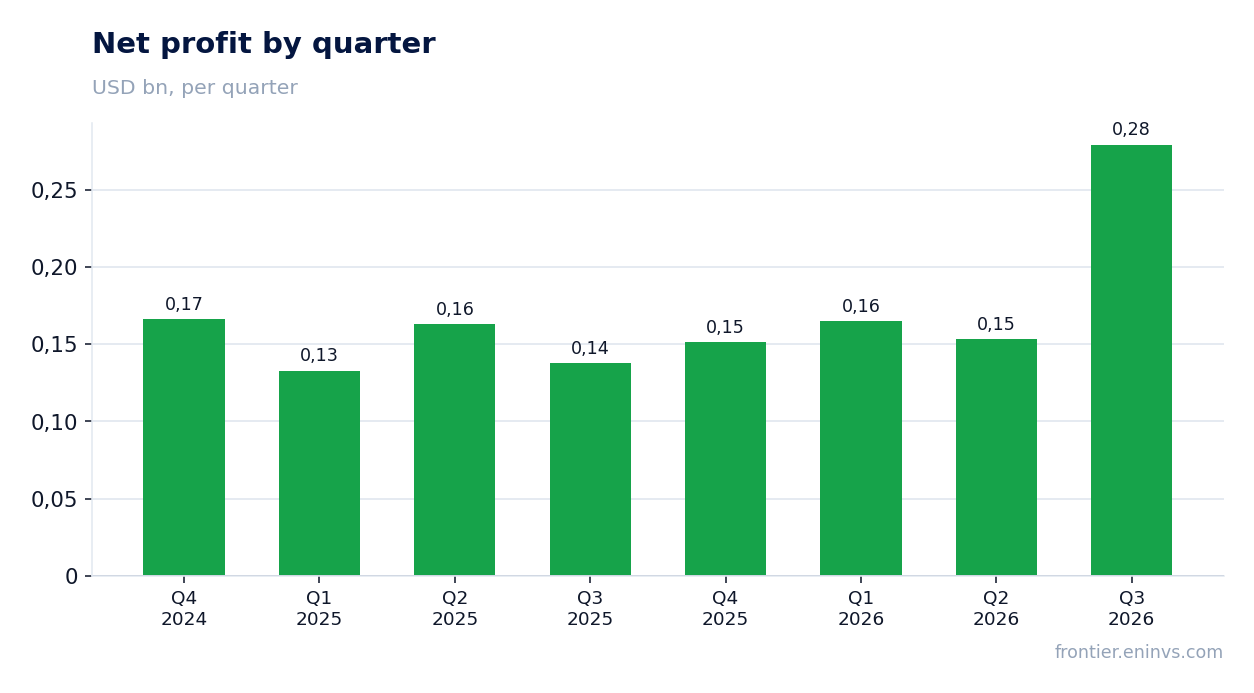
Third-quarter 2026 net income was $279.1 million versus $137.8 million a year earlier, up 102.5%. The main driver, however, was gains on property sales: $89.4 million versus $3.7 million a year earlier, an increase of $122.4 million that exceeds the entire increase in net income.
Excluding one-off sales, profit would have been below last year's level. The Witmer sale was struck at a cap rate of about 5.1%, and the proceeds funded share buybacks at an implied cap rate in the mid-7% range – a value-creating trade, but its effect on profit is one-off.
Operating profit rose from $187.2 million to $280.0 million, also helped by gains on sales. Equity in income of joint ventures increased from $27.0 million to $73.9 million, including $50.6 million from a joint-venture property sale. Recurring profit excluding sales remains modest.
EBITDA margin jumped to 79.8% on one-off items, not operations
Third-quarter 2026 EBITDA was $435.9 million, a margin of 79.8% versus 64.5% a year earlier. EBITDA growth of 26.2% on revenue growth of 1.9% means the margin was lifted by items below operating profit, not by operating efficiency.
The EBITDA calculation includes gains on sales and equity in income of joint ventures, both abnormally high this quarter. Operating profit rose 49.5%, but it too includes $89.4 million of gains on sales. Excluding them, operating dynamics would be far more modest.
Costs grew moderately: general and administrative expenses were almost flat at $30.0 million versus $29.6 million, and operating and maintenance expenses fell from $92.4 million to $89.4 million. That supports the underlying margin but does not explain the jump.
Occupancy hit a record 96.6%, and new-lease rents rose 31.5%
Portfolio occupancy reached a record 96.6%, up 20 basis points sequentially and 90 basis points year over year. Small-shop occupancy held at a record 92.9%, while anchor occupancy rose to 98.2%.
New-lease rents rose 31.5% versus prior terms, renewals 7.3%, and options 7.7%. Blended cash rent spreads on comparable spaces were 12%. This signals strong bargaining power amid limited new supply.
Rent growth flows into revenue with a lag: the 390-basis-point gap between leased and economic occupancy represents $76 million of annual rent that will begin to arrive as signed leases commence. That is the main reserve for revenue acceleration in coming quarters.
Net debt fell from $7.6 billion to $7.5 billion over the year
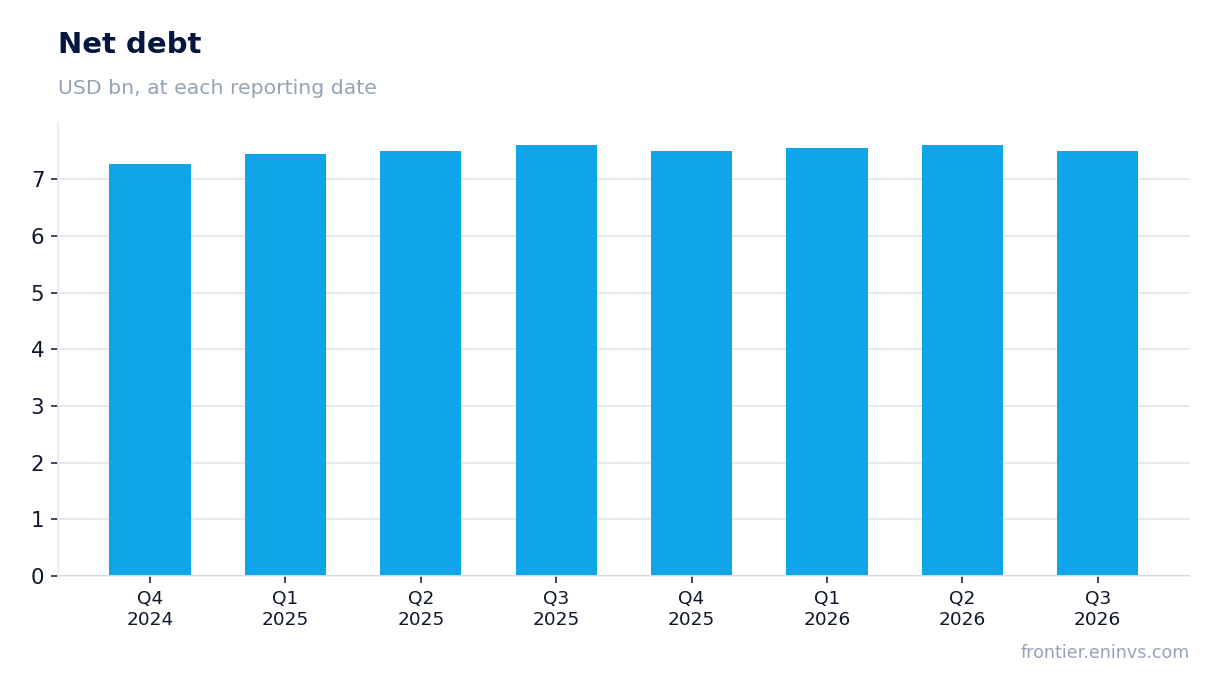
Net debt at September 30, 2026 was $7.5 billion versus $7.6 billion at June 30, 2026 and $7.6 billion at September 30, 2025. The year-over-year decline was $0.1 billion – modest but in the right direction.
The company repaid two unsecured notes totaling $266.0 million at a blended coupon of 3.45% and, after quarter-end, a $500 million note at a 2.80% coupon. This reduces interest expense, which was $87.7 million for the quarter versus $84.3 million a year earlier.
Liquidity remains high: over $2.5 billion of immediate liquidity, including $545 million of cash, and full availability under the $2.0 billion revolver. Operating cash flow for the quarter was $389.5 million, covering interest expense and dividends.
The dividend was raised 7.7% to $0.28 per share, a yield of about 4.7%
The board declared a quarterly dividend of $0.28 per share, 7.7% above the payout for the same period last year. The annual rate is $1.12 per share, payable December 18, 2026 to shareholders of record on December 4.
At the roughly $23.8 price at which the company repurchased shares during the quarter, the yield is about 4.7%. That is above the yield on ten-year US Treasuries, which traded around 4.0–4.2% during the reporting period, and fits the stock's membership in the US REITs (high yield) strategy on the portal.
The payout is covered by operating cash flow: $389.5 million for the quarter, while common dividends on 666.5 million shares absorb about $187 million. 2026 FFO guidance was raised to $1.84–$1.86 per share, implying a payout ratio of about 60% – a comfortable level for a REIT.
2026 FFO guidance was raised to $1.84–$1.86 per share
The company raised 2026 FFO guidance from $1.83–$1.84 to $1.84–$1.86 per share and net income guidance from $1.00–$1.03 to $1.07–$1.09. This is the third consecutive raise and the third straight year of FFO per share growth above 5%.
The guidance rests on same-property NOI growth of 3.5–3.8% for the year, credit losses falling to 50–60 basis points, and rent growth from signed but not-yet-commenced leases. The company also expects a neutral effect from acquisitions and dispositions at $400–$500 million of volume.
At the roughly $23.8 price, the FFO multiple is about 12.8–12.9x. That is below the company's three-year historical average, leaving room for re-rating if revenue growth accelerates.
Valuation on the latest reported figures
| Metric | Value |
|---|---|
| Operating cash flow (LTM) | 1.24 bn |
| ROE | 10.9% |
Bottom line
The quarter's strengths are real: record 96.6% occupancy, 31.5% new-lease rent growth, and raised FFO guidance of $1.84–$1.86 per share. But the doubling of profit is mostly property sales, not operations: without the $122.4 million increase in gains, net income would have been below last year's level. Revenue slowed to 1.9%, and the key question for a holder is when the $76 million of rent from signed leases will start flowing into reported results. A dividend yield of about 4.7% and an FFO multiple of about 12.8x, below the historical average, support the share's appeal, but the upside is capped until revenue accelerates.
Open the company's financial profile KIM →
See also: market overview · valuation map · stock screeners