KLA CORP: revenue up 28.9%, but the entire gain rides on one segment

On 28 October KLA CORP released results for the first quarter of fiscal 2027, ended 30 September 2026. Revenue came in at $4,136.0 million, net income at $1,548.6 million, and operating cash flow at $1,530.9 million. Year on year revenue rose 28.9% and net income 38.1%, while the net margin climbed to 37.4% from 34.9%. The stock trades below its own three-year history on EV/EBITDA, and at the current price it looks rather attractive.
Key takeaways
— Revenue rose 28.9% year on year, and almost the entire gain came from one segment – Semiconductor Process Control
— The net margin climbed to 37.4% from 34.9% because revenue grew faster than costs
— Profit is clean of one-offs: non-GAAP gives $1,603.0 million against $1,548.6 million on a GAAP basis
— Free cash flow for the quarter was $1,336.2 million, covering both dividends and buybacks
— Leverage is moderate: net debt to trailing-twelve-month EBITDA stands at 0.74
— The stock is cheaper than its own history: EV/EBITDA of 35.0 against a three-year average of 40.3
— The dividend yield is only 0.53%, and it is not the main argument for a holder
Attractiveness
Key figures, USD bn
| Metric | Q3 2025 | Q3 2026 | Change |
|---|---|---|---|
| Revenue | 3.21 | 4.14 | +28.9% |
| EBITDA | 1.41 | — | — |
| Operating profit | 1.31 | — | — |
| Net profit | 1.12 | 1.55 | +38.1% |
| Operating cash flow | 1.16 | 1.53 | +31.8% |
| Capex | 0.10 | — | — |
| EBITDA margin | 43.8% | — | — |
| Net margin | 34.9% | 37.4% | +2.5 pp |
Revenue rose 28.9% year on year, and almost the entire gain came from one segment – Semiconductor Process Control
Revenue for the quarter ended 30 September 2026 was $4,136.0 million against $3,209.7 million a year earlier. This is the fastest growth in recent quarters: revenue rose 15.2% in the previous quarter and 28.9% in the one before that. The acceleration against the previous quarter is confirmed by the numbers.
Almost the entire gain came from Semiconductor Process Control: its revenue rose to $3,754.3 million from $2,899.4 million a year earlier. The other two segments – Specialty Semiconductor Process and PCB and Component Inspection – together contributed only about $382 million, and their contribution to growth is more modest. Such concentration makes the result sensitive to demand for process control equipment.
The company attributes the growth to demand for chipmaking solutions within the buildout of artificial intelligence infrastructure. In the press release, CEO Rick Wallace speaks of accelerated growth in the second half of calendar 2026 and of several inflections in chip design that support demand for process control.
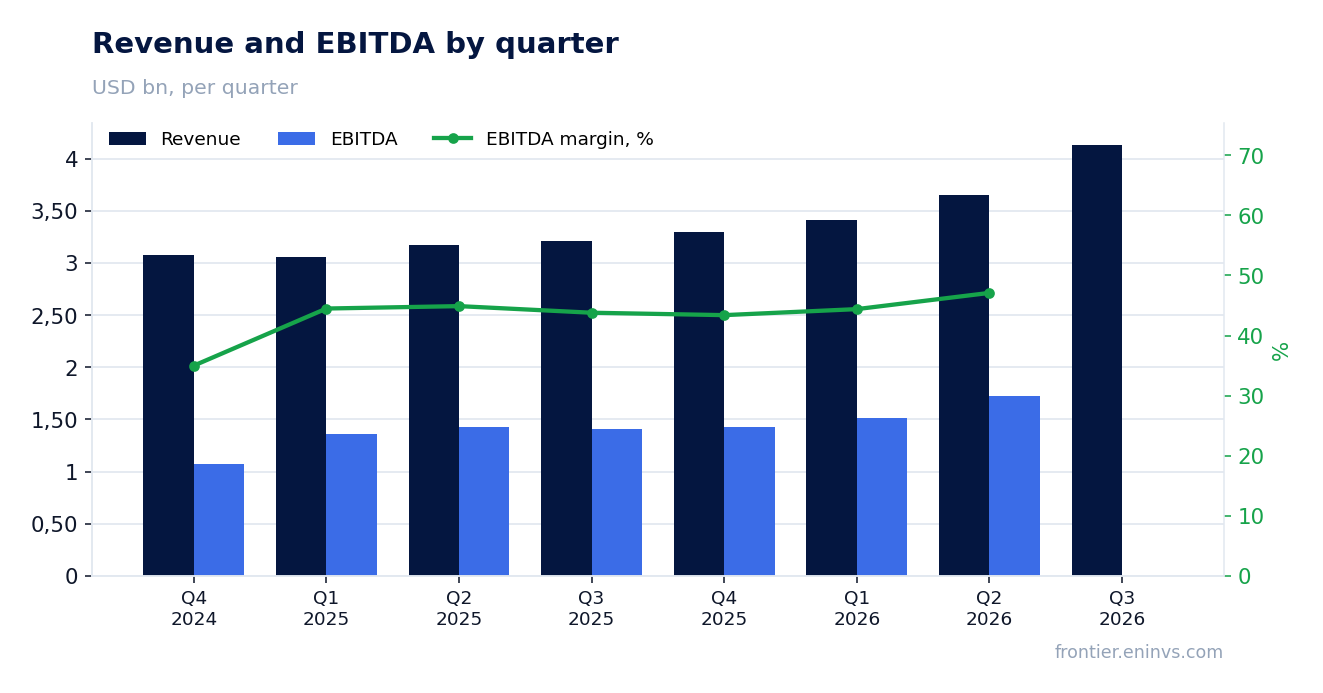
The net margin climbed to 37.4% from 34.9% because revenue grew faster than costs
Net income for the quarter was $1,548.6 million against $1,121.0 million a year earlier, up 38.1%. The net margin rose to 37.4% from 34.9%. Profit grew faster than revenue, and that is the main sign of operating leverage.
Cost of revenues rose to $1,577.8 million from $1,243.1 million, but its share of revenue declined. Research and development expenses were $395.1 million, and selling, general and administrative expenses were $301.5 million. Both lines grew slower than revenue, which delivered the margin expansion.
Interest expense declined to $67.9 million from $71.1 million a year earlier. That is a small relief, but it also works in favour of net income. The tax rate stayed moderate: the provision for income taxes was $275.5 million on pre-tax income of $1,824.1 million.
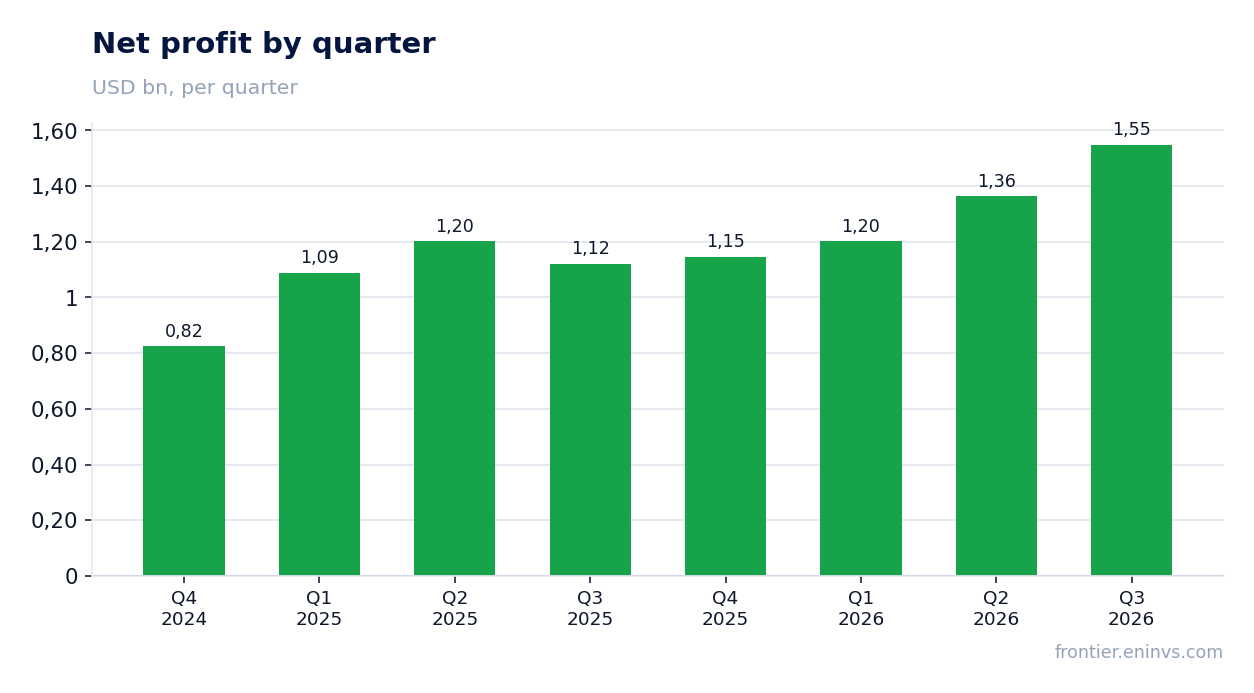
Profit is clean of one-offs: non-GAAP gives $1,603.0 million against $1,548.6 million on a GAAP basis
The gap between GAAP and non-GAAP profit is small. The main adjustment is acquisition-related charges of $43.0 million, of which $34.9 million hit cost of revenues and $8.1 million administrative expenses. A further $20.2 million came from Pillar Two taxes and $5.8 million from discrete tax items.
As a result, non-GAAP net income was $1,603.0 million, or $1.22 per diluted share against $1.18 on a GAAP basis. Diluted shares were 1,311.1 million, down from 1,323.8 million a year earlier thanks to buybacks.
There are no one-off gains in the report that would inflate profit. The adjustments are recurring in nature – amortisation of intangibles and tax effects. This means profit quality in the quarter is high, and the 37.4% growth in non-GAAP profit reflects operating dynamics rather than a paper gain.
Free cash flow for the quarter was $1,336.2 million, covering both dividends and buybacks
Operating cash flow for the quarter was $1,530.9 million, and capital expenditure was $194.8 million. Free cash flow reached $1,336.2 million. Over the last twelve months operating cash flow was $4,512.4 million and free cash flow $4,037.6 million.
Capital expenditure rose to $194.8 million from $95.9 million a year earlier. That is a noticeable jump, but it is still small relative to revenue. The company is investing in production capacity, and at the current cash flow this creates no strain.
Dividends absorbed $305.1 million and buybacks $935.8 million. Together that is $1,240.9 million, and free cash flow covers these payments. Over the last twelve months capital returns were $3,789.4 million against free cash flow of $4,037.6 million.
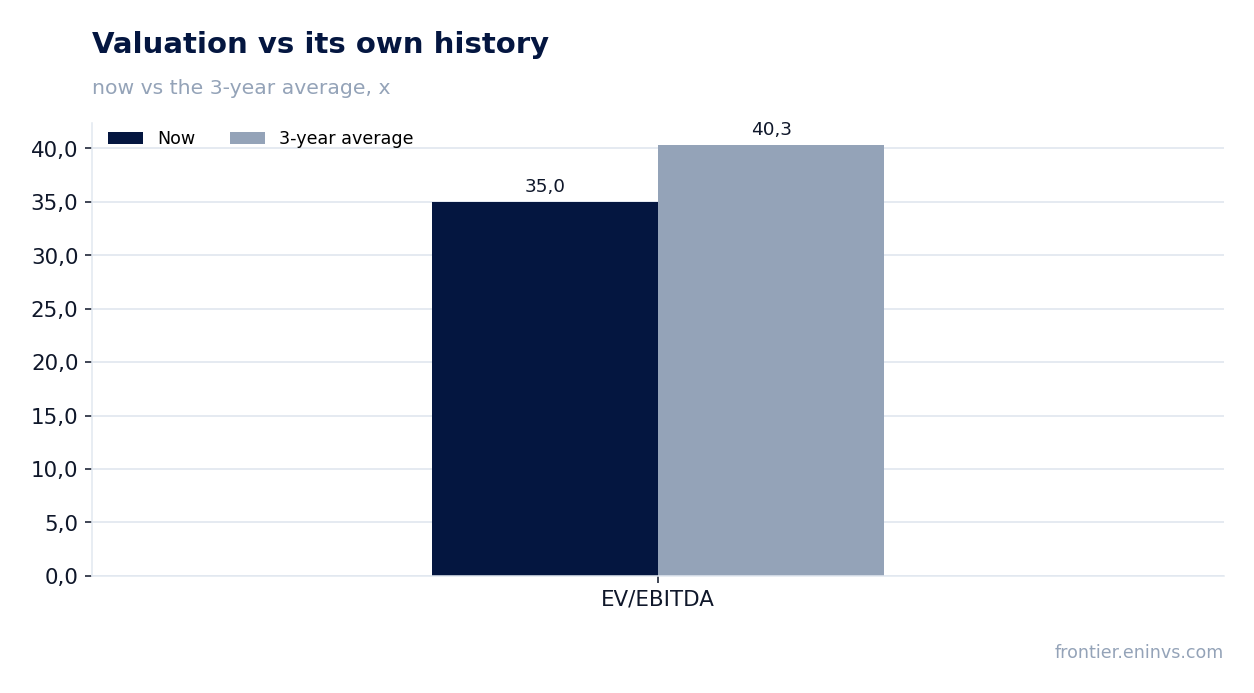
Leverage is moderate: net debt to trailing-twelve-month EBITDA stands at 0.74
Net debt at the latest balance-sheet date was $4,501.9 million. The ratio of net debt to trailing-twelve-month EBITDA is 0.74. That is a level that creates no risk for a holder and leaves room for buybacks.
Long-term debt at 30 September 2026 was $5,723.3 million against $5,887.4 million at 30 June 2026. The company is gradually paying down obligations. Interest expense for the quarter was $67.9 million, down year on year.
Cash and marketable securities together total about $4,741.2 million. That is enough to service debt and pay shareholders. Leverage remains comfortable even if revenue growth slows.
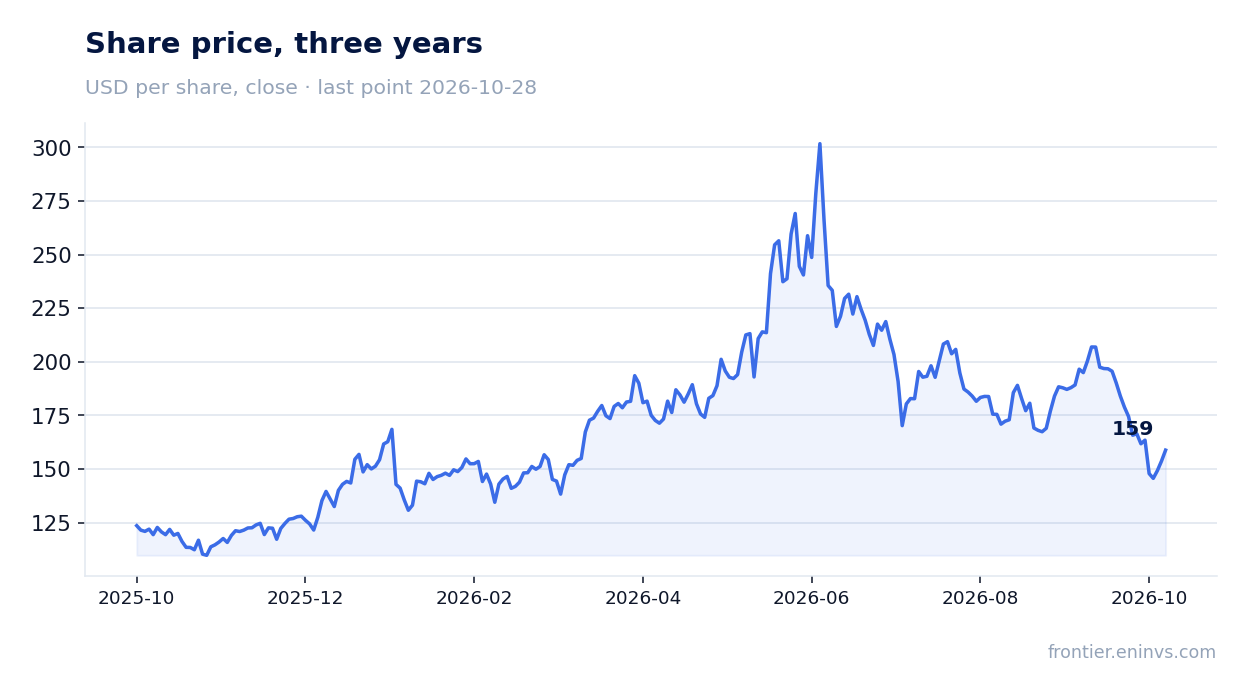
The stock is cheaper than its own history: EV/EBITDA of 35.0 against a three-year average of 40.3
On the trailing-twelve-month EV/EBITDA multiple the stock trades at 35.0, while its own three-year average is 40.3. That is 13% below the historical level. On this multiple the share is cheaper than usual.
The trailing-twelve-month P/E is 39.5. Return on equity is 96.2%, reflecting high profitability on a small capital base. Market capitalisation is $207,509.7 million.
Our valuation model, built on EBITDA growth and a target multiple, implies +13% upside to fair value. This is our own estimate, not a market consensus. After the report the share added 3.3% and is up the same 3.3% since publication.
The dividend yield is only 0.53%, and it is not the main argument for a holder
Over the last twelve months the dividend yield was 0.53%. Dividends absorbed $305.1 million in the quarter and $1,109.0 million over the year. Payments are growing, but their size is small relative to market capitalisation.
The company pays out only part of its profit as dividends and does most of its capital returns through buybacks: $935.8 million in the quarter. That approach is more beneficial for a holder at a high valuation because it reduces the share count.
A yield of 0.53% does not compete with the risk-free rate. For an investor buying the stock for dividends, this argument is weak. The main return here comes from profit growth and buybacks, not from payouts.
Valuation on the latest reported figures
| Metric | Value |
|---|---|
| Market cap | 208 bn USD |
| P/E (LTM) | 39.5 |
| EV/EBITDA (LTM) | 35.0 |
| P/B | 32.68 |
| Net debt / EBITDA (LTM) | 0.74 |
| Operating cash flow (LTM) | 4.51 bn |
| ROE | 96.2% |
| Dividend yield (12m) | 0.5% |
| EV/EBITDA, 3-year average | 40.3 |
Bottom line
The quarter was strong: revenue rose 28.9%, profit 38.1%, and the net margin climbed to 37.4%. Growth came almost entirely from one segment, and that is the main risk. Cash flow covers both dividends and buybacks, and leverage remains moderate. The stock trades below its own three-year history on EV/EBITDA, and at the current price it looks rather attractive. The main question for a holder is whether demand for process control holds up when the effect of the artificial intelligence infrastructure buildout fades.
Open the company's financial profile KLAC →
See also: market overview · valuation map · stock screeners