COCA COLA CO: World Cup drives revenue, but margins remain under pressure

On July 28, 2026, COCA COLA CO reported second quarter 2026 results. Revenue grew 6.7% to $13,380 million, EBITDA rose 34.0% to $4,938 million, and net profit increased 16.1% to $4,425 million. The stock looked attractive amid strong growth, but given multiples above its own history and continued margin pressure, we rate it 'rather attractive'.
Key takeaways
— Revenue +6.7% – best quarterly growth in a year, supported by the FIFA World Cup
— EBITDA margin expanded to 45.7% from 36.4% a year ago, but GAAP operating margin is only 34.9%
— Net profit +16.1% to $4,425 million, but including one-off items
— Leverage: 2.19 EBITDA LTM – above the three-year average
— Free cash flow for the half-year is $6.9 billion, but dividends consume a large part
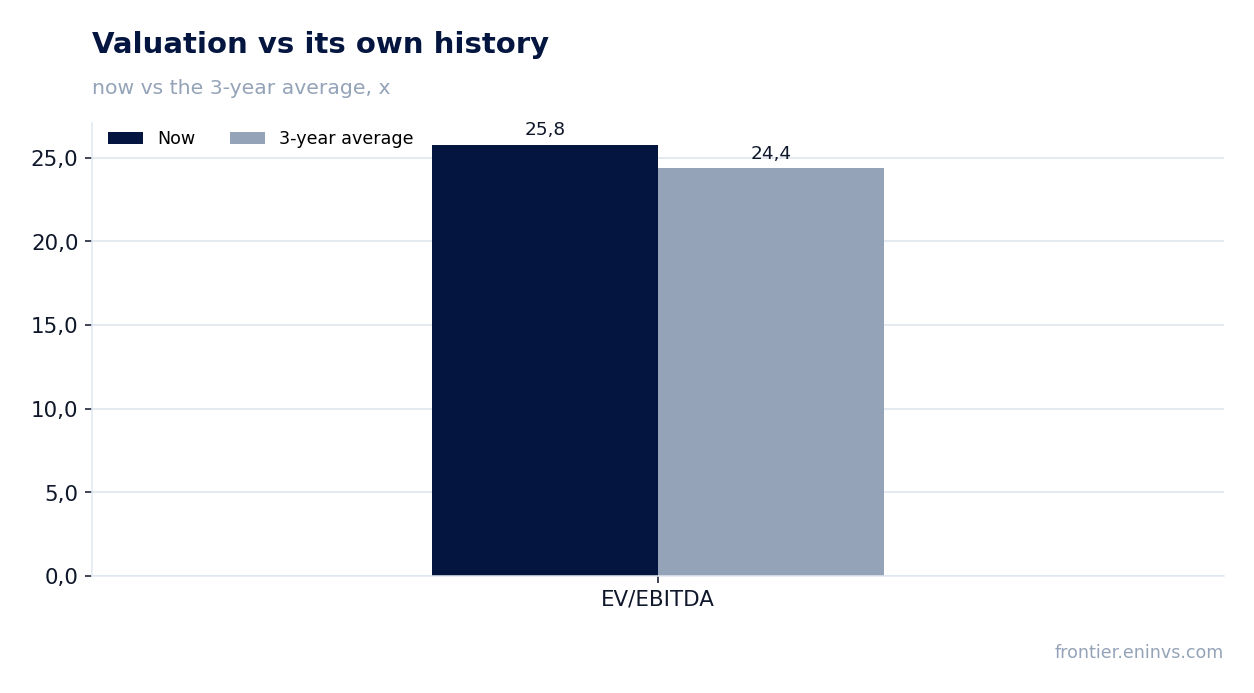
— Valuation: EV/EBITDA 25.8 vs. 24.4 three-year average – expensive relative to history
Attractiveness
Key figures, USD bn
| Metric | Q2 2025 | Q2 2026 | Change |
|---|---|---|---|
| Revenue | 12.5 | 13.4 | +6.7% |
| EBITDA | 4.56 | 6.11 | +34.0% |
| Operating profit | 4.28 | 4.67 | +9.2% |
| Net profit | 3.81 | 4.42 | +16.1% |
| Operating cash flow | 3.81 | 5.52 | +44.9% |
| Capex | 0.44 | 0.42 | -5.4% |
| EBITDA margin | 36.4% | 45.7% | +9.3 pp |
| Net margin | 30.4% | 33.1% | +2.7 pp |
Revenue +6.7% – best quarterly growth in a year, supported by the FIFA World Cup
In Q2 2026, COCA COLA CO's revenue grew 6.7% YoY to $13,380 million. This is the best quarterly pace in the last four quarters: Q1 2026 saw 12.1% growth, but partly due to six additional days in the quarter, as noted in the report. Excluding this effect, Q2 dynamics look stronger than in previous quarters of 2025 (from 1.4% to 5.1%).
The main driver was the FIFA World Cup: the company activated a global campaign in more than 180 countries, contributing to 5% volume growth in the quarter. Organic revenue growth (non-GAAP) was 6%, with concentrate sales up 4% and price/mix up 2%. In North America, revenue grew 7%, in Latin America 16%, while Asia Pacific showed only +1% due to a 9% decline in price/mix.
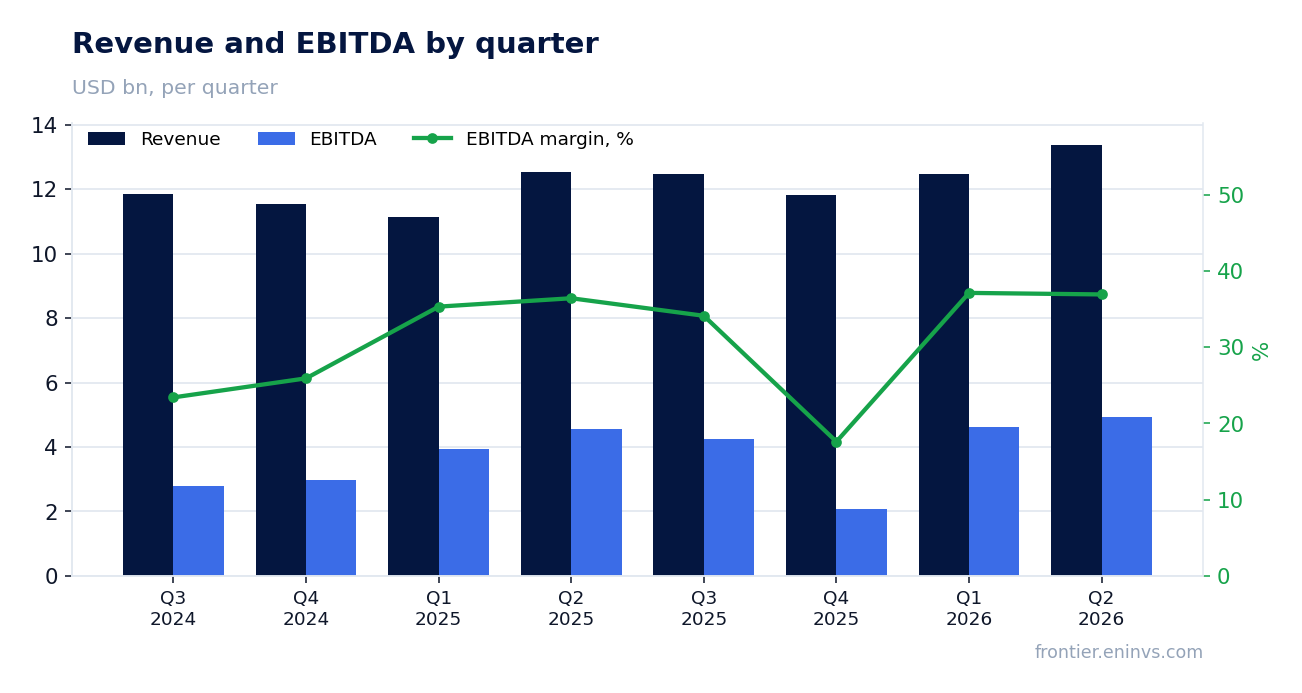
EBITDA margin expanded to 45.7% from 36.4% a year ago, but GAAP operating margin is only 34.9%
EBITDA in Q2 2026 was $4,938 million, up 34.0% YoY. EBITDA margin expanded to 45.7% from 36.4% in Q2 2025. However, GAAP operating margin is 34.9% versus 34.1% a year ago, significantly lower than EBITDA margin due to depreciation and other items.
The company explains the expansion of comparable operating margin (non-GAAP) by organic revenue growth, lower operating expenses, and favorable currency tailwinds, partially offset by higher input costs and increased marketing investments. The report also notes that operating margin includes items impacting comparability and currency tailwinds.
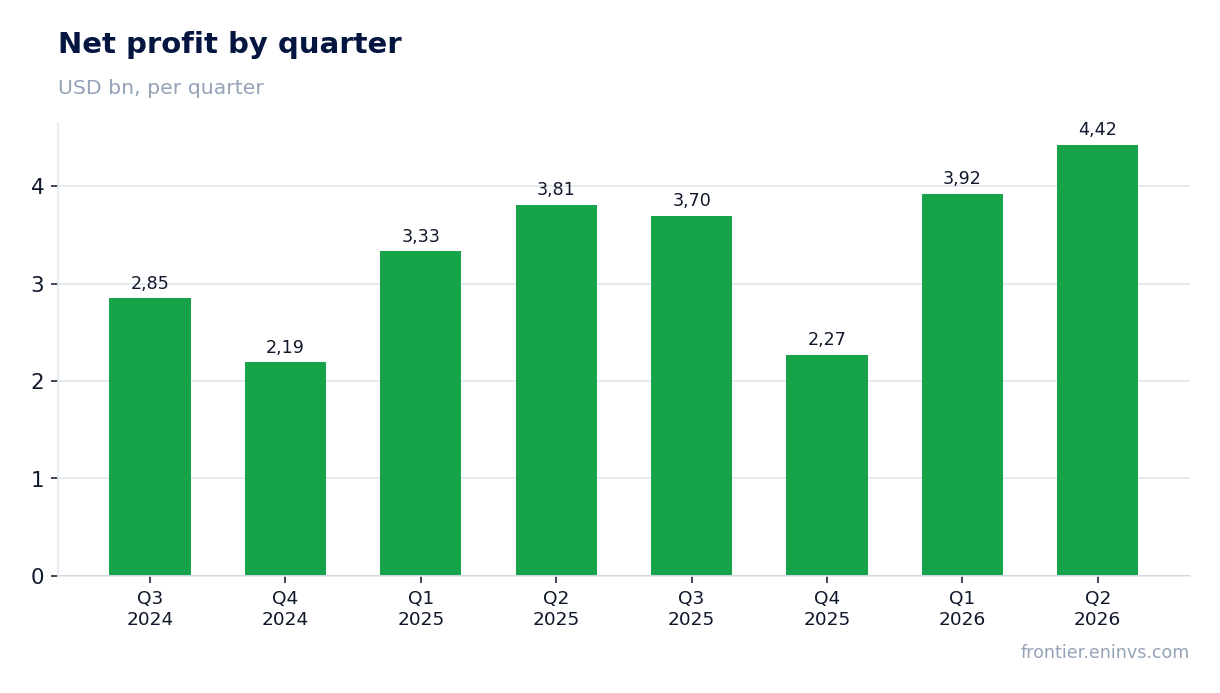
Net profit +16.1% to $4,425 million, but including one-off items
Net income attributable to COCA COLA CO shareholders in Q2 2026 rose 16.1% YoY to $4,425 million. EPS was $1.03 (up 16%), comparable EPS (non-GAAP) was $0.97 (up 11%).
The report notes that profit was affected by items impacting comparability, including a net gain of $11 million from equity investments, as well as a 4-percentage-point currency tailwind for GAAP EPS. Excluding these factors, comparable EPS grew 11%, still above revenue growth.
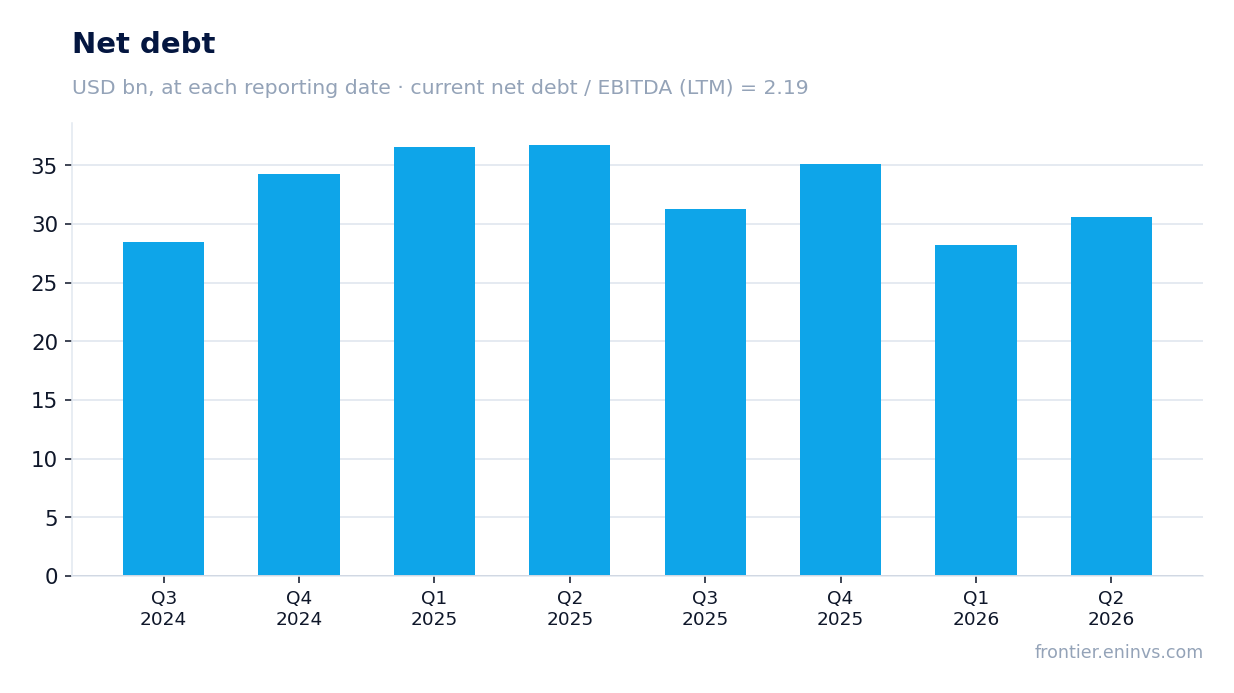
Leverage: 2.19 EBITDA LTM – above the three-year average
Net debt at the latest balance sheet date was $35,122 million, up $2.4 billion from the previous reporting date but down $6.1 billion from a year ago. Net debt to EBITDA for the trailing twelve months is 2.19.
This level is higher than the three-year average for EV/EBITDA (24.4), but direct comparison is not valid as they are different metrics. Nevertheless, leverage remains moderate for a company with such cash flow.
Free cash flow for the half-year is $6.9 billion, but dividends consume a large part
In H1 2026, operating cash flow was $7,543 million, capital expenditures $684 million, resulting in free cash flow (non-GAAP) of $6.9 billion. The company reaffirmed its 2026 free cash flow guidance of approximately $12.4 billion.
During the same period, the company paid dividends of $4,562 million, about 66% of free cash flow. Dividend yield for the trailing twelve months is 2.36%, lower than the market average, but acceptable for such a stable company.
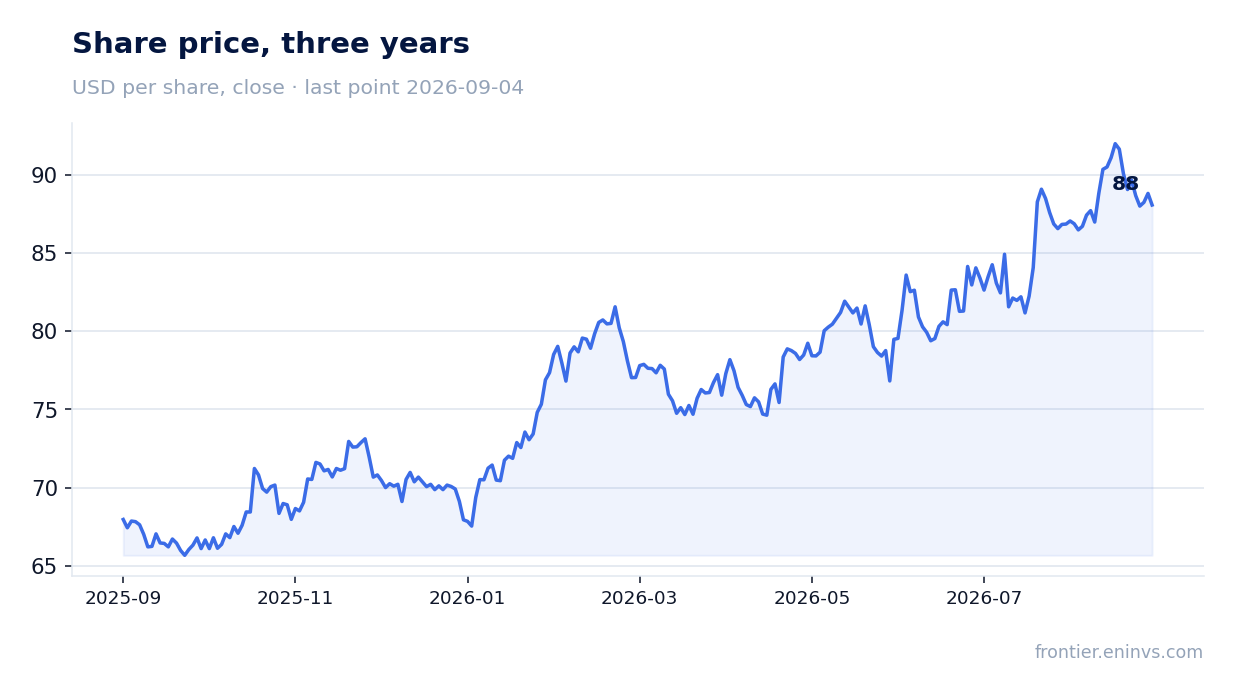
Valuation: EV/EBITDA 25.8 vs. 24.4 three-year average – expensive relative to history
COCA COLA CO's market capitalization is $378,843 million. EV/EBITDA LTM is 25.8, above the three-year average (24.4). P/E LTM is 26.5. The stock trades at a premium to its own history.
Our model calculation (on the portal's model) shows upside to fair value of +9%. This suggests the current price is close to fair value but does not offer a significant margin of safety. After the earnings release, the stock rose 5.0% on the day and another 4.8% by September 4, 2026.
Valuation on the latest reported figures
| Metric | Value |
|---|---|
| Market cap | 379 bn USD |
| P/E (LTM) | 26.5 |
| EV/EBITDA (LTM) | 25.8 |
| P/B | 11.78 |
| Net debt / EBITDA (LTM) | 2.19 |
| Operating cash flow (LTM) | 7.40 bn |
| ROE | 50.7% |
| Dividend yield (12m) | 2.4% |
| EV/EBITDA, 3-year average | 24.4 |
Bottom line
COCA COLA CO delivered a strong quarter: revenue and profit grew at double-digit rates, EBITDA margin expanded significantly, and free cash flow remains stable. However, part of the growth is due to one-off factors – the World Cup and currency tailwinds. Leverage is moderate, but multiples are above its own history, limiting upside potential. The stock looks 'rather attractive': if the company sustains growth and margins, the current price is justified, but significant re-rating requires additional drivers.
Open the company's financial profile KO →
See also: market overview · valuation map · stock screeners