Coca-Cola: revenue accelerated to +7.4%, but costs and taxes absorbed the operating gain

On 27 October Coca-Cola reported third-quarter 2026 results. Revenue rose 7.4% year on year to $13,380 million, operating profit to $4,465 million and net profit to $4,009 million (+8.5%). Growth accelerated from +6.7% in the second quarter, but the net margin added only 0.3 pp to 30.0% as the tax rate rose from 12.0% to 16.1%. The share trades at 26.3 EV/EBITDA against its own three-year average of 24.4, the dividend yield is 2.3%, and the portal model puts upside to fair value at just +5% – on that valuation the stock looks neutral.
Key takeaways
— Revenue accelerated to +7.4% on volume and concentrate, not on price
— Operating margin rose to 33.4%, but taxes and a smaller minority share absorbed part of the effect
— Latin America delivered a quarter of revenue and almost all of the profit growth
— Nine-month free cash flow reached $11.4 billion and guidance was raised to $13.0 billion
— Dividend yield of 2.3% against $6.8 billion paid in nine months
— EV/EBITDA of 26.3 is 8% above its own three-year average of 24.4
— Leverage of 2.16 EBITDA LTM is moderate, but 2027 guidance flags an 8% divestiture headwind
Attractiveness
Key figures, USD bn
| Metric | Q3 2025 | Q4 2026 | Change |
|---|---|---|---|
| Revenue | 12.5 | 13.4 | +7.4% |
| EBITDA | 4.25 | — | — |
| Operating profit | 3.98 | 4.46 | +12.1% |
| Net profit | 3.70 | 4.01 | +8.5% |
| Operating cash flow | 5.04 | — | — |
| Capex | 0.48 | — | — |
| EBITDA margin | 34.1% | — | — |
| Net margin | 29.7% | 30.0% | +0.3 pp |
Revenue accelerated to +7.4% on volume and concentrate, not on price
Third-quarter 2026 revenue reached $13,380 million, up 7.4% year on year. That is an acceleration from 6.7% in the second quarter. Organic revenue grew the same 7%, so acquisitions and divestitures netted to zero, while currency added 1%.
Volume was the driver: concentrate sales rose 7% while price/mix added only 1%. Concentrate sales ran 2 pp ahead of unit case volume on shipment timing. Unit case volume grew 5%, led by India, China, Mexico and Brazil.
By segment, Latin America grew fastest at 25% in dollars, of which 9% was currency and 7% price. North America added 3% on flat volume, Asia Pacific 4%, EMEA 4%, and Bottling Investments 13%.
For the shareholder the key point is that growth rests on volume rather than pricing. That is more durable but monetises more slowly – with price up only 1%, revenue tracks volume and operating leverage works less.
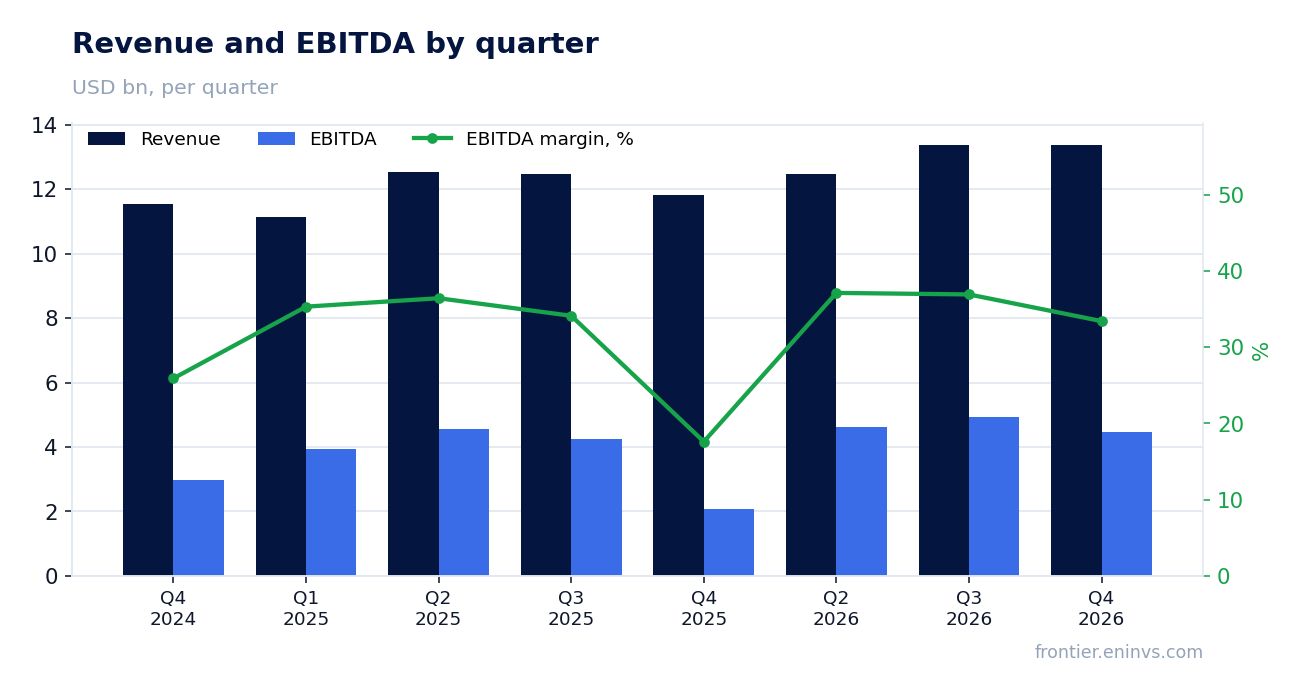
Operating margin rose to 33.4%, but taxes and a smaller minority share absorbed part of the effect
Operating profit rose 12% to $4,465 million, lifting the operating margin to 33.4% from 32.0%. The comparable margin was 32.9% against 31.9%. Organic revenue growth and currency tailwinds drove the expansion, partly offset by higher marketing and operating expenses.
Cost of goods sold rose 3%, slower than revenue, which was the main margin contributor. SG&A rose 10%, faster than revenue, and is the main constraint. Other operating charges fell 83% to $10 million.
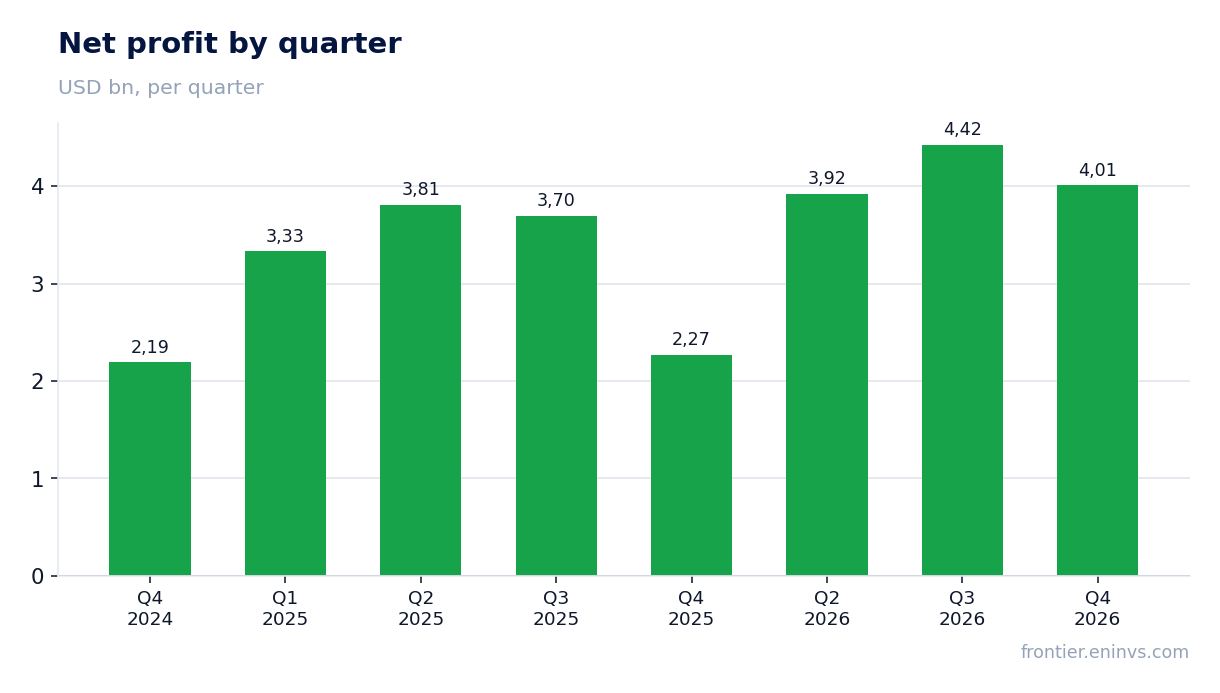
Less reaches net profit: it rose 8.5% to $4,009 million even though operating profit added 12%. Taxes rose 56% to $777 million, lifting the effective rate from 12.0% to 16.1%. The minority interest turned positive at $47 million from minus $13 million a year earlier.
The net margin barely moved – 30.0% against 29.7%. Operating leverage worked, but only a small part reached the shareholder: the gap between +12% operating and +8.5% net profit is taxes and minorities, not the business.
Latin America delivered a quarter of revenue and almost all of the profit growth
Latin America delivered $1,958 million of revenue, up 25%, and $1,152 million of operating profit, up 29%. That is the best segment result and the main source of group profit growth. Volume rose 6%, price/mix 7% and currency added 9%.
North America, the largest market, produced $5,386 million of revenue (+3%) and $1,766 million of operating profit (+5%). Volume was flat: Trademark Coca-Cola growth offset declines in water, sports, coffee and tea. Price added only 1%.
Bottling Investments grew operating profit 261% to $205 million – a small absolute but a visible contribution. Asia Pacific added 8% operating profit on +4% revenue, EMEA 7% on +4%.
The concentration of growth in one region is a durability risk. Latin America carried the quarter on currency and price, while flat-volume North America shows how hard growth is on mature markets.
Nine-month free cash flow reached $11.4 billion and guidance was raised to $13.0 billion
Nine-month 2026 operating cash flow was $12,471 million against $3,652 million a year earlier, with free cash flow of $11.4 billion. The gap is working capital: last year the change in operating assets and liabilities was an $8,040 million outflow, now $498 million.
Nine-month capex was $1,063 million, below last year's $1,230 million. The company raised 2026 free cash flow guidance to at least $13.0 billion, from at least $15.2 billion of operating cash and about $2.2 billion of capex. The prior guide was $12.4 billion.
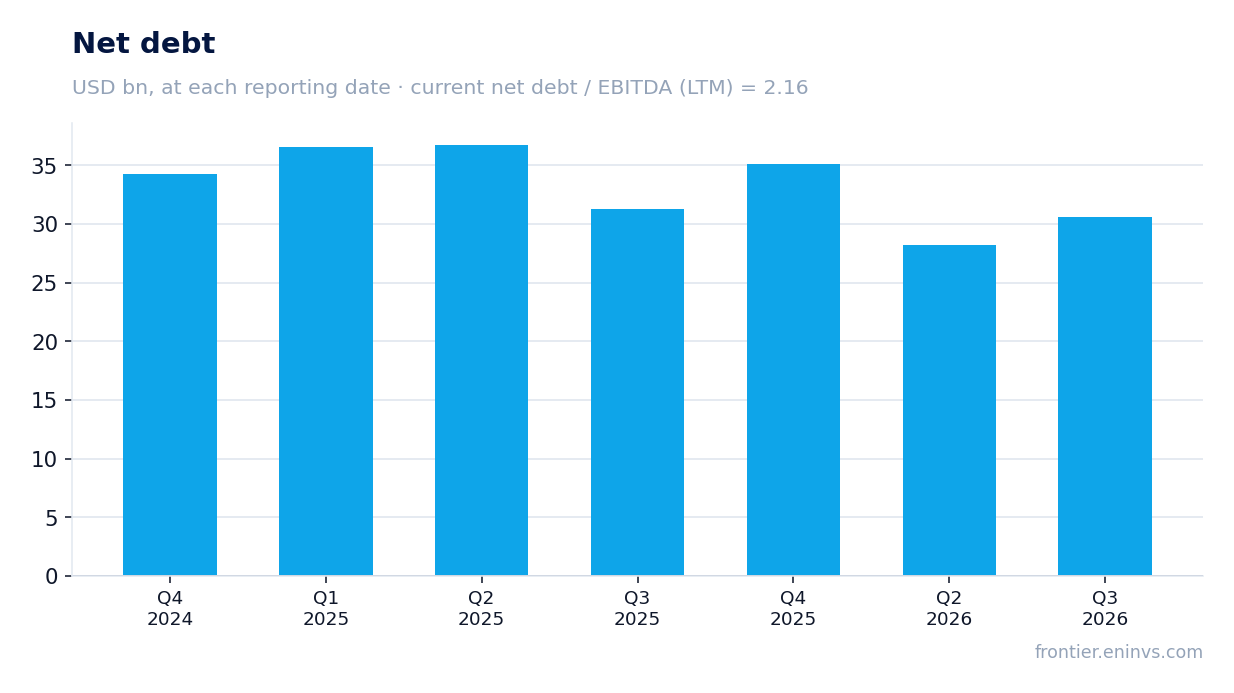
The balance sheet carries $36,623 million of long-term debt and $4,923 million of current maturities against $13,454 million of cash. Net debt on the latest annual balance sheet was $35,122 million, or 2.16 EBITDA LTM. Quarterly interest expense fell 9% to $354 million.
Cash flow is the strong part of the report: it grew on working-capital normalisation rather than one-off sales. That also means last year's base was distorted, and the durability of the flow will only be confirmed in the fourth quarter.
Dividend yield of 2.3% against $6.8 billion paid in nine months
Nine-month 2026 dividends paid were $6,842 million against $4,391 million a year earlier. A 56% rise in payouts against 14% nine-month net profit growth means the payout ratio rose. The company does not disclose the full-year figure, but the pace clearly outruns profit.
The trailing twelve-month dividend yield is 2.3%. That is modest for a consumer name and below the yield we consider fair for this growth story. At the pre-release close of $92.70 and LTM net profit of $14,629 million, the LTM P/E is 26.8.
Our estimate: at the current payout pace and LTM profit, the annual dividend stays near its present level, and its growth is capped by the payout ratio. The key is whether free cash flow holds at $13.0 billion – that, not accounting profit, funds the payout.
A weaker fourth-quarter free cash flow or large acquisitions could reduce the payout. 2027 guidance already embeds an 8% divestiture headwind to comparable revenue, which limits the base for dividend growth.
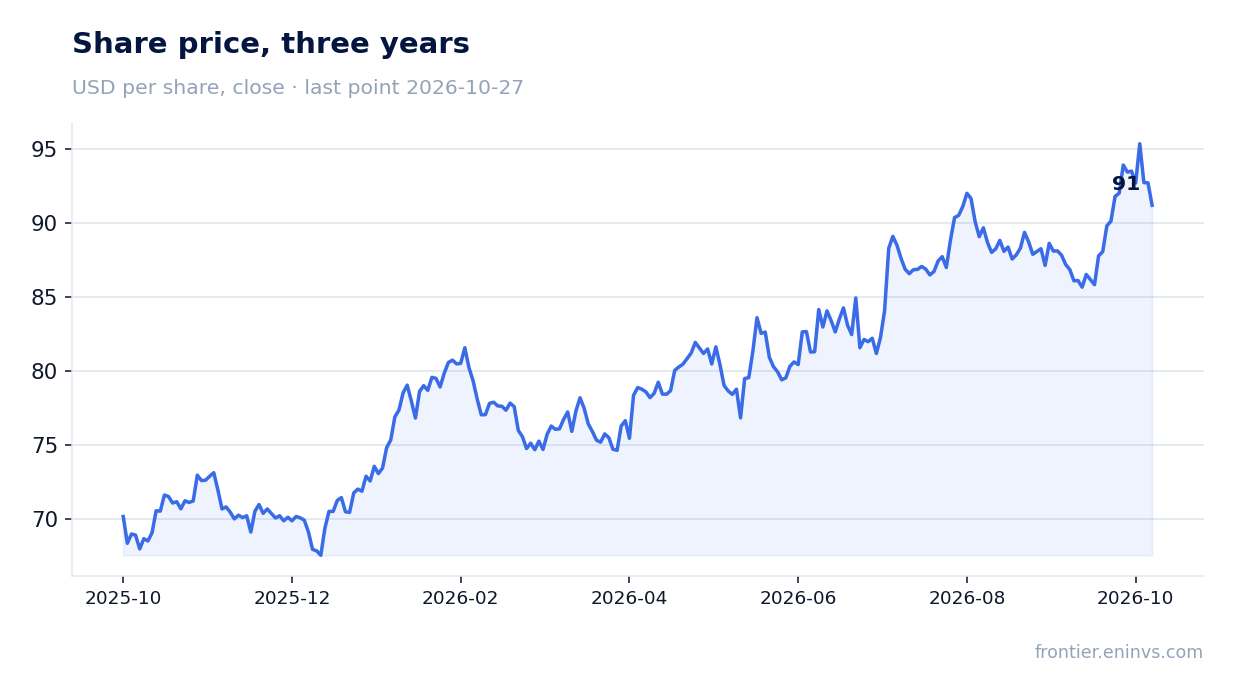
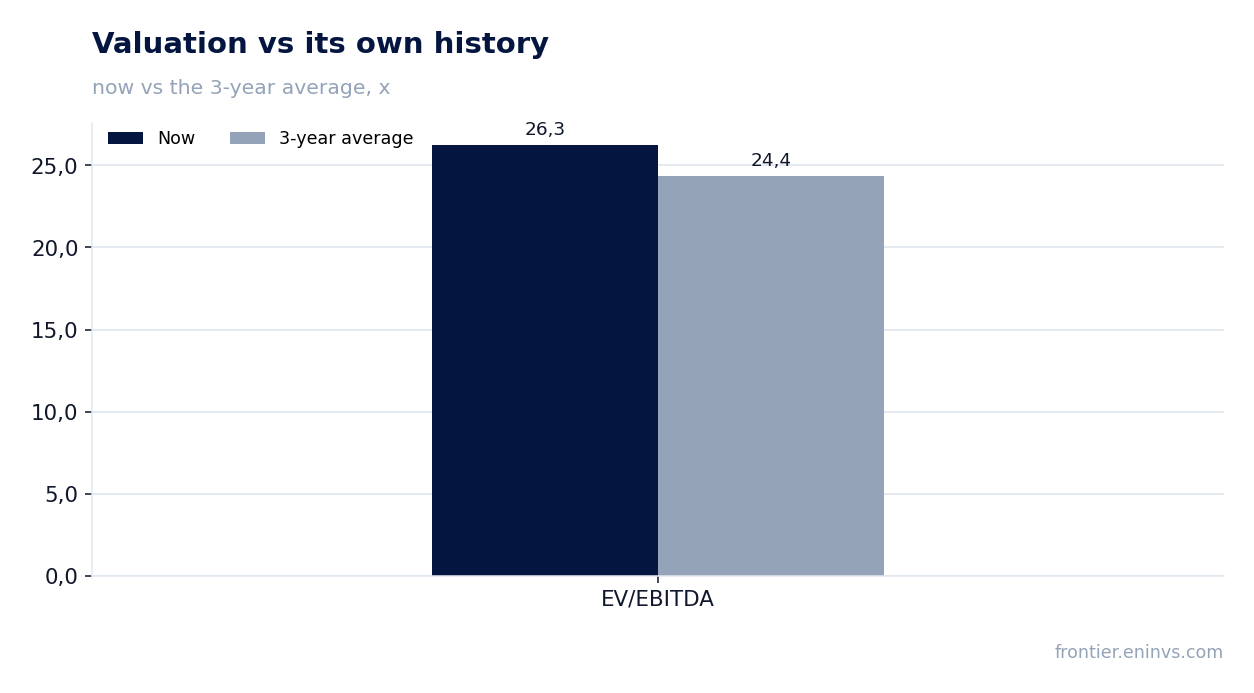
EV/EBITDA of 26.3 is 8% above its own three-year average of 24.4
LTM EV/EBITDA is 26.3 against its own three-year average of 24.4 – 8% above. The share is more expensive than its own recent history. LTM P/E is 26.8 and market capitalisation is $392,221 million.
The portal model puts upside to fair value at +5%. The model weighs EBITDA growth against the target multiple and market cap. This is our own estimate, not a market consensus or a target price.
The market reaction was muted: the share lost 1.6% on the release day and has stayed there. Revenue growth and the raised guidance did not outweigh margin and tax concerns.
A multiple above its own history with modest model upside means further gains require faster profit growth, not just revenue. While net profit grows slower than operating profit, the multiple is unlikely to compress.
Leverage of 2.16 EBITDA LTM is moderate, but 2027 guidance flags an 8% divestiture headwind
Net debt on the latest annual balance sheet was $35,122 million, or 2.16 EBITDA LTM. That is moderate for a company with this cash flow. We do not assess the direction of the ratio: no earlier value is in the facts.
The company raised 2026 organic revenue guidance to at least 5% growth and comparable EPS to at least 11%. Free cash flow guidance is at least $13.0 billion. That is the main positive of the report.
However, 2027 guidance already embeds an 8% divestiture headwind to comparable revenue and a slight currency headwind. The company will only give full 2027 guidance with the fourth-quarter report. That limits visibility.
The fourth quarter of 2026 will be six days shorter than a year earlier, which mechanically pressures the revenue comparison. Watch whether the operating margin holds above 33% in the shorter quarter and whether net profit grows faster than operating profit.
Valuation on the latest reported figures
| Metric | Value |
|---|---|
| Market cap | 392 bn USD |
| P/E (LTM) | 26.8 |
| EV/EBITDA (LTM) | 26.3 |
| P/B | 12.19 |
| Net debt / EBITDA (LTM) | 2.16 |
| ROE | 14.5% |
| Dividend yield (12m) | 2.3% |
| EV/EBITDA, 3-year average | 24.4 |
Bottom line
The strong part is revenue acceleration to +7.4% on volume and the raised free cash flow guidance of $13.0 billion. The weak part is that only +8.5% of net profit reached the shareholder: taxes and minorities absorbed the gap to +12% operating profit. The 2.3% dividend yield is modest and EV/EBITDA of 26.3 is above its own three-year average of 24.4. The portal model shows +5% upside, and on that valuation the stock looks neutral: further gains need faster profit growth, not just revenue.
Open the company's financial profile KO →
See also: market overview · valuation map · stock screeners