Lumentum Holdings Inc.: revenue up 136.5%, but systems, not components, did almost all the growing

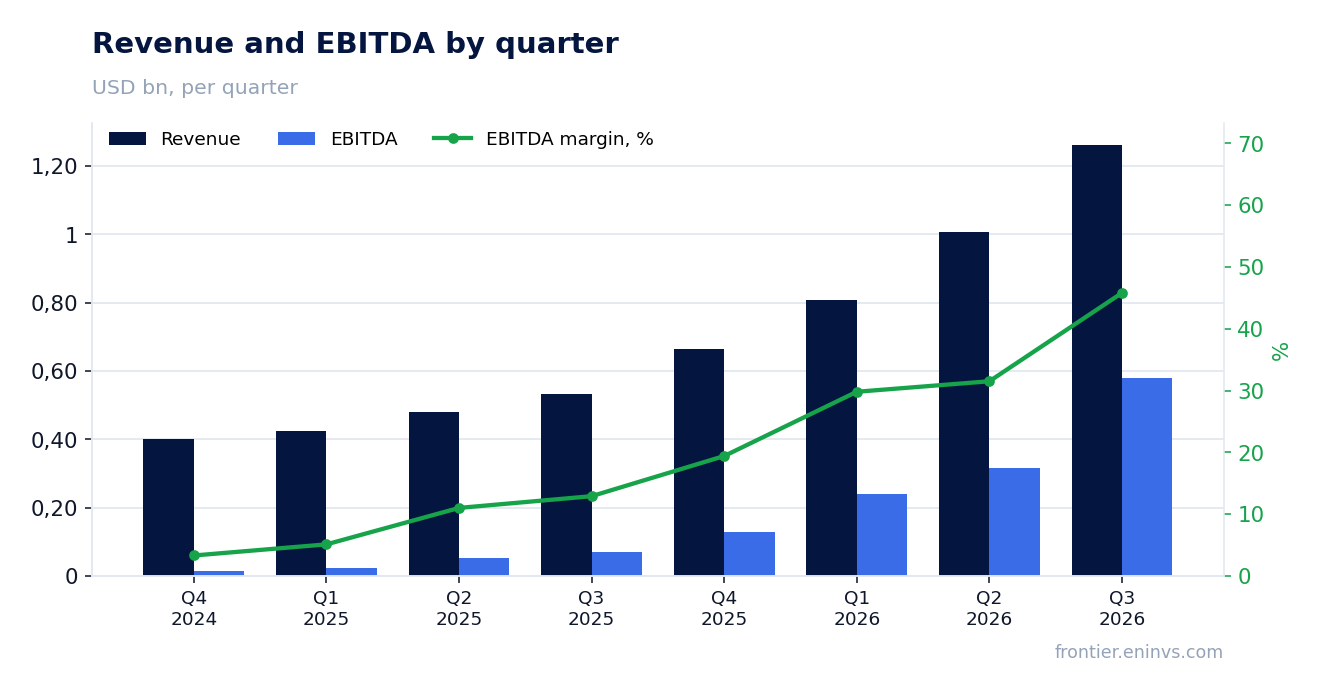
On 2 November Lumentum Holdings Inc. reported results for the first quarter of fiscal 2027 ended 26 September 2026. Revenue was $1,262.6 million, EBITDA $578.0 million and net income $360.3 million; year on year revenue rose 136.5%, EBITDA 738.9% and net income 8,478.6%. The EBITDA margin climbed to 45.8% from 12.9%, but $146.7 million of operating expenses was non-cash compensation, including an $89.4 million one-off award modification tied to an executive retirement. At 40.0x trailing-twelve-month EBITDA and with the shares down 18.6% on the release day, the stock looks neutral: the growth is real, but the price already assumes it continues.
Key takeaways
— Revenue rose 136.5% year on year, and systems, not components, delivered almost all of the increase
— The 45.8% EBITDA margin rests on a 51.0% gross margin, but $146.7 million of expenses is not cash
— Net income of $360.3 million is clean of one-offs, against just $4.2 million a year earlier
— Leverage of 1.58x trailing EBITDA is moderate, but cash fell by $758.8 million in the quarter
— Guidance for the second quarter of fiscal 2027 is $1,575–1,625 million of revenue and an operating margin above 45%
— At 40.0x trailing EBITDA the valuation leaves no room for a supply stumble
Attractiveness
Key figures, USD bn
| Metric | Q3 2025 | Q3 2026 | Change |
|---|---|---|---|
| Revenue | 0.53 | 1.26 | +136.5% |
| EBITDA | 0.07 | 0.58 | +738.9% |
| Operating profit | 0.01 | 0.36 | +5270.1% |
| Net profit | 0.00 | 0.36 | +8478.6% |
| Operating cash flow | 0.06 | — | — |
| Capex | 0.08 | — | — |
| EBITDA margin | 12.9% | 45.8% | +32.9 pp |
| Net margin | 0.8% | 28.5% | +27.7 pp |
Revenue rose 136.5% year on year, and systems, not components, delivered almost all of the increase
Revenue in the first quarter of fiscal 2027 was $1,262.6 million against $533.8 million a year earlier, a rise of 136.5%. Sequentially the gain is smaller at 25.5%, but still large for a company with roughly a billion-dollar quarterly base. Year-on-year acceleration continues: growth was 109.3% in the fourth quarter of fiscal 2026 and 136.5% in the first quarter of fiscal 2026.
The product split shows where the growth came from. Systems brought in $508.4 million, or 40.3% of revenue, and grew 228.8% year on year. Components delivered $754.2 million but added only 98.9%. In other words, with overall revenue more than doubling, systems more than tripled while components doubled.
The press release names the specific drivers: pump lasers and optical circuit switches (OCS), plus a second major NPO/CPO win backed by purchase commitments exceeding $5 billion. That is not a vague statement about demand but a link between revenue and specific contracts, which makes next quarter's guidance more tangible.
The 45.8% EBITDA margin rests on a 51.0% gross margin, but $146.7 million of expenses is not cash
GAAP gross margin rose to 51.0% from 34.0% a year earlier, and non-GAAP gross margin to 53.2% from 39.4%. GAAP operating margin was 28.5% against 1.3%, and the EBITDA margin 45.8% against 12.9%. The jump reflects not only revenue growth but also operating leverage: a large share of costs is fixed.
Inside operating expenses, however, $146.7 million was non-cash compensation and related payroll taxes, including an $89.4 million one-off award modification tied to an executive retirement. Without that item expenses would be noticeably lower and the margin higher. For judging the durability of the business, the non-GAAP operating margin of 42.3% matters more, and it is still very high.
The company notes improving gross margin in cloud modules. That means growth is no longer purely volumetric: the revenue mix within the segment is improving too. But the gap between GAAP and non-GAAP figures remains wide, and it has to be kept in mind when comparing quarters.
Net income of $360.3 million is clean of one-offs, against just $4.2 million a year earlier
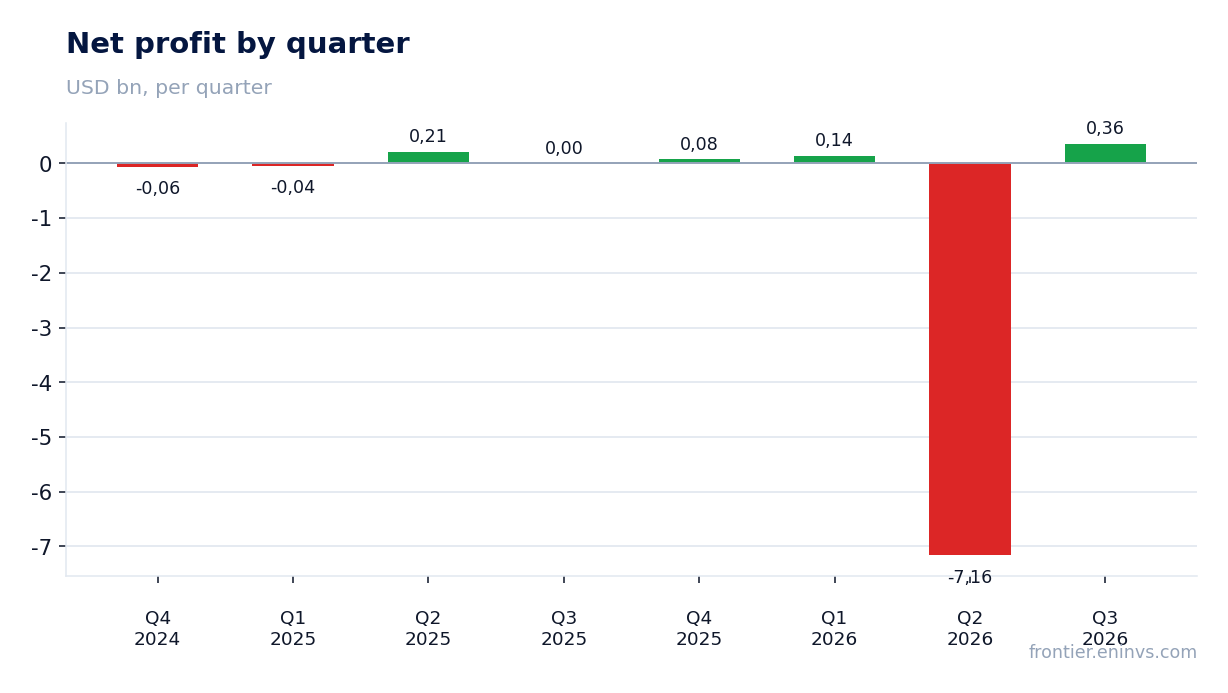
GAAP net income was $360.3 million against $4.2 million a year earlier, a rise of 8,478.6%. The gap reflects the low base of last year, when the company was only reaching operating break-even. This quarter profit was supported both by operating income of $359.8 million and by positive other income of $10.5 million.
There are few one-off items distorting profit: the sale of a product line brought $6.9 million, immaterial for a company of this scale. The main contribution to profit came from the operating business, not from financial operations. That distinguishes the quarter from the previous one, when a $7.2 billion loss was caused by a debt extinguishment charge rather than operations.
Non-GAAP net income was $461.1 million, or $4.57 per diluted share. The difference from GAAP profit is mostly non-cash compensation and amortisation of acquired intangibles. For a holder what matters more is that the business generates profit both before and after these items.
Leverage of 1.58x trailing EBITDA is moderate, but cash fell by $758.8 million in the quarter
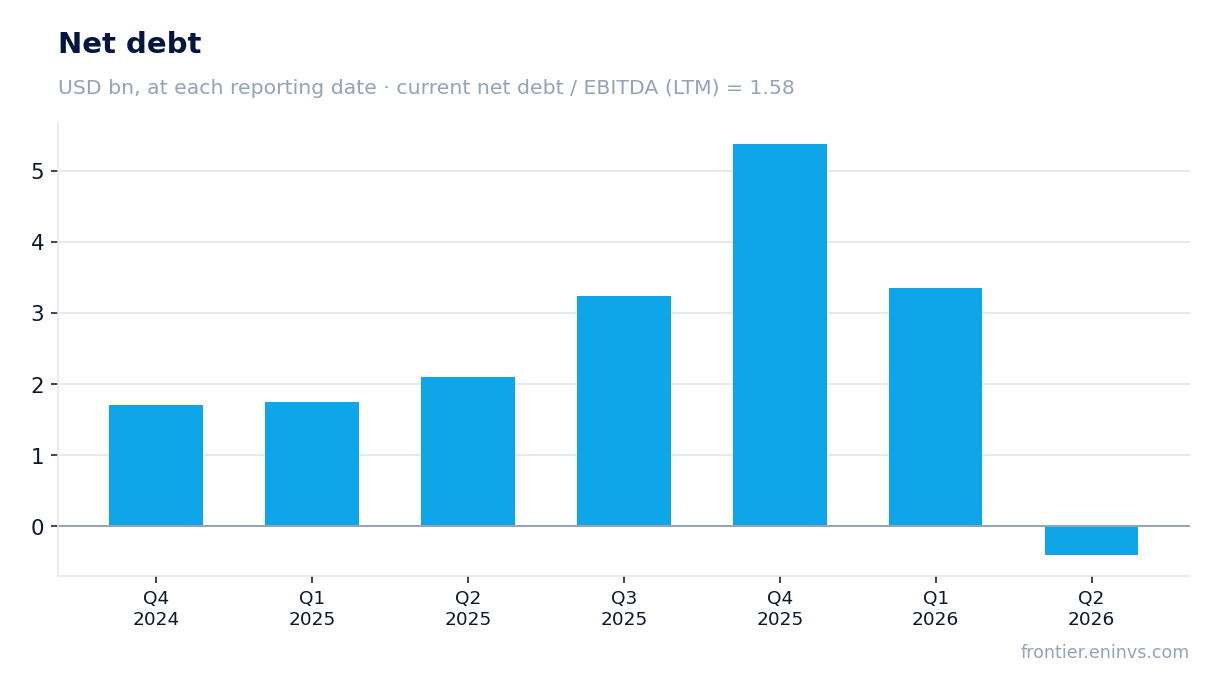
Net debt at the latest annual reporting date was $2,098.1 million, equal to 1.58x trailing-twelve-month EBITDA. That is a moderate level for a growing company and puts no pressure on the balance sheet. Interest expense for the quarter was only $2.4 million, while interest and other income brought $12.9 million, so financial operations were profitable.
At the same time cash and short-term investments fell by $758.8 million in the quarter, to $2.0 billion. The release does not disclose operating cash flow or capital expenditure for this quarter, so the source of the cash decline cannot be determined from the available data. It is worth watching: revenue growth requires working capital and capacity.
The balance sheet remains solid: total assets of $7,274.0 million, equity of $4,572.6 million, long-term debt of just $39.3 million against a current portion of $1,360.3 million. Return on equity of 31.3% is high for a manufacturer. The risk here is not debt but how quickly the growing business absorbs cash.
Guidance for the second quarter of fiscal 2027 is $1,575–1,625 million of revenue and an operating margin above 45%
The company guides second-quarter fiscal 2027 revenue to $1,575–1,625 million. That implies an increase of about $350 million over the first quarter – more than the company's entire quarterly revenue two years ago, as the CEO notes. Such guidance assumes acceleration continues rather than fades.
Non-GAAP operating margin is expected at 45.0–46.0%, above the 42.3% of the quarter just reported. Non-GAAP diluted earnings per share are guided to $5.90–6.20 against $4.57 in the first quarter. The forecast rests on the same drivers: pump lasers, OCS and cloud modules.
The reliance on specific contracts – a second major NPO/CPO win with commitments above $5 billion and expanding OCS visibility – makes the guidance credible. But delivering such a plan requires timely supply and capacity, and the company already mentions costs of ramping its Greensboro facility. That is the main operational risk for the next quarter.
At 40.0x trailing EBITDA the valuation leaves no room for a supply stumble
The company's market capitalisation is $51.1 billion and EV/EBITDA on trailing-twelve-month figures is 40.0x. That is a high valuation, assuming revenue and margin growth continue in coming quarters. The facts contain no three-year average multiple, so it is impossible to say whether the current level is above or below its own historical range.
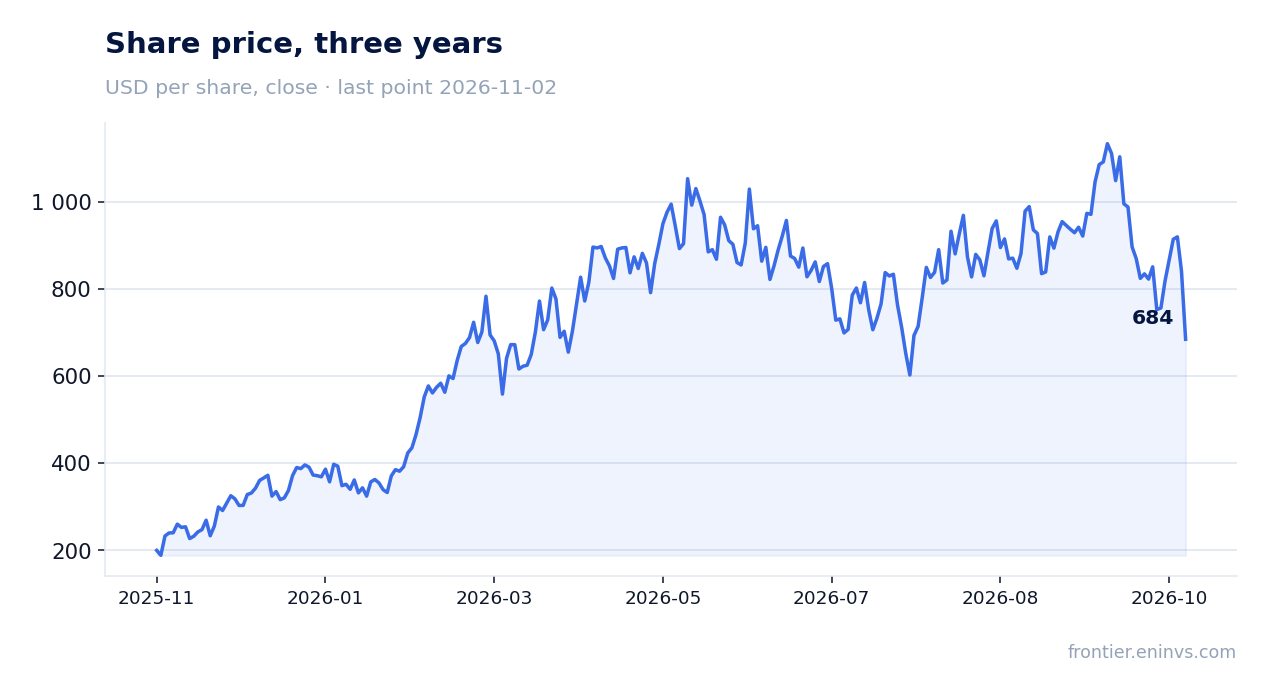
The share price fell 18.6% on the day of the release and stayed there through 2 November. The market reacted to something in the report or guidance, but the exact cause is not disclosed in the available data. Perhaps investors expected even stronger guidance, or fear that systems growth is less durable than components growth.
At 40.0x even a modest slowdown in growth or a decline in margin would trigger a re-rating. The margin of safety in the price is thin, and that is the main argument against buying at current levels despite the strong operating results.
Valuation on the latest reported figures
| Metric | Value |
|---|---|
| Market cap | 51.1 bn USD |
| EV/EBITDA (LTM) | 40.0 |
| P/B | 45.00 |
| Net debt / EBITDA (LTM) | 1.58 |
| ROE | 31.3% |
Bottom line
The quarter was strong on every operating measure: revenue rose 136.5%, the EBITDA margin reached 45.8% and net income was $360.3 million. Growth rests on specific contracts and guidance for the next quarter implies further acceleration. However, $146.7 million of expenses was non-cash compensation, including an $89.4 million one-off, and cash fell by $758.8 million in the quarter with no cash-flow disclosure. At 40.0x trailing EBITDA and with the shares down 18.6% on the release day, the stock looks neutral: the business is growing fast, but the price already reflects it and the margin of safety is thin.
Open the company's financial profile LITE →
See also: market overview · valuation map · stock screeners