ELI LILLY & Co: revenue up 38.6%, but $4.2bn of acquired IPR&D charges ate almost all of the profit gain

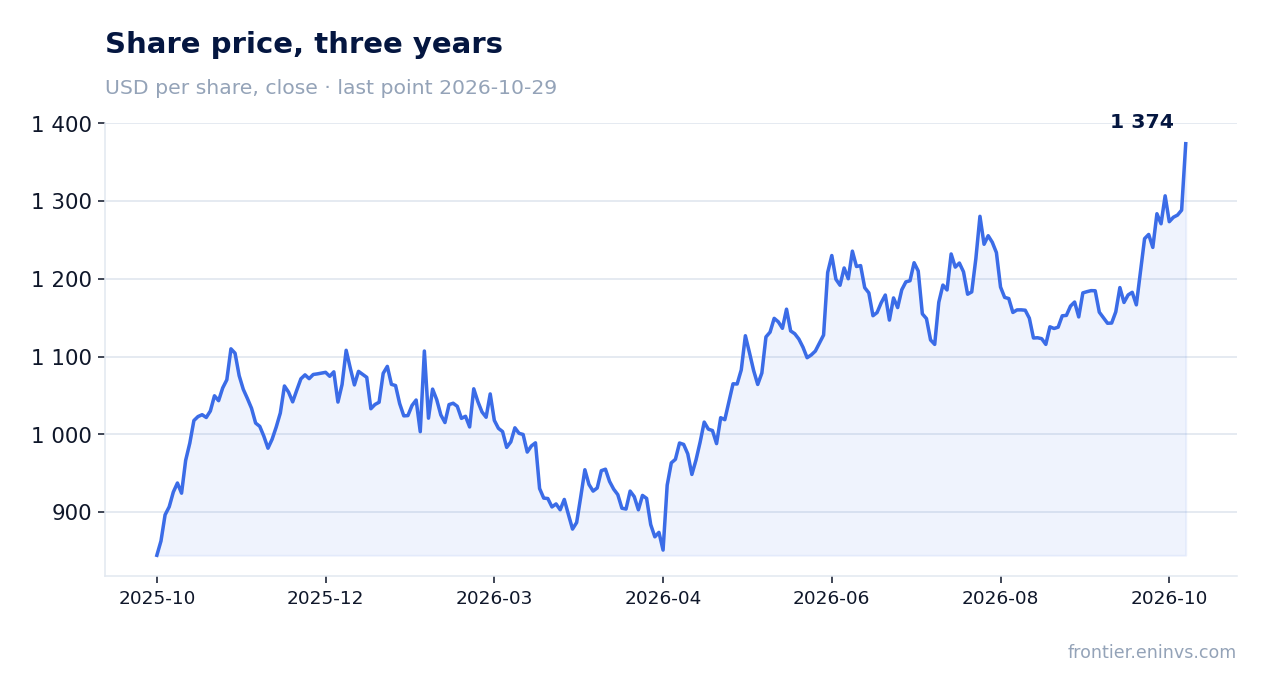
On 29 October ELI LILLY & Co reported third-quarter 2026 results. Revenue reached $24,397m, up 38.6% year on year, and net profit was $6,451m, or +15.6%. Revenue growth decelerated from 47.7% in the second quarter, while $4.2bn of acquired IPR&D charges and a net margin decline to 26.4% from 31.7% a year earlier held back profit. Still, the stock trades below its own three-year history on EV/EBITDA, and the portal's model puts upside to fair value at +15%, so the share looks rather attractive.
Key takeaways
— Revenue rose 38.6% on volume, not price: volume grew 53% while realised prices fell 15%
— Mounjaro brought in $10.7bn, of which $5.7bn came outside the US, where volume rose 93%
— Net profit grew only 15.6% because $4.2bn went to charges on the AtaiBeckley and Curevo acquisitions
— The margin compressed to 26.4% from 31.7% a year earlier on those one-off charges and a higher 23.3% tax rate
— Operating cash flow for the quarter was $11,397m, but capex in the second quarter reached $6,215m
— Net debt fell to $44.6bn from $46.0bn at end-June, and net debt/EBITDA LTM stands at 1.26
— EV/EBITDA LTM of 35.7 is 41% below its own three-year average of 60.3, so the stock is cheaper than its history
Attractiveness
Key figures, USD bn
| Metric | Q3 2025 | Q3 2026 | Change |
|---|---|---|---|
| Revenue | 17.6 | 24.4 | +38.6% |
| EBITDA | 7.70 | — | — |
| Operating profit | 7.23 | — | — |
| Net profit | 5.58 | 6.45 | +15.6% |
| Operating cash flow | 8.84 | 11.4 | +29.0% |
| Capex | 2.09 | — | — |
| EBITDA margin | 43.8% | — | — |
| Net margin | 31.7% | 26.4% | -5.3 pp |
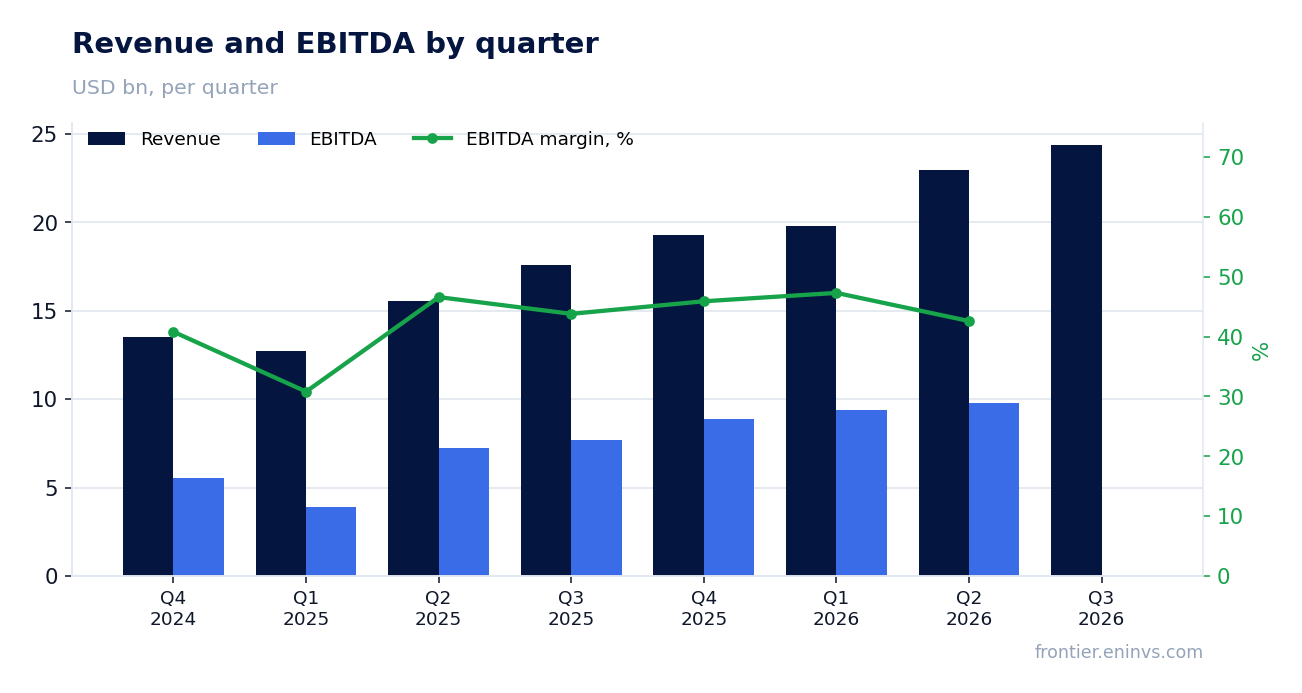
Revenue rose 38.6% on volume, not price: volume grew 53% while realised prices fell 15%
Third-quarter 2026 revenue was $24,397m, up 38.6% year on year. Growth decelerated from 47.7% in the second quarter but remains high. Volume was the driver, rising 53%, while realised prices fell 15%.
US revenue rose 34% to $15.1bn on a 41% volume increase and a 7% price decline. Outside the US revenue grew 47% to $9.3bn, volume rose 76% and prices fell 29%. The report attributes the overseas price decline to Mounjaro's inclusion on China's reimbursement list.
Key products generated $17.1bn. Immunology, oncology and neuroscience doubled revenue. This mix means the company is gaining share through volume rather than price, which limits room to expand the margin.
Mounjaro brought in $10.7bn, of which $5.7bn came outside the US, where volume rose 93%
Mounjaro sales in the third quarter were $10,723m, up 65% year on year. In the US the product generated $5.0bn, up 41% on demand. Outside the US revenue rose 93% to $5.7bn, the main contribution to overall growth.
Zepbound in the US generated $5,352m, up 48% year on year on demand with lower realised prices. Together the two products account for about two-thirds of quarterly revenue, and concentration in them remains the key driver of both growth and risk.
Newer products – Kisunla, Ebglyss, Jaypirca, Omvoh, Foundayo and Inluriyo – are growing faster but still contribute hundreds of millions of dollars. Kisunla brought in $193m, Ebglyss $202m and Foundayo $184m. Portfolio diversification is progressing, but reliance on Mounjaro and Zepbound persists.
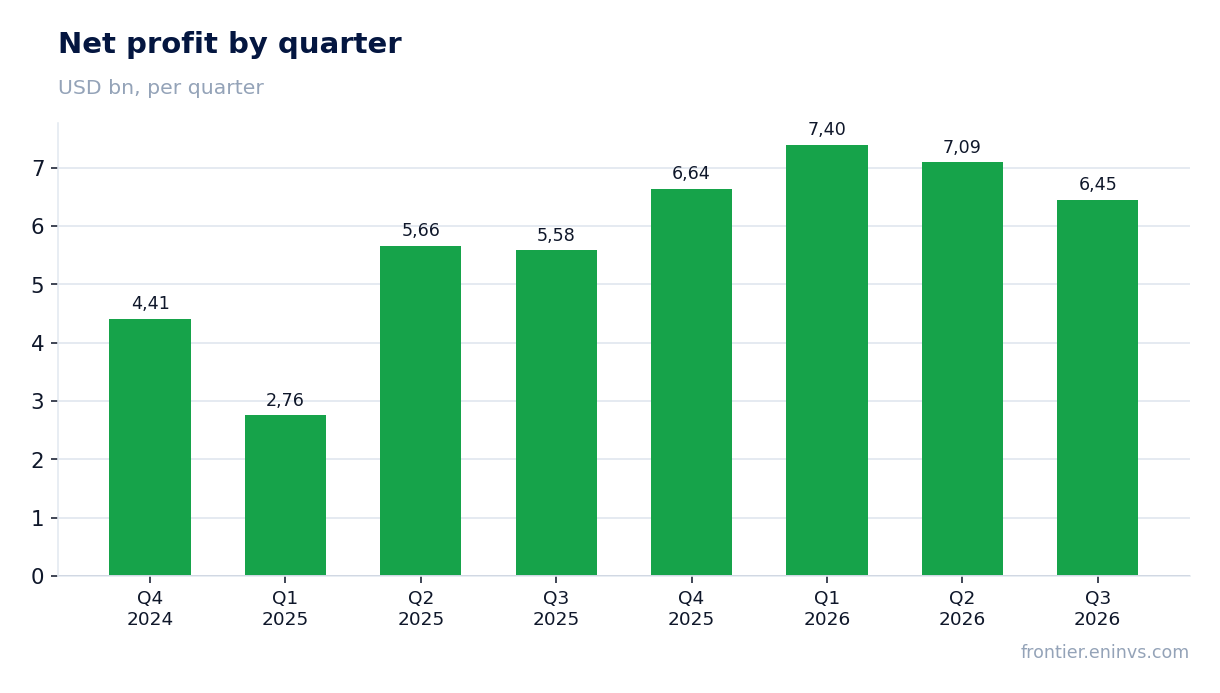
Net profit grew only 15.6% because $4.2bn went to charges on the AtaiBeckley and Curevo acquisitions
Third-quarter net profit was $6,451m, up 15.6% year on year. Against 38.6% revenue growth that looks modest, and the reason is one-off charges. Acquired IPR&D expense reached $4.2bn versus $656m a year earlier, mainly on the AtaiBeckley and Curevo deals.
The gap between reported and adjusted profit confirms the one-off nature. Adjusted net profit was $6,679m, or $7.48 per share, versus $7.22 reported. Adjusted profit grew only 6% because it too includes $4.57 per share of IPR&D charges.
Operating profit rose 17% to $8,608m, but the tax rate climbed to 23.3% from 22.8% on non-deductible charges. Without one-off items profit would have grown faster than revenue, but the reported quarter shows that business-development deals are costly and directly reduce profit.
The margin compressed to 26.4% from 31.7% a year earlier on those one-off charges and a higher 23.3% tax rate
The third-quarter net margin was 26.4% versus 31.7% a year earlier. The compression is almost entirely explained by $4.2bn of IPR&D charges and a higher tax rate. Gross margin rose to 83.9% from 82.9% on a favourable product mix and lower cost of sales, partly offsetting price declines.
R&D expense rose 23% to $4.2bn, or 17% of revenue. Marketing, selling and administrative expense added 14% to $3.1bn ahead of launches. Both lines grow slower than revenue, so operating leverage is working.
Adjusted gross margin was 84.4% versus 83.6% a year earlier. This means the pressure on the bottom line is one-off rather than structural. If charges do not repeat in the fourth quarter, the margin should recover towards last year's level.
Operating cash flow for the quarter was $11,397m, but capex in the second quarter reached $6,215m
Third-quarter operating cash flow was $11,397m, well above $8,836m a year earlier. That is a strong result covering both capex and dividends. Over the trailing twelve months operating cash flow reached $30,645m.
Capex in the second quarter was $6,215m, well above $2,326m in the first quarter. The company is expanding manufacturing: the report mentions new sites in Texas and Virginia and groundbreakings in Houston and Richmond. This explains the rise in capex and its effect on free cash flow.
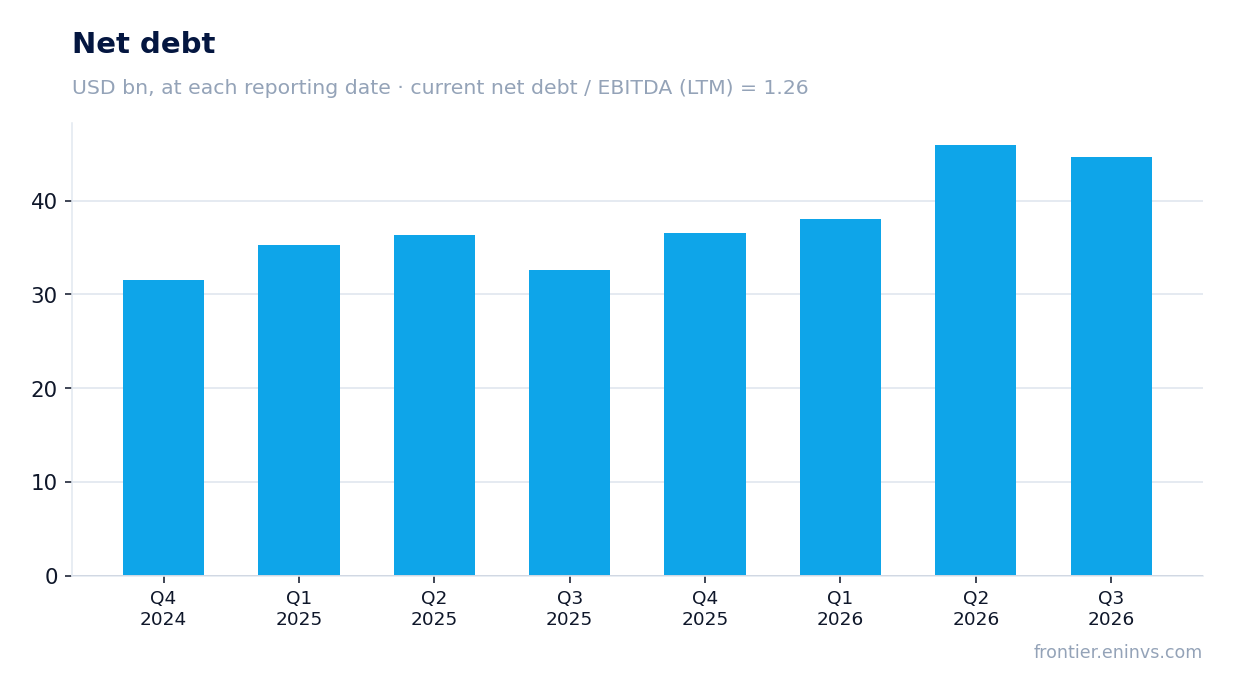
Net debt at 30 September 2026 was $44.6bn versus $46.0bn at 30 June, a decrease of $1.3bn. A year earlier, at 30 September 2025, it was $32.6bn, so over twelve months it rose by $12.0bn. Net debt to trailing-twelve-month EBITDA is 1.26, a moderate level for a company with this cash flow.
Net debt fell to $44.6bn from $46.0bn at end-June, and net debt/EBITDA LTM stands at 1.26
Net debt at 30 September 2026 was $44.6bn versus $46.0bn at 30 June 2026, a decrease of $1.3bn. Over twelve months, from $32.6bn at 30 September 2025, it rose by $12.0bn. The increase is tied to acquisitions and manufacturing expansion.
Net debt to trailing-twelve-month EBITDA is 1.26. That is a moderate level leaving room for further deals and capital investment. Quarterly interest expense was $316m versus $114m a year earlier, reflecting higher debt and rates.
The company paid dividends of $1.73 per share for the quarter, up 15% year on year. At an annual rate of about $6.9 and a share price of $1,288, the dividend yield is about 0.49%. That is a modest yield and not the main argument for the stock.
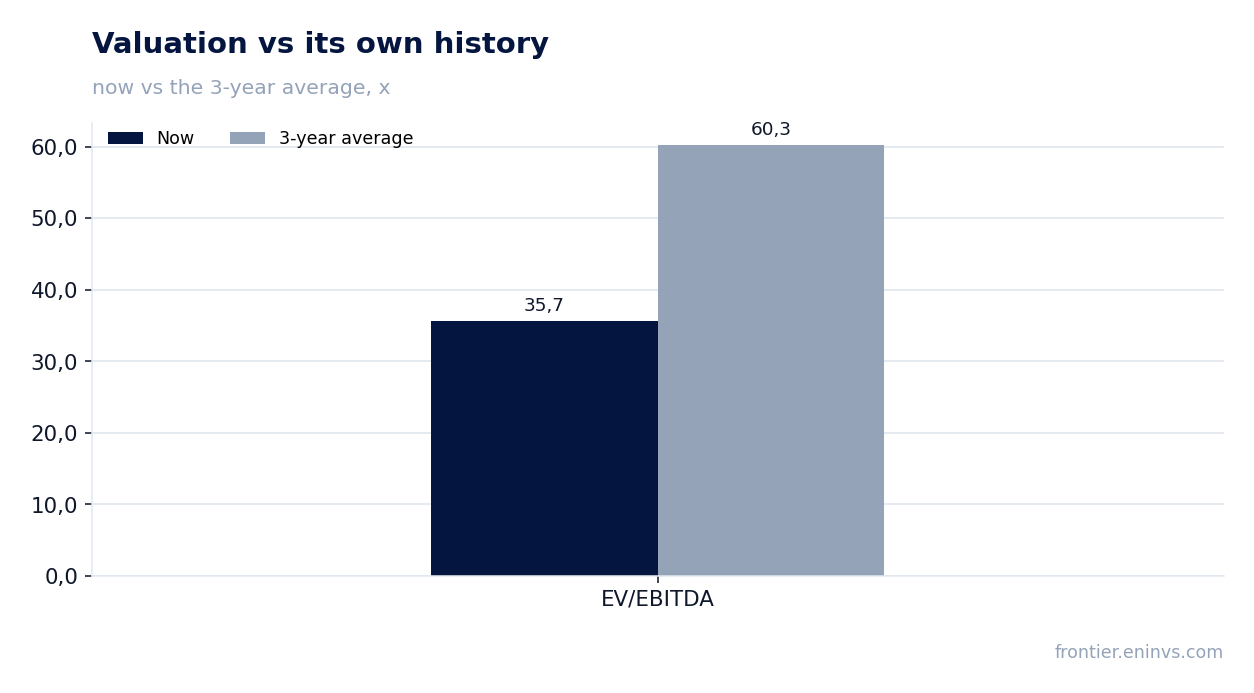
EV/EBITDA LTM of 35.7 is 41% below its own three-year average of 60.3, so the stock is cheaper than its history
The trailing-twelve-month EV/EBITDA multiple is 35.7 against its own three-year average of 60.3. That is 41% below the historical level, so the stock trades cheaper than usual. The trailing P/E is 44.6, which looks moderate given profit growth.
On the portal's model, which compares EBITDA growth with a target multiple and market capitalisation, upside to fair value is estimated at +15%. This is our own estimate, not a market consensus. The stock added 6.6% on the report and is up the same 6.6% since publication.
Return on equity reaches 69.6%, reflecting high profitability with moderate debt. The 0.49% dividend yield is low, but the company directs funds into growth. The combination of a multiple below its own history and strong cash flow makes the valuation attractive.
Valuation on the latest reported figures
| Metric | Value |
|---|---|
| Market cap | 1 229 bn USD |
| P/E (LTM) | 44.6 |
| EV/EBITDA (LTM) | 35.7 |
| P/B | 46.32 |
| Net debt / EBITDA (LTM) | 1.26 |
| Operating cash flow (LTM) | 30.6 bn |
| ROE | 69.6% |
| Dividend yield (12m) | 0.5% |
| EV/EBITDA, 3-year average | 60.3 |
Bottom line
The quarter showed strong revenue growth of 38.6% on volume, but profit rose only 15.6% because of $4.2bn of one-off charges. The margin compressed to 26.4%, but that is a consequence of one-off items rather than structural pressure. Cash flow remains strong, net debt is moderate at 1.26x EBITDA, and the EV/EBITDA multiple of 35.7 is 41% below its own three-year average. On the portal's model upside is +15%, so the share looks rather attractive.
Open the company's financial profile LLY →
See also: market overview · valuation map · stock screeners