LATTICE SEMICONDUCTOR CORP: revenue up 118%, but one-off AMI acquisition costs ate the profit
On November 2, LATTICE SEMICONDUCTOR CORP reported results for the quarter ended October 3, 2026. Revenue reached $291.0 million (+118.3% YoY), adjusted EBITDA was $131.0 million at a 45.0% margin, while GAAP net income was only $11.2 million because of one-off AMI acquisition costs. The stock trades below its own three-year history on EV/EBITDA, and the portal model implies +17% upside, so the share looks rather attractive, though one-off items and debt after the acquisition warrant caution.
Key takeaways
— Revenue rose 118.3% YoY to $291.0 million, with roughly a third of that growth coming from the AMI acquisition
— Adjusted EBITDA reached $131.0 million at a 45.0% margin, but GAAP net income was only $11.2 million because of one-off acquisition costs
— One-off AMI acquisition costs of $25.9 million, together with amortisation of intangibles, pulled operating profit down to $24.0 million
— Operating cash flow of $95.0 million converted into free cash flow of $77.6 million after $17.4 million of capex
— Debt rose to $869.1 million after the AMI purchase, while net debt at the end of January 2026 was minus $91.8 million, meaning the company moved from a net cash position to a debt position
— EV/EBITDA LTM of 61.3 is 28% below its own three-year average of 85.4, so the stock is cheaper than its own history on this multiple
— The portal model implies +17% upside to fair value, which, alongside accelerating revenue, supports the share's attractiveness
Attractiveness
Key figures, USD bn
| Metric | Q3 2025 | Q4 2026 | Change |
|---|---|---|---|
| Revenue | 0.13 | 0.29 | +118.3% |
| EBITDA | -0.00 | 0.13 | to profit |
| Operating profit | -0.00 | 0.02 | to profit |
| Net profit | 0.00 | 0.01 | +301.1% |
| Operating cash flow | 0.05 | 0.10 | +101.7% |
| Capex | 0.01 | — | — |
| EBITDA margin | -0.7% | 45.0% | +45.7 pp |
| Net margin | 2.1% | 3.9% | +1.8 pp |
Revenue rose 118.3% YoY to $291.0 million, with roughly a third of that growth coming from the AMI acquisition
Revenue for the quarter ended October 3, 2026, was $291.0 million versus $133.3 million a year earlier, up 118.3%. This extends the acceleration: growth was 62.2% in the prior quarter and 118.3% a year ago. The company calls it a record revenue quarter.
Two segments drove the result. Compute and Communications contributed $171.9 million (59% of revenue), Industrial and Embedded $80.0 million (28%), and the acquired AMI added $39.1 million (13%). Without AMI, revenue would have been about $252 million, so organic growth was still very high, but roughly a third of the increase came from the acquisition.
By channel, distribution rose to 81% from 83% a year earlier, while direct sales were 19%. Geographically, Asia rose to 76% of revenue from 65%, reflecting demand from Asian data-centre equipment makers.
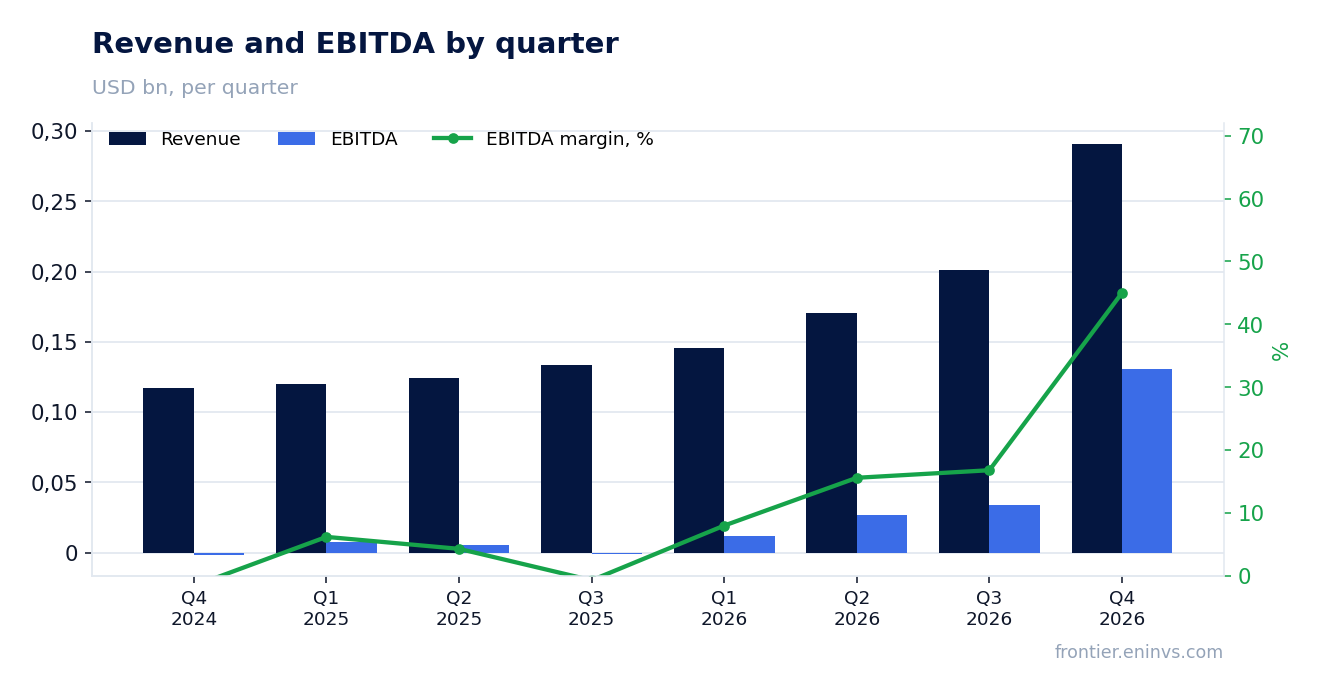
Adjusted EBITDA reached $131.0 million at a 45.0% margin, but GAAP net income was only $11.2 million because of one-off acquisition costs
Adjusted EBITDA was $131.0 million at a 45.0% margin versus 35.6% a year earlier. The 9.4 percentage point margin expansion came mainly from operating leverage: revenue grew 118% while operating expenses rose 87%. The company notes that operating leverage was evident in faster earnings growth.
GAAP net income was only $11.2 million at a 3.9% margin, though up from $2.8 million a year earlier. The gap to EBITDA is explained by one-off items: AMI acquisition costs of $25.9 million, amortisation of intangibles of $12.9 million, and stock-based compensation of $50.7 million. Excluding these, non-GAAP net income would have been $103.7 million, or $0.72 per diluted share versus $0.08 on a GAAP basis.
GAAP gross margin slipped to 67.4% from 67.9% a year earlier, but on a non-GAAP basis rose to 70.9% from 69.5%. The GAAP decline reflects $7.0 million of AMI intangible amortisation, which is excluded from the adjusted margin.
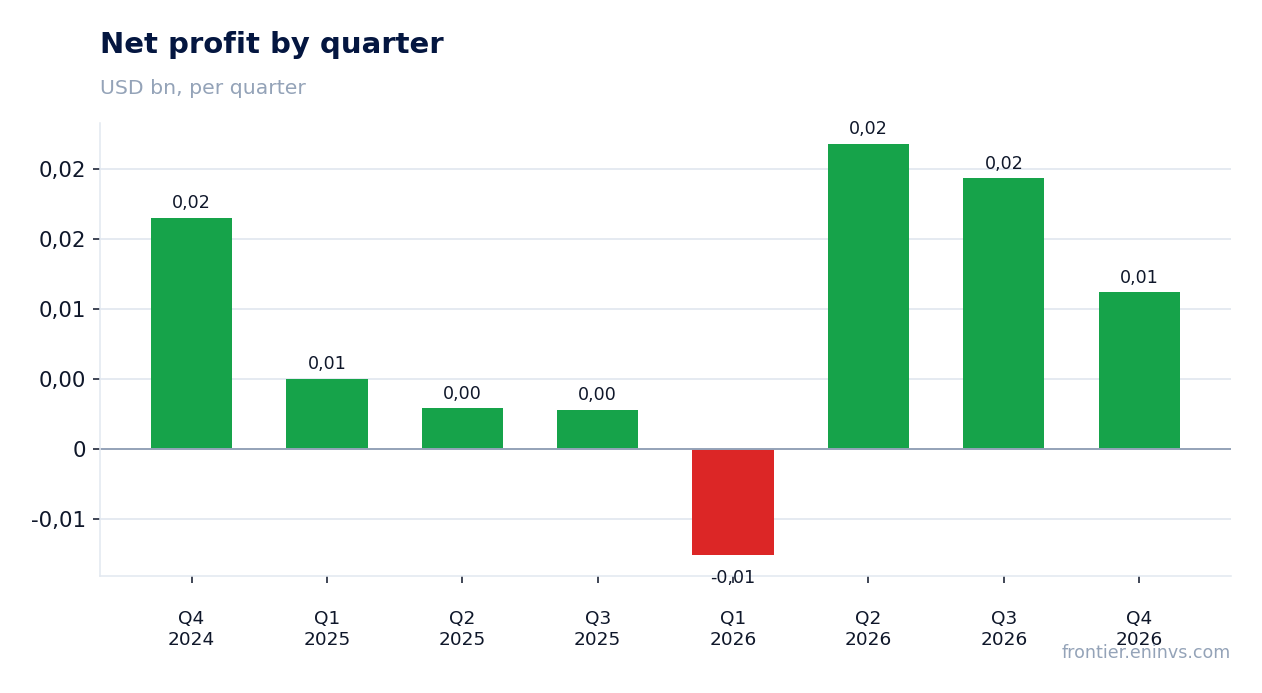
One-off AMI acquisition costs of $25.9 million, together with amortisation of intangibles, pulled operating profit down to $24.0 million
GAAP operating profit was $24.0 million versus a $1.5 million loss a year earlier. Excluding one-off items, however, it would have been much higher: non-GAAP operating profit reached $119.6 million, with a 41.1% margin versus 29.0% a year earlier.
Key one-off items: AMI acquisition costs of $25.9 million, amortisation of acquired intangibles of $12.9 million, stock-based compensation of $50.7 million, and restructuring of $0.1 million. These items, not operational problems, explain the modest GAAP profit.
Interest expense rose to $9.6 million from $0.6 million of income a year earlier because of debt raised for the AMI purchase. This is another item weighing on net income but excluded from EBITDA.
Operating cash flow of $95.0 million converted into free cash flow of $77.6 million after $17.4 million of capex
Operating cash flow for the quarter was $95.0 million at a 32.7% margin versus 35.3% a year earlier. Free cash flow reached $77.6 million at a 26.7% margin versus 25.5%, despite capex rising to $17.4 million from $13.1 million.
The capex increase reflects capacity expansion and AMI integration. The company says its focus remains on expanding free cash flow and reducing debt. For the nine months, operating cash flow was $233.6 million and free cash flow $198.6 million.
Cash on the balance sheet was $128.3 million at October 3, 2026. That is enough to service debt, but after the AMI purchase the company became a debtor rather than a creditor.
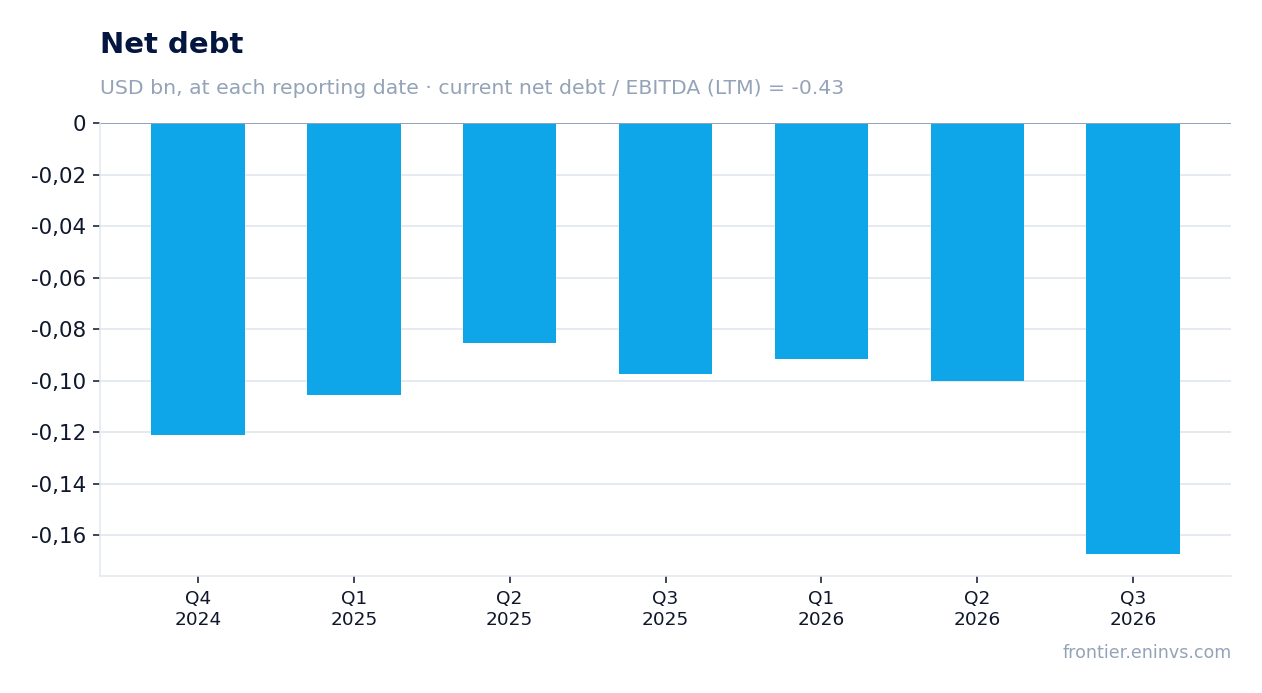
Debt rose to $869.1 million after the AMI purchase, while net debt at the end of January 2026 was minus $91.8 million, meaning the company moved from a net cash position to a debt position
Long-term debt on the balance sheet at October 3, 2026, was $869.1 million versus zero at January 3, 2026. The company raised $912.7 million to finance the AMI purchase and repaid $50.0 million over nine months. Net debt at the end of January 2026 was negative at minus $91.8 million, meaning the company had a net cash position.
The net debt to LTM EBITDA ratio is -0.43, so formally the company still has a net cash position on this measure, but that is based on the balance sheet at the end of January 2026, before the AMI purchase. After the deal, debt has risen and this ratio will change.
Interest expense in the quarter was $9.6 million, corresponding to roughly 4.4% annualised on $869.1 million of debt. The company says it intends to reduce debt but gives no specific timeline.
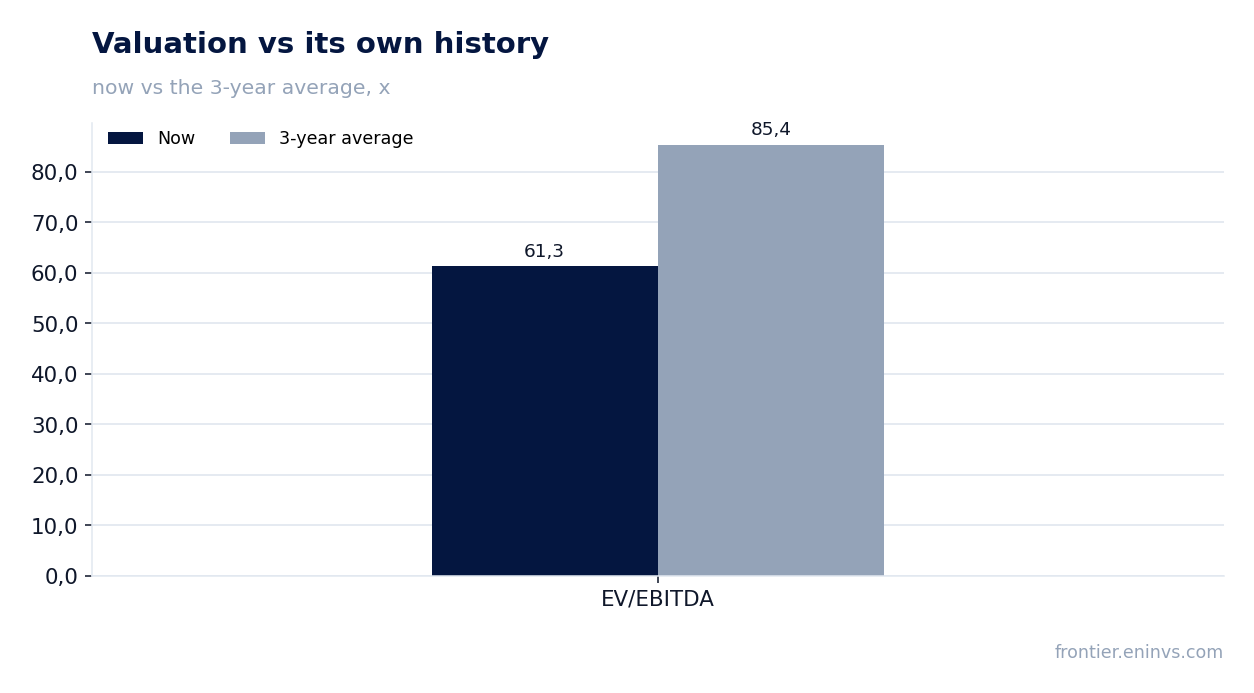
EV/EBITDA LTM of 61.3 is 28% below its own three-year average of 85.4, so the stock is cheaper than its own history on this multiple
EV/EBITDA LTM is 61.3 versus its own three-year average of 85.4, meaning the stock trades 28% below its history on this multiple. P/E LTM is 292.5, reflecting low net income due to one-off items; on an adjusted basis the multiple is much lower.
Market capitalisation is $13.1 billion. With LTM EBITDA of $212.0 million and EV/EBITDA of 61.3, the market values the company well above current EBITDA, pricing in growth. Its own history suggests this valuation is not stretched relative to past levels.
The portal model, based on EBITDA growth and a target multiple, implies +17% upside to fair value. This is our own estimate, not a market consensus.
The portal model implies +17% upside to fair value, which, alongside accelerating revenue, supports the share's attractiveness
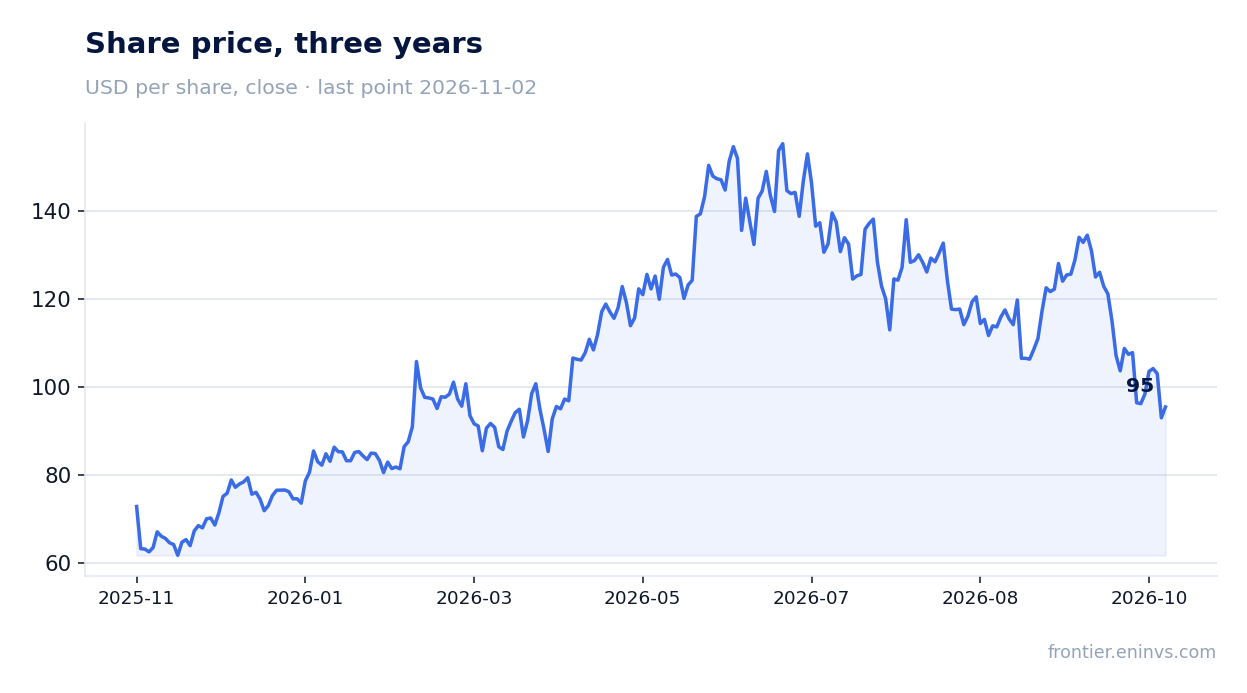
The share closed at $92.97 before the release, rose 2.7% on the release day and added another 2.7% by November 2, 2026. The market reaction was muted despite a strong report, which may reflect growth already priced in.
The portal model implies +17% upside to fair value. With revenue accelerating (118.3% in the latest quarter versus 62.2% in the prior one) and EBITDA margin expanding to 45.0%, this looks justified.
However, a significant part of growth came from the AMI acquisition, and debt rose to $869.1 million. If organic growth slows and the debt burden becomes more noticeable, the upside could shrink.
Valuation on the latest reported figures
| Metric | Value |
|---|---|
| Market cap | 13.1 bn USD |
| P/E (LTM) | 292.5 |
| EV/EBITDA (LTM) | 61.3 |
| P/B | 18.32 |
| Net debt / EBITDA (LTM) | -0.43 |
| Operating cash flow (LTM) | 0.29 bn |
| ROE | 10.1% |
| EV/EBITDA, 3-year average | 85.4 |
Bottom line
The quarter was strong: revenue rose 118.3%, EBITDA reached $131.0 million at a 45.0% margin, and free cash flow was $77.6 million. However, GAAP net income was only $11.2 million because of one-off AMI acquisition costs ($25.9 million) and amortisation. Debt rose to $869.1 million, and the company moved from a net cash to a debt position. The stock trades below its three-year history on EV/EBITDA (61.3 versus 85.4), and the portal model implies +17% upside. The verdict is rather attractive, with a caveat on one-off items and debt.
Open the company's financial profile LSCC →
See also: market overview · valuation map · stock screeners