Southwest Airlines: revenue up 21.2%, but profit rests almost entirely on one-off gains
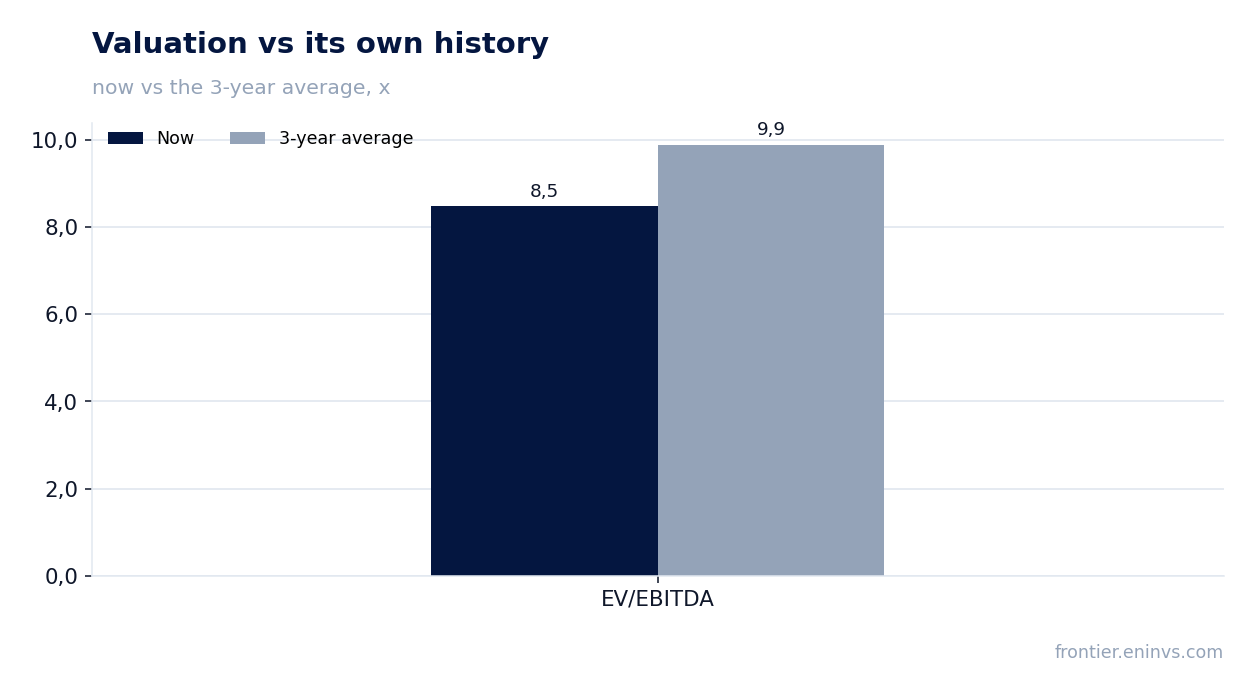
On 21 October Southwest Airlines reported third-quarter 2026 results. Revenue reached a record $8,422 million (+21.2% year on year), EBITDA was $777 million, and net income $270 million versus $54 million a year earlier. The EBITDA margin rose to 9.2% from 6.2%, but one-off gains from aircraft sales and sale-leasebacks played a visible role in profit. With EV/EBITDA at 8.5 against its own three-year average of 9.9 and the portal model's upside at +69%, the share looks attractive, although the durability of profit without one-off items is not yet confirmed.
Key takeaways
— Revenue accelerated to +21.2% on record unit revenue, not on capacity growth
— EBITDA margin rose to 9.2% despite higher fuel costs – one-off aircraft sale gains helped
— Of the $270 million profit, $214 million came from aircraft sales and sale-leasebacks
— Operating cash flow of $513 million does not cover capital expenditure of $1,006 million
— Net debt rose to $1.1 billion but remains at 0.35x EBITDA over the last twelve months
— Dividends of $176 million for the quarter give a 1.55% yield – below risk-free instruments
— EV/EBITDA of 8.5 is below its own three-year average of 9.9, and the portal model implies +69% upside
Attractiveness
Key figures, USD bn
| Metric | Q3 2025 | Q3 2026 | Change |
|---|---|---|---|
| Revenue | 6.95 | 8.42 | +21.2% |
| EBITDA | 0.43 | 0.78 | +81.1% |
| Operating profit | 0.04 | 0.38 | +982.9% |
| Net profit | 0.05 | 0.27 | +400.0% |
| Operating cash flow | 0.29 | 0.51 | +78.7% |
| Capex | 0.73 | 1.01 | +36.9% |
| EBITDA margin | 6.2% | 9.2% | +3.0 pp |
| Net margin | 0.8% | 3.2% | +2.4 pp |
Revenue accelerated to +21.2% on record unit revenue, not on capacity growth
Third-quarter 2026 revenue was $8,422 million, 21.2% more than a year earlier. Growth accelerated from 16.4% in the second quarter. Capacity fell 0.4%, so the entire increase came from price and sales mix, not from more seats.
Unit revenue per available seat mile rose 21.6% to an all-time record. Passenger revenue added 22.8% to $7,754 million, and the average fare rose 26.9% to $231.69. Load factor stayed at 79.8%, meaning the revenue increase did not come from fuller planes.
The company attributes the dynamics to strong demand and a low base: a year ago it was only introducing bag fees and other commercial initiatives. Management notes record managed business revenue and 20 of the 50 all-time top booking days in that segment falling in the quarter. This suggests growth rests not only on a one-off fare increase.
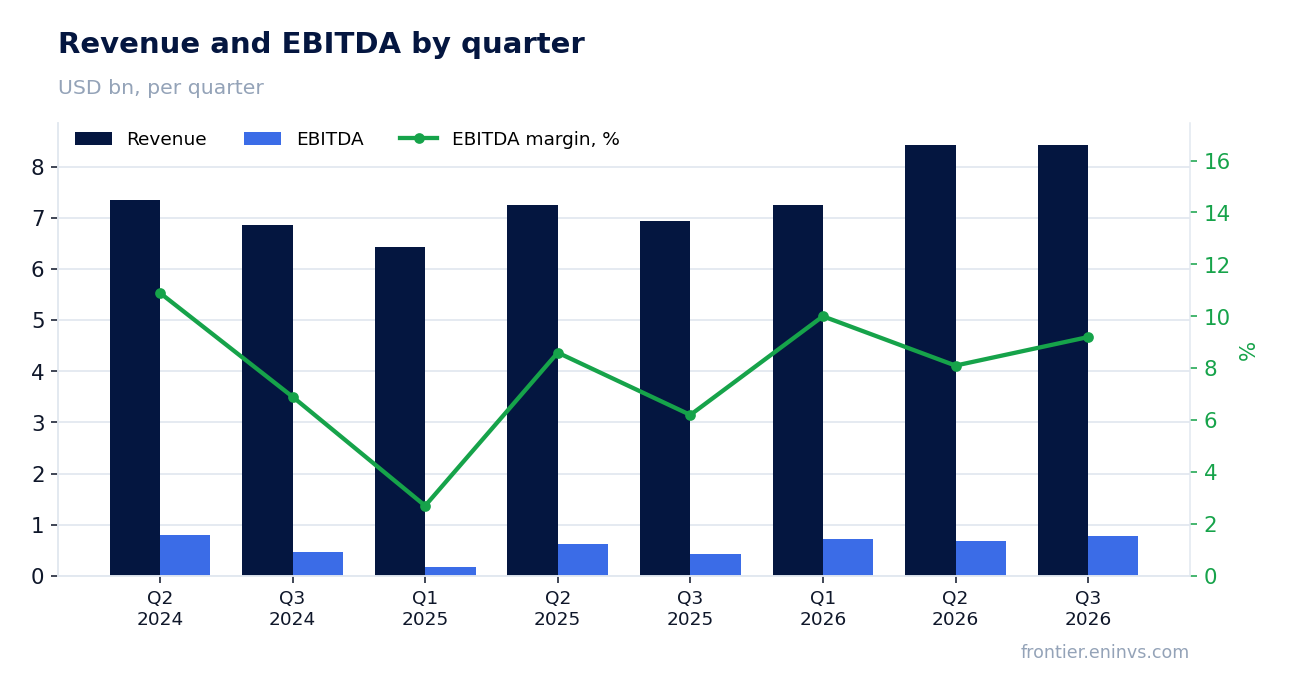
EBITDA margin rose to 9.2% despite higher fuel costs – one-off aircraft sale gains helped
Third-quarter EBITDA was $777 million versus $429 million a year earlier, up 81.1%. The EBITDA margin rose to 9.2% from 6.2%. Operating profit was $379 million, an operating margin of 4.5% versus 0.5% a year earlier.
Fuel expense rose 61.7% to $2,152 million as the cost per gallon climbed to $3.92 from $2.40. Fuel added $821 million to costs and cost $1.08 per share of adjusted earnings. Excluding special items, the operating margin would have been 5.4%, 4.8 percentage points above last year's.
A significant part of the improvement came from other operating expenses, which fell 8.6% to $1,026 million, and from gains on asset sales. The release cites a $214 million gain on aircraft sales and sale-leasebacks, including $96 million from aircraft retirements and engine sales and $118 million from sale-leaseback transactions. Without these inflows the margin would be noticeably lower.
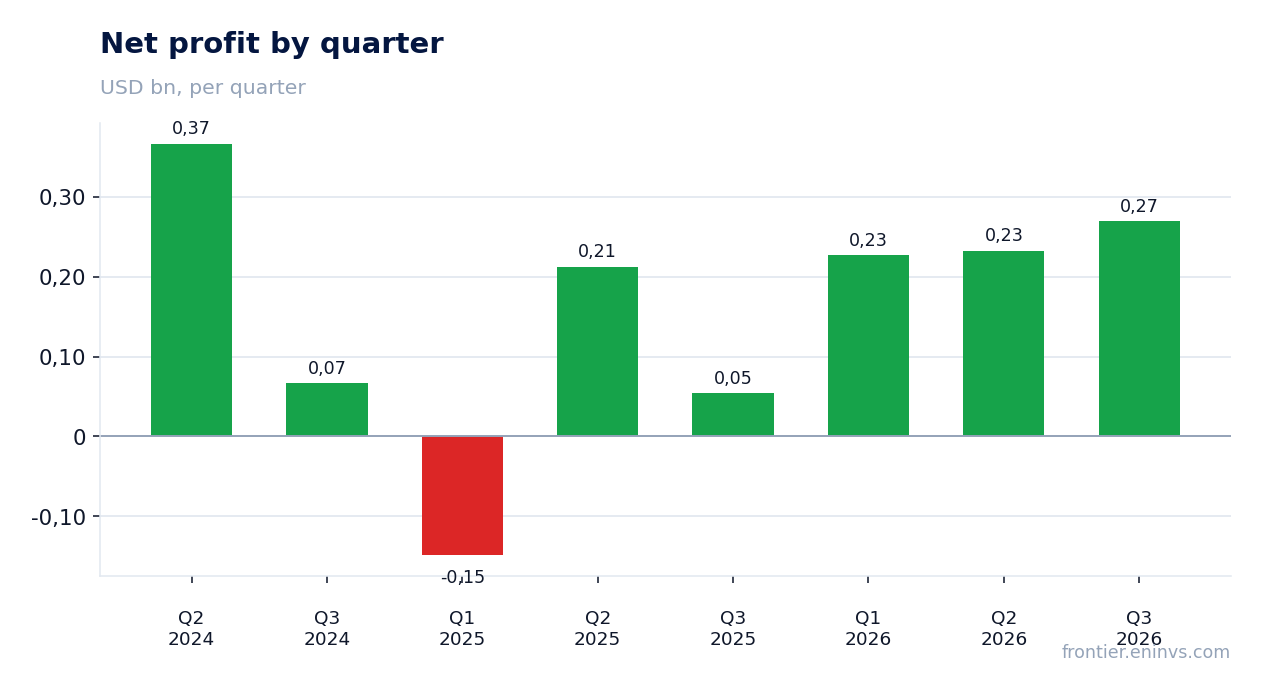
Of the $270 million profit, $214 million came from aircraft sales and sale-leasebacks
Third-quarter net income was $270 million, or $0.55 per diluted share, versus $54 million a year earlier. The fivefold increase looks impressive, but profit contains large one-off items. The $214 million gain on asset sales and sale-leasebacks is equivalent to 79% of net income.
Adjusted net income excluding special items was $328 million, or $0.66 per share. Special items include a $30 million impairment of long-lived assets, $30 million of severance costs and $13 million of litigation accruals. So the cleaned profit is actually higher than reported, but the aircraft sale gain is not included in it, and that is the key distinction.
Pre-tax income rose to $355 million from $68 million. Interest expense doubled to $70 million, tied to higher debt. The tax rate remained moderate. The durability of profit without asset sales is the main question for the report.
Operating cash flow of $513 million does not cover capital expenditure of $1,006 million
Third-quarter operating cash flow was $513 million versus $287 million a year earlier. Capital expenditure reached $1,006 million, almost double the $517 million a year earlier. The $493 million gap is covered by asset sales and sale-leasebacks, which brought in $285 million and $212 million respectively.
For the nine months, operating cash flow was $2,460 million and capital expenditure $2,454 million. The accumulated flow barely covers investment, and free cash flow remains near zero. The company expects 2026 net capital spending of $2.5–2.75 billion, above the current run rate.
Liquidity at quarter-end was $5.6 billion, including $3.6 billion of cash and a $2.0 billion revolver. Unencumbered aircraft and related assets are valued at $15.8 billion. This provides a cushion but does not change the fact that investment is partly funded by asset sales.
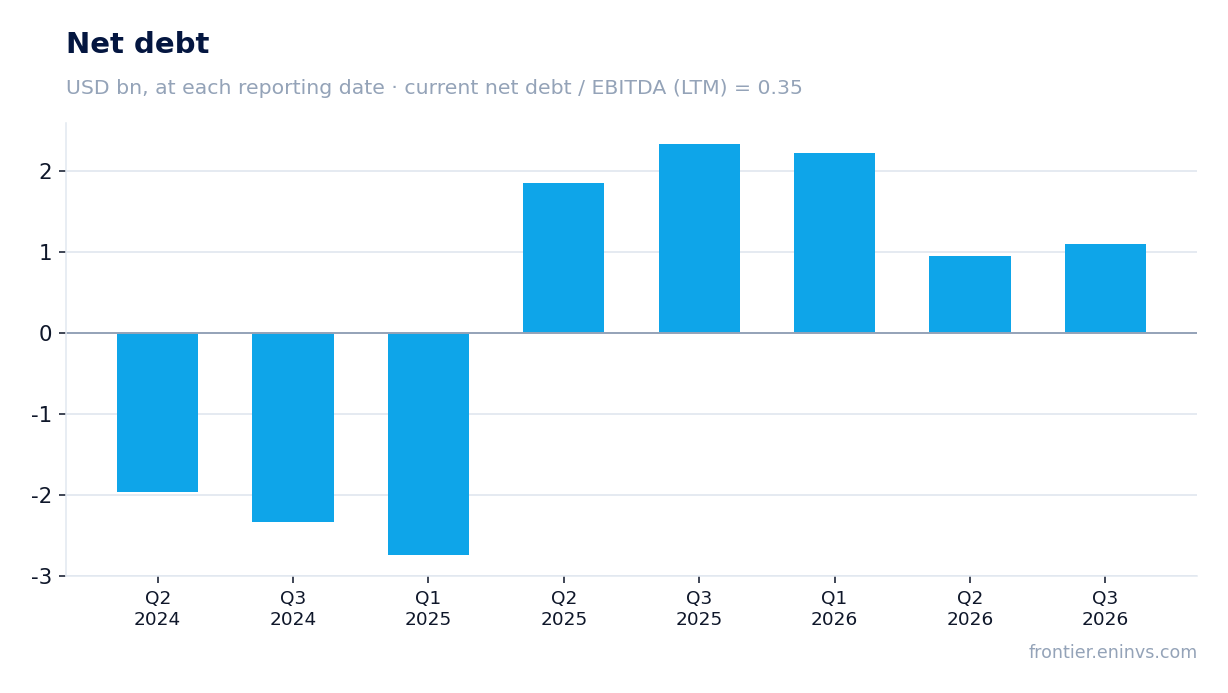
Net debt rose to $1.1 billion but remains at 0.35x EBITDA over the last twelve months
Net debt at 30 September 2026 was $1,094 million versus $942 million at 30 June 2026, an increase of $0.2 billion. Over the year debt fell: from $2,333 million at 30 September 2025 to $1,094 million, a reduction of $1.2 billion. The ratio of net debt to EBITDA over the last twelve months is 0.35, a low level.
Total debt including finance leases was $5,887 million, and adjusted debt including operating leases $6,871 million. The company reports its own gross leverage of 1.9x, calculated as adjusted debt to adjusted EBITDAR. Interest expense rose to $70 million for the quarter, tied to higher debt and rates.
Low leverage is a strength of the report. However, rising capital expenditure and dividend payments may require new borrowing. In June the company raised $1,500 million of long-term debt, which is already reflected in interest expense.
Dividends of $176 million for the quarter give a 1.55% yield – below risk-free instruments
In the third quarter the company paid $176 million in dividends, and $357 million over nine months. The trailing twelve-month dividend yield is 1.55% on the current price. This is a modest level that does not compensate for airline risk.
Our estimate of the 2026 dividend is based on adjusted earnings. The company guides full-year adjusted EPS of $2.60–2.85. At a payout of about $0.44 per share per year, the payout ratio would be roughly 15–17% of adjusted earnings. That is sustainable, but the dividend itself is small.
A yield of 1.55% is below risk-free instruments, so the dividend is not an argument for the share. A cut is possible if profit falls or capital expenditure rises. The company has $450 million remaining under its buyback authorisation, an alternative way to return capital.
EV/EBITDA of 8.5 is below its own three-year average of 9.9, and the portal model implies +69% upside
EV/EBITDA over the last twelve months is 8.5 against its own three-year average of 9.9, meaning the share trades 14% below its history. The trailing P/E is 22.7, higher than one might expect at this EV/EBITDA because net income is low relative to EBITDA. Return on equity is 15.0%.
On the portal model, fair value is 69% above the current price. The model is built on EBITDA growth and a target multiple, so its result is sensitive to the durability of profit. If the one-off aircraft sale gains are not repeated, the EBITDA base will be lower and the upside will shrink.
The share is held in the portal's live model strategies Global Commodities (potential), but that is a fact of membership, not an argument for the verdict. The comparison with history shows the market is already pricing in caution. Confirmation of growth requires the next quarter without one-off items.
Valuation on the latest reported figures
| Metric | Value |
|---|---|
| Market cap | 23.9 bn USD |
| P/E (LTM) | 22.7 |
| EV/EBITDA (LTM) | 8.5 |
| P/B | 3.00 |
| Net debt / EBITDA (LTM) | 0.35 |
| Operating cash flow (LTM) | 2.76 bn |
| ROE | 15.0% |
| Dividend yield (12m) | 1.6% |
| EV/EBITDA, 3-year average | 9.9 |
Bottom line
The report's strength is record revenue and unit revenue, which grew 21.2% and 21.6% respectively on lower capacity. The EBITDA margin rose to 9.2%, but a significant part of the improvement came from one-off aircraft sale gains. Operating cash flow does not cover capital expenditure, and the 1.55% dividend yield is modest. EV/EBITDA of 8.5 is below its own history, and the portal model implies +69% upside. The verdict is attractive, but confirmation requires a quarter without one-off items.
Open the company's financial profile LUV →
See also: market overview · valuation map · stock screeners