MCDONALDS CORP: revenue up just 1.1% while net profit rose 9.1% on other operating income

On November 4, MCDONALDS CORP reported third-quarter 2026 results. Revenue was $7,157 million (+1.1% year on year), EBITDA $4,043 million (+3.2%), and net profit $2,486 million (+9.1%). Profit growth outpaced revenue thanks to other operating income rather than sales. The share looks rather attractive: EV/EBITDA of 17.1 is below its own three-year average of 19.6, and the 2.66% dividend yield is backed by stable cash flow.
Key takeaways
— Revenue grew just 1.1% – half the pace of the prior quarter
— Profit rose 9.1% on other operating income, not sales
— EBITDA margin rose to 56.5% as SG&A expenses fell
— One-off charges of $56 million cut profit but did not change the picture
— Debt at 3.86x EBITDA is a moderate load with strong cash flow
— Dividend raised 4% to $1.93 per share
— EV/EBITDA of 17.1 is below its own three-year average of 19.6
Attractiveness
Key figures, USD bn
| Metric | Q3 2025 | Q3 2026 | Change |
|---|---|---|---|
| Revenue | 7.08 | 7.16 | +1.1% |
| EBITDA | 3.92 | 4.04 | +3.2% |
| Operating profit | 3.36 | 3.60 | +7.1% |
| Net profit | 2.28 | 2.49 | +9.1% |
| Operating cash flow | 3.43 | — | — |
| Capex | 1.01 | — | — |
| EBITDA margin | 55.3% | 56.5% | +1.2 pp |
| Net margin | 32.2% | 34.7% | +2.5 pp |
Revenue grew just 1.1% – half the pace of the prior quarter
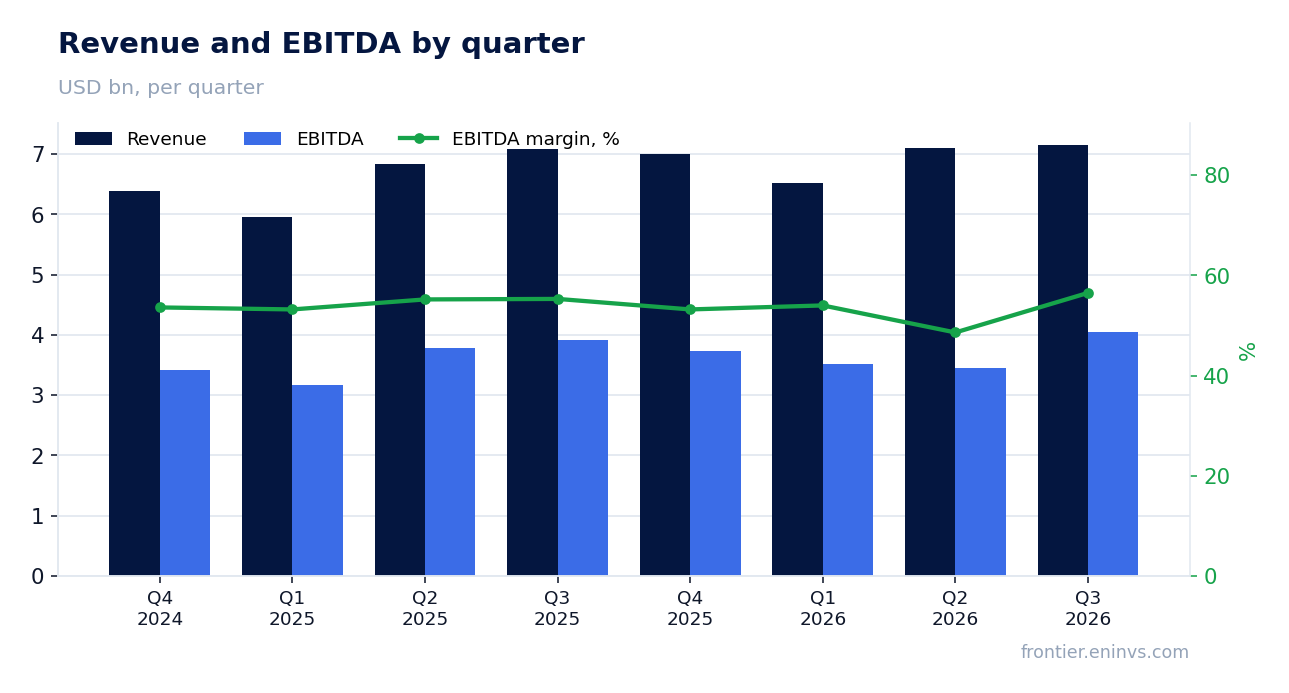
Revenue in Q3 2026 was $7,157 million, up 1.1% year on year. In Q2 growth was 3.7%, so the pace decelerated. Comparable sales rose 1.5%: US fell 0.2%, International Operated Markets added 1.4%, International Developmental Licensed Markets 4.2%.
Franchised revenue rose 3% to $4,487 million, while company-owned sales fell 3% to $2,480 million. Weakness came from the US, where company-owned sales dropped 6%, and from International Operated Markets (–3%). Other revenues rose 26% to $189 million, but their share of revenue is small.
The slowdown in revenue growth is the main signal of the report. The company expects net restaurant expansion to contribute about 2.5% to 2026 systemwide sales growth, but organic comparable sales growth in the US is close to zero.
Profit rose 9.1% on other operating income, not sales
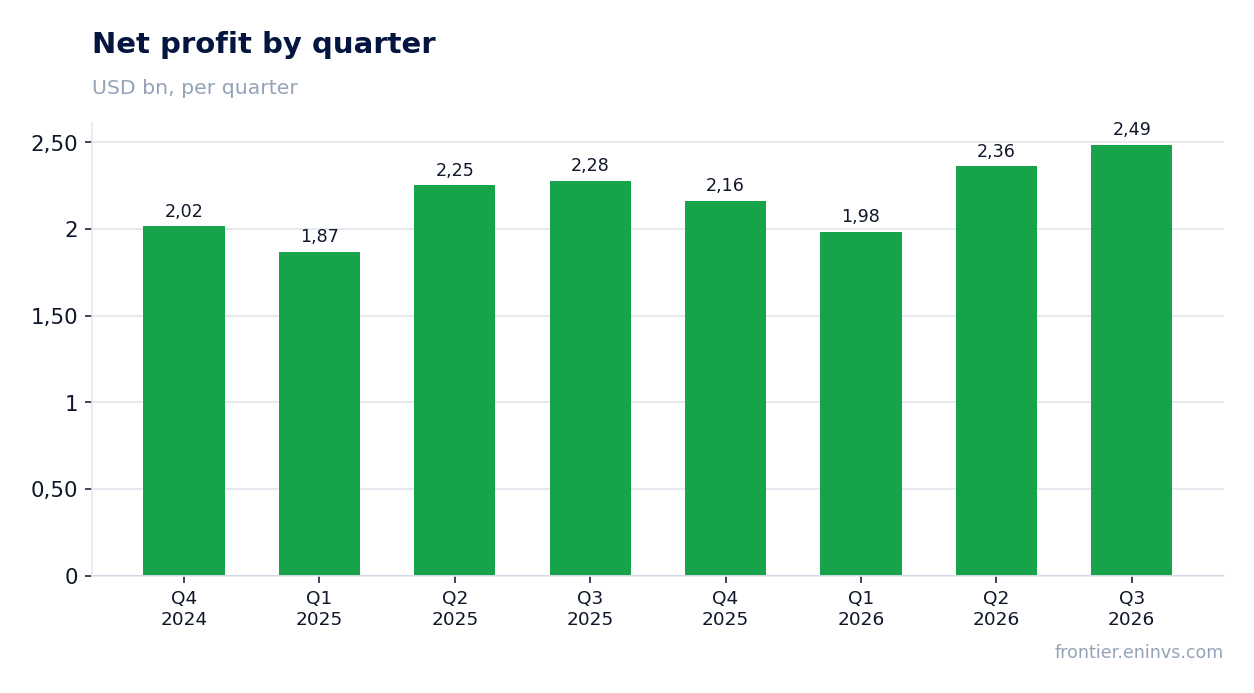
Net profit in Q3 was $2,486 million, up 9.1% year on year. Operating profit rose 7% to $3,595 million. The gap between profit and revenue growth is explained by other operating income: its net balance was minus $139 million versus minus $37 million a year earlier.
Within other income, gains on sales of restaurant businesses rose ($97 million versus $35 million) and gains on sales of excess properties increased. These are one-off items that support profit but do not reflect operating dynamics.
Excluding one-off charges of $56 million, adjusted operating profit was $3,651 million, a margin of 48.3% versus 47.2% a year earlier. Profit growth of 9.1% outpaces revenue growth of 1.1%, but the source of that outperformance is not sales.
EBITDA margin rose to 56.5% as SG&A expenses fell
EBITDA margin in Q3 was 56.5% versus 55.3% a year earlier. Net margin rose to 34.7% from 32.2%. The margin improvement came as SG&A expenses fell 3% to $759 million.
The company attributes the SG&A decline to incremental marketing spend in the prior year. For the nine months, expenses rose 8% on higher employee costs and the 2026 Worldwide Owner/Operator convention.
Franchised restaurant margins rose 3% to $3,800 million, while company-owned margins were flat at $392 million. Margin growth on weak revenue is the result of cost control, not sales growth.
One-off charges of $56 million cut profit but did not change the picture
In Q3 2026 the company recorded net pre-tax charges of $56 million ($0.06 per share) related to restructuring under the Accelerating the Organization programme. A year earlier such charges were $39 million.
For the nine months, charges were $155 million ($0.17 per share) versus $148 million a year earlier. The programme is expected to complete during 2027, and charges will continue.
Excluding these items, adjusted net profit was $2,529 million, up 10% year on year. The one-off items do not change the overall picture: profit is growing, but mainly on non-operating income and cost control.
Debt at 3.86x EBITDA is a moderate load with strong cash flow
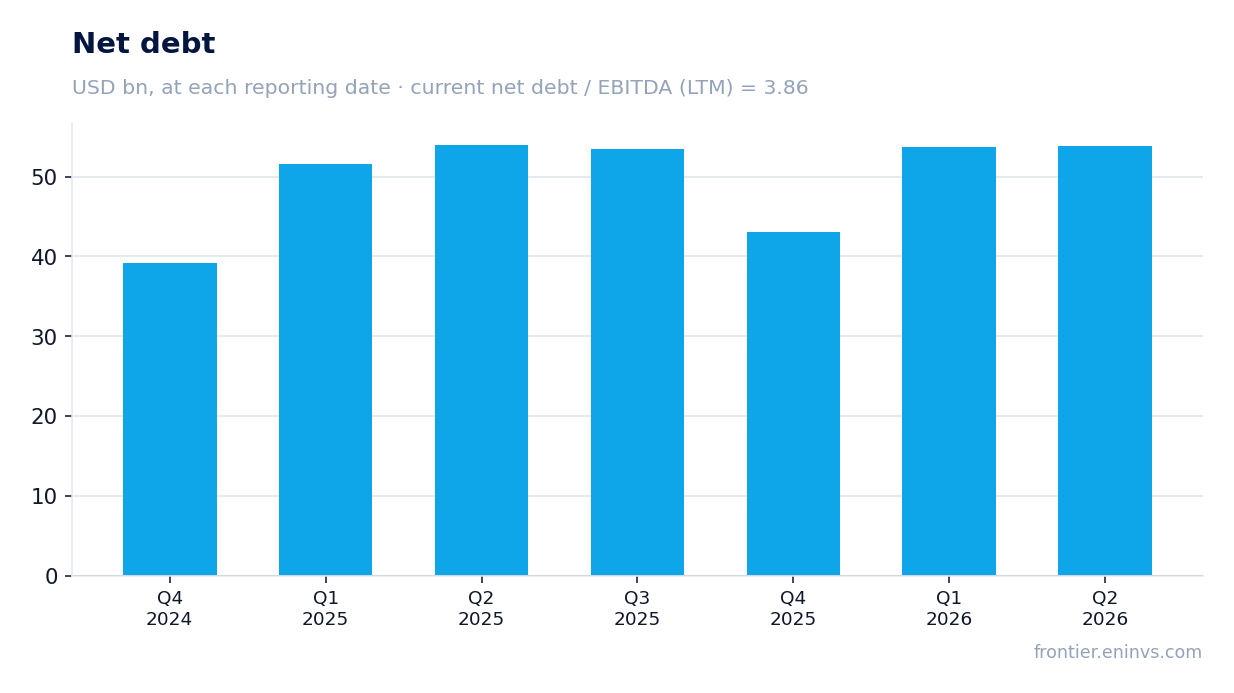
Net debt at the latest reporting date was $57,915 million, equivalent to 3.86x trailing twelve-month EBITDA. This is a moderate level for a company with stable cash flow. Operating cash flow was $3,428 million in Q3 2025 and $2,807 million in Q2 2026.
The company expects 2026 capital expenditures of about $3.7 billion, mostly for new restaurant openings. Free cash flow conversion is expected in the low-to-mid 80% range.
Interest expense was flat in Q3 and rose 4% for the nine months on higher rates. The company expects full-year 2026 interest expense to increase 4–6%.
Dividend raised 4% to $1.93 per share
In September 2026 the company declared a 4% increase in its quarterly dividend to $1.93 per share, payable on December 15, 2026. For Q3 it paid $1.86 per share, or $1.3 billion; for the nine months payments totalled $4.0 billion.
The trailing twelve-month dividend yield is 2.66%. At the current price and with stable cash flow, the payout looks sustainable. The company also repurchased 1.9 million shares for $519 million in the quarter and 6.2 million shares for $1.8 billion over nine months.
The risk to the dividend is a slowdown in revenue and profit growth. If profit stops growing, the company may revise the pace of increases, but the current 2.66% level looks comfortable.
EV/EBITDA of 17.1 is below its own three-year average of 19.6
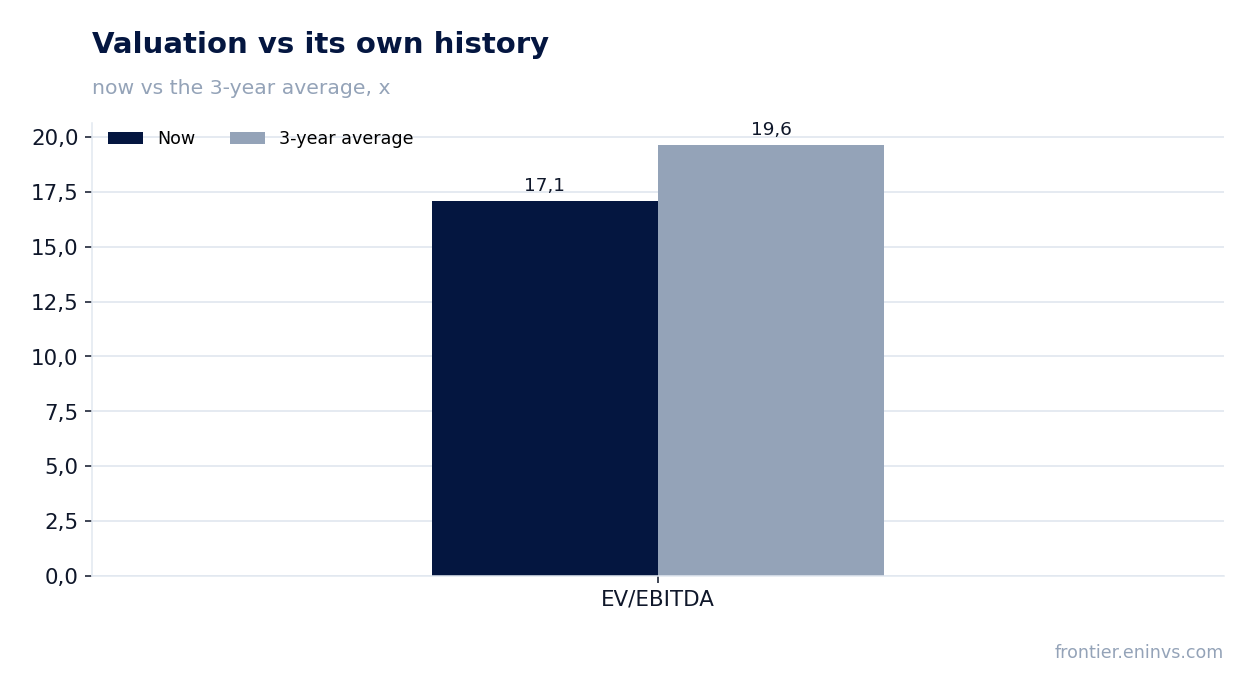
The trailing twelve-month EV/EBITDA multiple is 17.1 versus its own three-year average of 19.6, meaning the share trades 13% below its history on this multiple. The trailing P/E is 22.0.
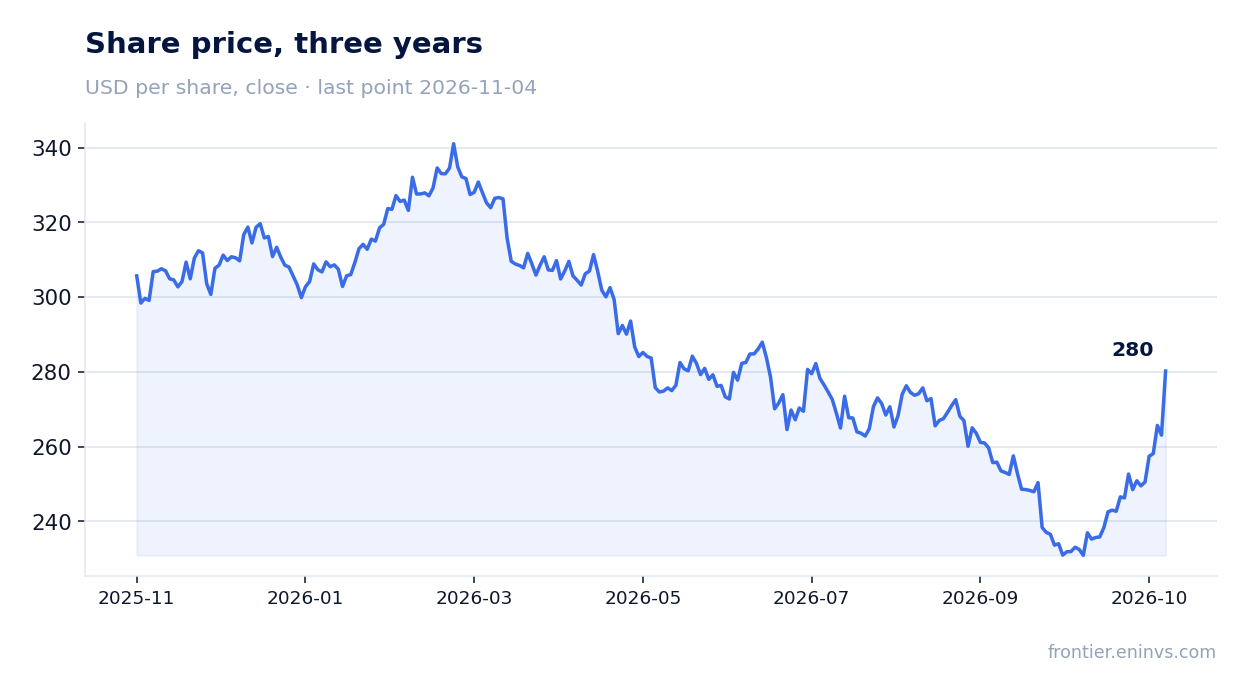
On the portal's model, the upside to fair value is +4%. This is our own estimate, not a market consensus. The share rose 6.5% after the report.
The lower multiple relative to history reflects the slowdown in revenue growth. If revenue dynamics recover, the multiple could return to its average, but growth signals are weak for now.
Valuation on the latest reported figures
| Metric | Value |
|---|---|
| Market cap | 198 bn USD |
| P/E (LTM) | 22.0 |
| EV/EBITDA (LTM) | 17.1 |
| Net debt / EBITDA (LTM) | 3.86 |
| ROE | -206.1% |
| Dividend yield (12m) | 2.7% |
| EV/EBITDA, 3-year average | 19.6 |
Bottom line
The strong side of the report is margin: EBITDA margin rose to 56.5%, SG&A expenses fell 3%, and the dividend was raised 4%. The weak side is revenue: growth of just 1.1%, US comparable sales down 0.2%, and profit growing mainly on one-off income. Debt at 3.86x EBITDA is moderate and cash flow is stable. The question for a holder now is whether the company can accelerate revenue growth without relying on one-off items. The verdict is rather attractive: the multiple is below its own history and the dividend is sustainable, but growth remains weak.
Open the company's financial profile MCD →
See also: market overview · valuation map · stock screeners