Meta Platforms, Inc.: net income tripled, but a one-off $9.89bn charge ate the operating leverage
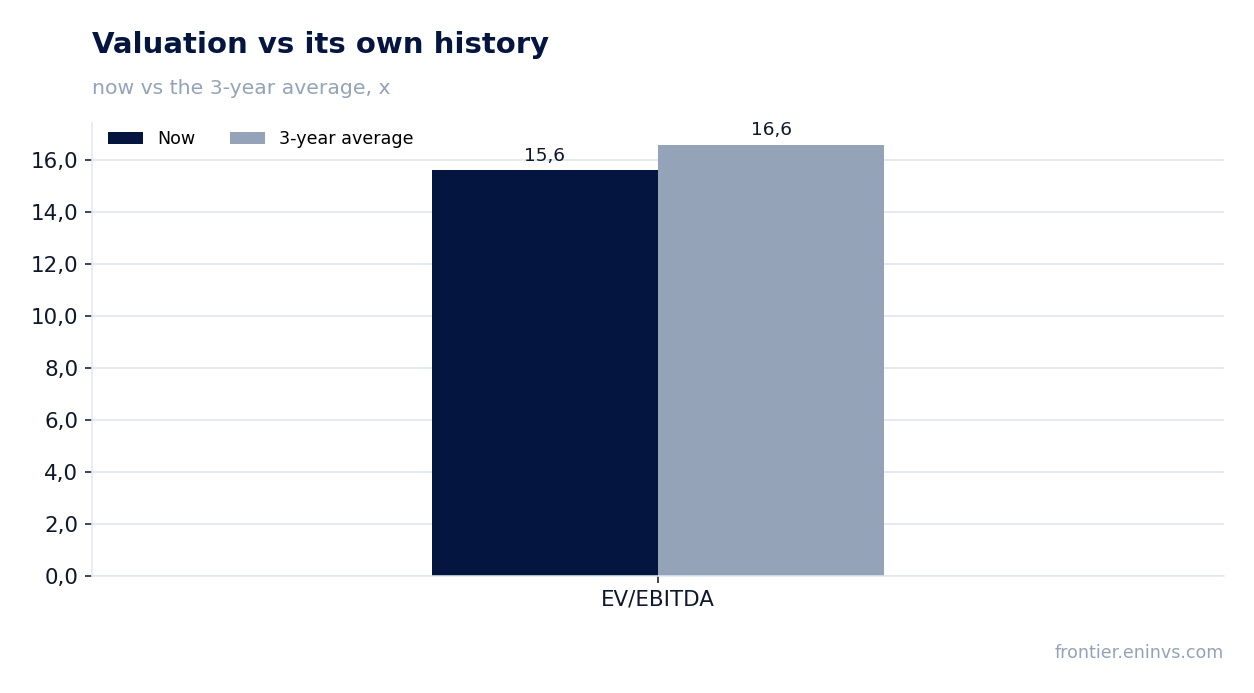
On 21 October Meta Platforms, Inc. reported third-quarter 2026 results: revenue of $64,601m (+26.1% YoY), operating profit of $12,988m and net income of $9,860m (+264.0%). Revenue growth decelerated from 28.0% in Q2 to 26.1%, while the operating margin fell from 40% to 20% on a one-off $9.89bn charge tied to the state attorneys general settlement. The stock trades below its own three-year EV/EBITDA history (15.6 vs 16.6), and at the current price it looks rather attractive than neutral.
Key takeaways
— Revenue rose 26.1%, but growth decelerated from 28.0% in Q2
— The operating margin fell from 40% to 20%, and $9.89bn of that drop is a one-off charge
— Net income tripled, but the YoY comparison is distorted by last year's tax base
— Free cash flow turned negative at $2.12bn on $34.91bn of capex
— Leverage of 0.42x EBITDA LTM is low, but it cannot be compared with last year
— The stock is cheaper than its own history on EV/EBITDA, while the portal model shows only +5%
— A 0.30% dividend yield plays no role in the valuation
Attractiveness
Key figures, USD bn
| Metric | Q3 2025 | Q3 2026 | Change |
|---|---|---|---|
| Revenue | 51.2 | 64.6 | +26.1% |
| EBITDA | 25.5 | — | — |
| Operating profit | 20.5 | 13.0 | -36.8% |
| Net profit | 2.71 | 9.86 | +264.0% |
| Operating cash flow | 30.0 | 32.8 | +9.3% |
| Capex | 18.8 | — | — |
| EBITDA margin | 49.8% | — | — |
| Net margin | 5.3% | 15.3% | +10.0 pp |
Revenue rose 26.1%, but growth decelerated from 28.0% in Q2
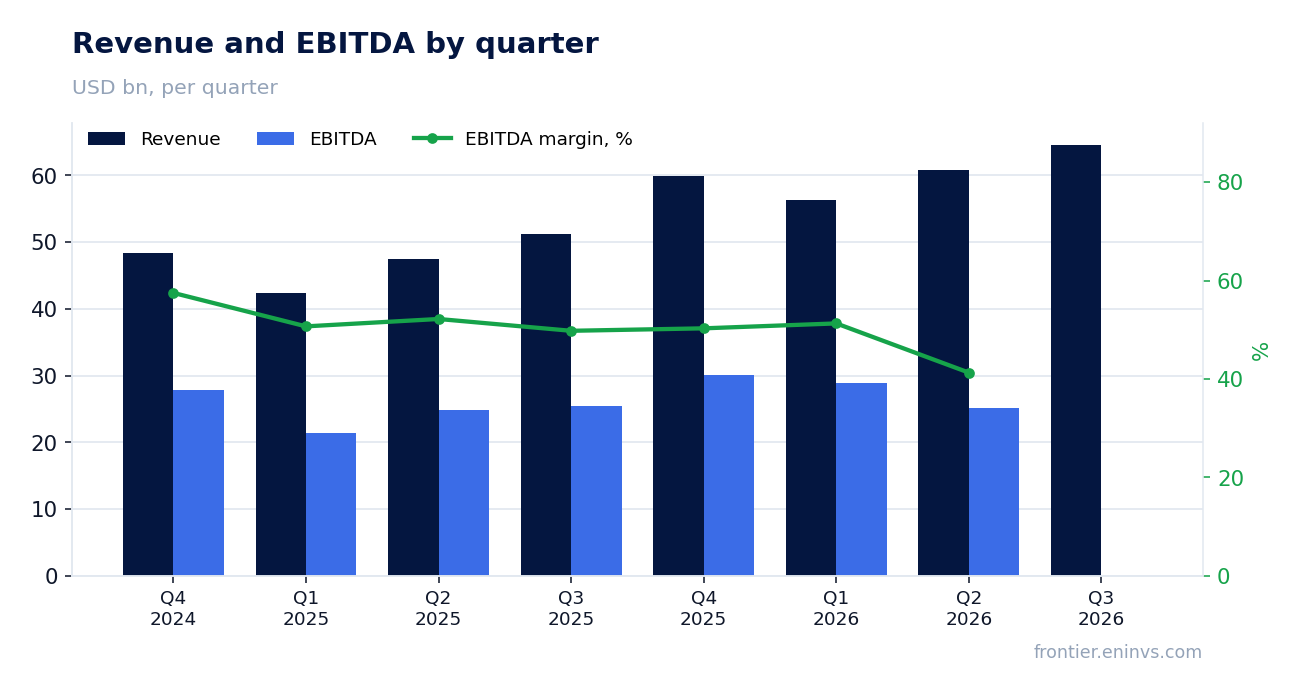
Third-quarter 2026 revenue was $64,601m, up 26.1% year on year. In Q2 growth was 28.0%, a deceleration of 1.9 percentage points. The company attributes the dynamics to strong advertising: ad impressions rose 10% and average price per ad rose 14%.
Advertising revenue brought in $63,061m, with another $1,097m from other Family of Apps revenue. Reality Labs added only $443m, down from $470m a year earlier. All growth still rests on advertising, not on new businesses.
In constant currency revenue grew by the same 26%, with the FX effect estimated at $113m. The deceleration is therefore not currency-driven – it reflects the comparison base and saturation of the ad market.
The operating margin fell from 40% to 20%, and $9.89bn of that drop is a one-off charge
Operating profit was $12,988m versus $20,535m a year earlier, down 37%. The margin compressed from 40% to 20%. The report names the cause directly: in August 2026 the company reached a settlement with 52 state attorneys general over teen mental health, and the quarter includes a $9.89bn charge.
Excluding the charge, operating profit would have been $22,880m, above last year's level. Diluted EPS was $3.83; excluding the charge it would have been $7.40. Total costs and expenses rose 68% to $51,613m, and the charge accounts for almost all of that increase.
Other lines grew more modestly: cost of revenue $13,369m versus $9,206m, R&D $20,054m versus $15,144m. This reflects AI infrastructure and headcount investment rather than one-off events. That part of spending will determine the margin in coming quarters.
Net income tripled, but the YoY comparison is distorted by last year's tax base
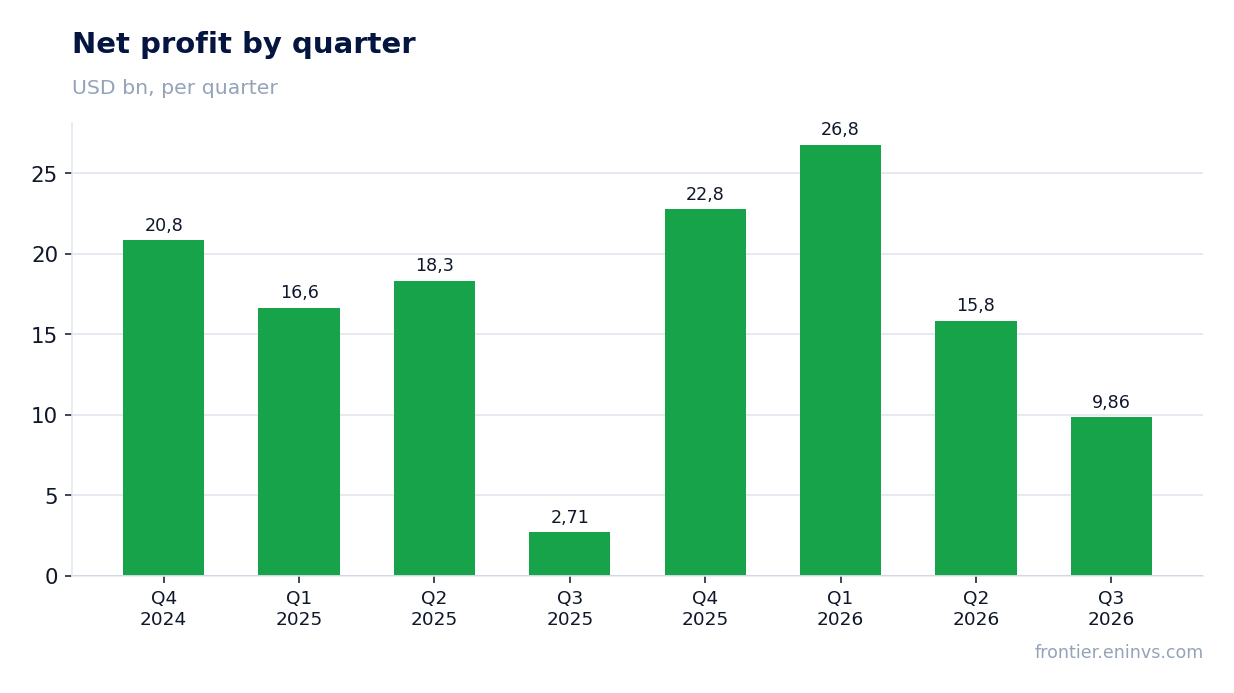
Net income was $9,860m versus $2,709m a year earlier, up 264.0%. That looks impressive, but last year's base was abnormally low: the effective tax rate was 87% and the tax bill absorbed $18,954m. This quarter the rate is 24% and the tax is $3,141m.
Strip out both last year's tax effect and this year's charge and the picture is more modest: profit grew with revenue, but the margin compressed on investment. The quarterly net margin of 15.3% versus 5.3% a year earlier is mostly about taxes, not operating efficiency.
For the nine months, net income was $52,481m versus $37,690m, with the charge and taxes already mixed in. For assessing sustainability, operating profit excluding one-offs matters more, and in the quarter it was above last year's level.
Free cash flow turned negative at $2.12bn on $34.91bn of capex
Operating cash flow was $32,786m, above last year's $29,999m. But capital expenditures, including finance lease payments, were $34,910m, and free cash flow turned negative at -$2,120m versus +$10,625m a year earlier.
This is a direct consequence of AI infrastructure investment. The company reiterated 2026 capex guidance of $135-145bn, narrowing the range from $130-145bn. Pressure on free cash flow will therefore persist into Q4.
Dividends and equivalents cost $1,361m, and no share repurchases were made in the quarter. With negative free cash flow, payouts are funded from accumulated liquidity: cash and marketable securities stood at $82,450m at quarter-end.
Leverage of 0.42x EBITDA LTM is low, but it cannot be compared with last year
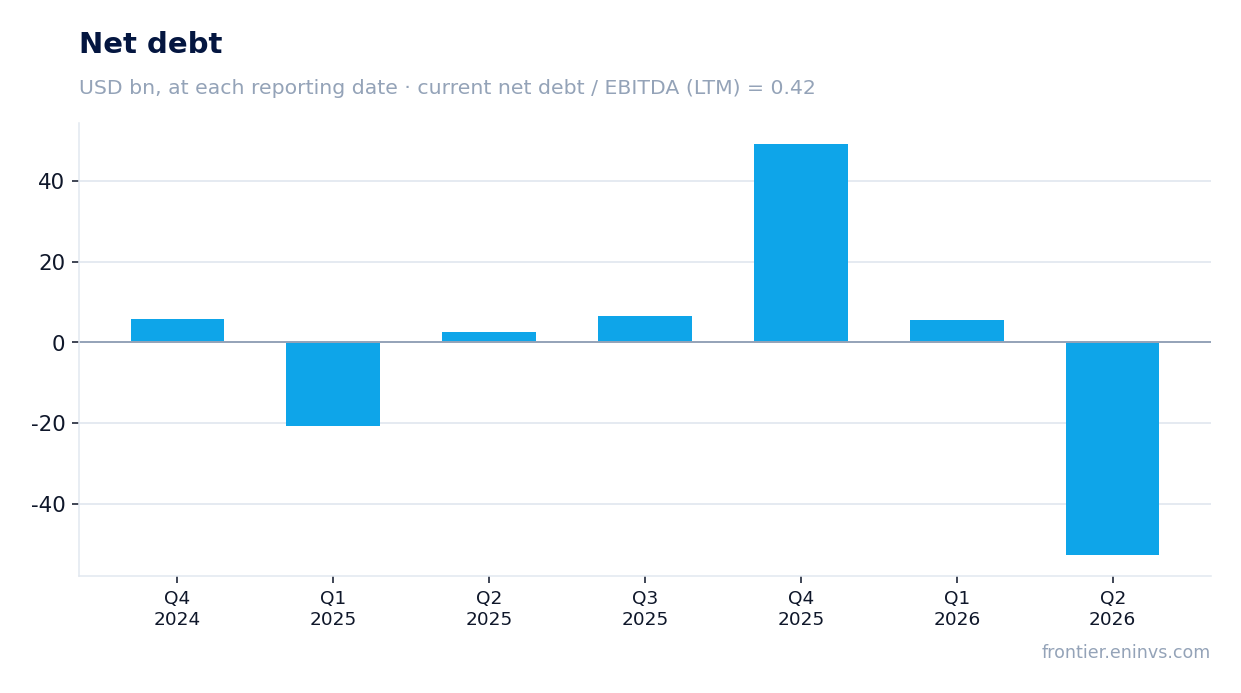
Net debt at the latest annual balance sheet was $49,208m, or 0.42x trailing-twelve-month EBITDA. That is a low level: long-term debt of $80,922m against equity of $272,386m, with $82,450m of liquidity covering most of the debt.
The company raised $24,910m of new long-term debt in 2026, as shown in the cash flow statement. This funds investment rather than refinancing distressed debt. Interest expense is not disclosed as a separate line, but interest and other income contributed only $13m in the quarter.
Comparing 0.42 with last year's level is not possible: no earlier ratio is in the facts. One can only say that absolute net debt rose, but with LTM EBITDA of $116,186.9m even a doubling of debt would not push leverage into dangerous territory.
The stock is cheaper than its own history on EV/EBITDA, while the portal model shows only +5%
EV/EBITDA LTM is 15.6 against a three-year average of 16.6, 6% below its own history. P/E LTM is 23.4. On these multiples the stock does not look overheated, especially with 26% revenue growth.
The portal model, which compares EBITDA growth with a target multiple, implies +5% upside to fair value. That is modest: the market has already priced in a recovery in operating profit after the one-off charge.
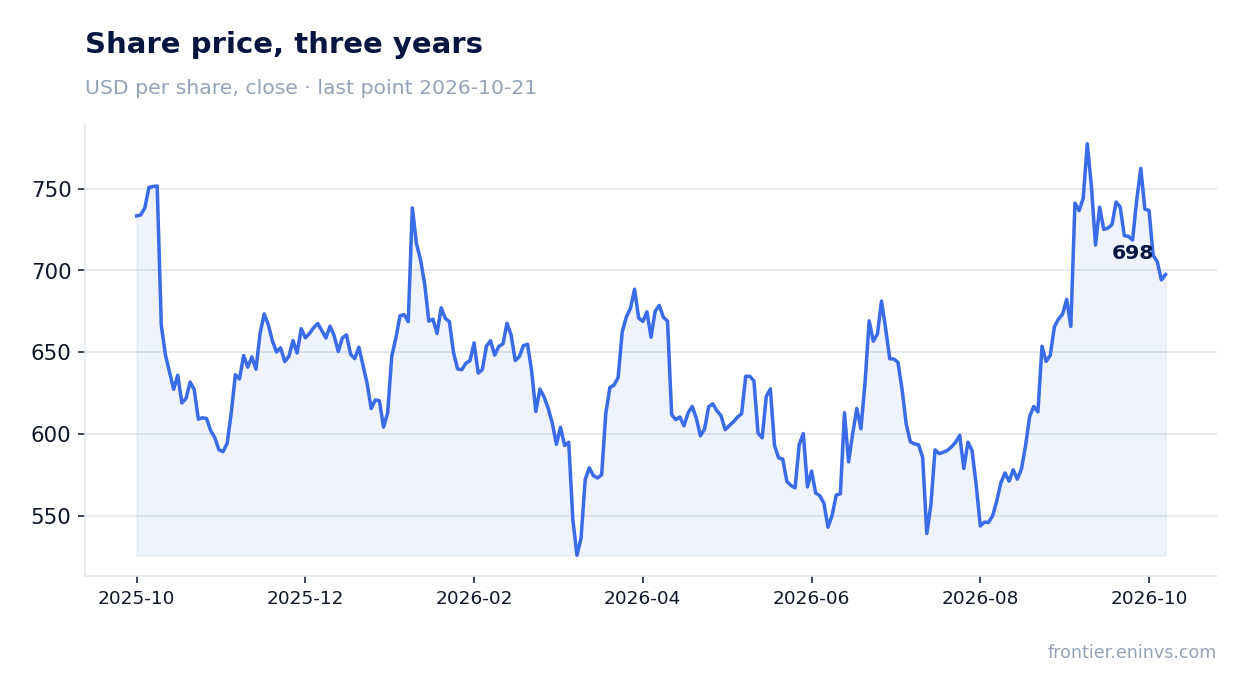
The market reaction was muted: the stock added 0.5% on the release day and another 0.5% from the release to 21 October. Investors appear to focus on decelerating revenue and rising capex rather than on one-off profit.
A 0.30% dividend yield plays no role in the valuation
The trailing twelve-month dividend yield is 0.30%. Quarterly payouts were $1,361m and nine-month payouts $4,060m. For a company with a market cap of $1,764,473m this is a token amount and does not compete with debt market yields.
The payout policy is not disclosed in the report, but with negative free cash flow and 2026 capex of $135-145bn the dividend remains more a signal than a capital return tool. The main return channel is buybacks, which were not used this quarter.
For valuing the stock the dividend provides no support: 0.30% offsets neither the risk of decelerating revenue nor capex volatility. It does not enter the verdict.
Valuation on the latest reported figures
| Metric | Value |
|---|---|
| Market cap | 1 764 bn USD |
| P/E (LTM) | 23.4 |
| EV/EBITDA (LTM) | 15.6 |
| P/B | 8.12 |
| Net debt / EBITDA (LTM) | 0.42 |
| Operating cash flow (LTM) | 133 bn |
| ROE | 4.9% |
| Dividend yield (12m) | 0.3% |
| EV/EBITDA, 3-year average | 16.6 |
Bottom line
The strong part of the report is revenue: $64,601m, up 26.1%, with average price per ad up 14%. The weak part is free cash flow, which turned negative at -$2.12bn on $34.91bn of capex. Net income tripled, but largely because of last year's low tax base and the $9.89bn one-off charge, which also distorts the margin. The stock is cheaper than its own history on EV/EBITDA (15.6 vs 16.6), but the portal model shows only +5%, and decelerating revenue and rising investment cap the upside. The verdict is rather attractive: the below-history valuation and low leverage outweigh the one-offs, but a quarter with positive free cash flow is needed to confirm.
Open the company's financial profile META →
See also: market overview · valuation map · stock screeners