MGM Resorts International: revenue slipped 0.9% as Las Vegas and lease costs weighed on profit again
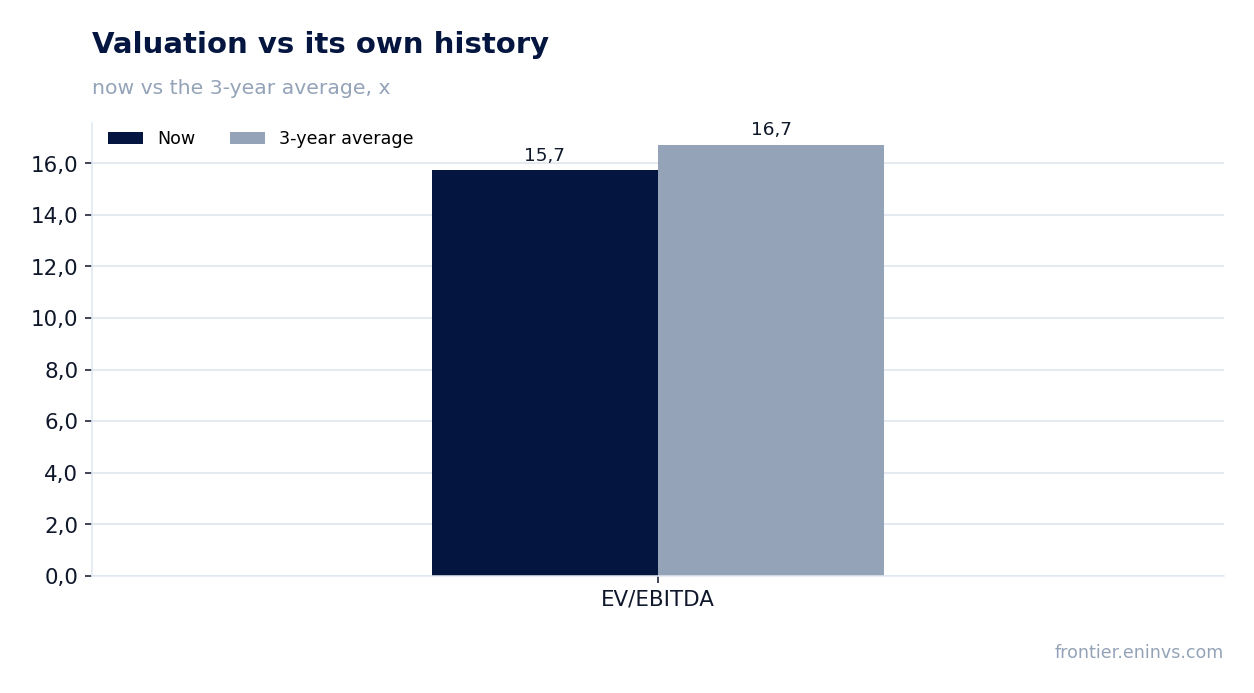
On 28 October MGM Resorts International reported third-quarter 2026 results. Revenue came in at USD 4,211.9 million, down 0.9% year on year, adjusted EBITDA at USD 395.1 million and net profit at minus USD 17.1 million. The revenue decline accelerated from the 1.0% growth seen in the second quarter, while Las Vegas weakness and heavy lease costs kept the margin flat. At an EV/EBITDA of 15.7 versus its own three-year average of 16.7 the stock looks cheaper than its history, but the portal's model puts fair value 34% below the market, so the verdict is neutral.
Key takeaways
— Revenue fell 0.9% after 1.0% growth a quarter earlier – the trend decelerated
— Adjusted EBITDA dropped 2.2% and the margin stayed at 9.4%
— Las Vegas fell 2% on an 8% ADR decline, while regional operations dropped 8% on the Northfield Park disposal
— MGM China grew 5% and took a record 17.1% market share, but its EBITDAR fell 7% on the licence fee
— The net loss narrowed to USD 17.1 million from USD 285.3 million a year earlier, but the base included a one-off goodwill impairment
— Net debt fell to USD 27.1 billion from USD 29.4 billion a year earlier, yet the ratio to EBITDA remains high at 11.69
— EV/EBITDA of 15.7 is below its own three-year average of 16.7, but the portal's model implies minus 34% to fair value
Attractiveness
Key figures, USD bn
| Metric | Q3 2025 | Q3 2026 | Change |
|---|---|---|---|
| Revenue | 4.25 | 4.21 | -0.9% |
| EBITDA | 0.40 | 0.40 | -2.2% |
| Operating profit | -0.11 | 0.12 | to profit |
| Net profit | -0.29 | -0.02 | — |
| Operating cash flow | 0.68 | 0.53 | -21.9% |
| Capex | 0.28 | 0.22 | -19.7% |
| EBITDA margin | 9.5% | 9.4% | -0.1 pp |
| Net margin | -6.7% | -0.4% | +6.3 pp |
Revenue fell 0.9% after 1.0% growth a quarter earlier – the trend decelerated
In the third quarter of 2026 revenue was USD 4,211.9 million, 0.9% below the prior year. Second-quarter growth was 1.0%, so the trend decelerated. Two segments drove the decline: Las Vegas lost 2% of revenue and regional operations 8%.
The 8% regional drop is largely explained by the April 2026 disposal of MGM Northfield Park. On a same-store basis, excluding the divested asset, regional revenue rose 1% to USD 883.2 million. Organic momentum there is slightly positive, and the headline decline reflects a smaller perimeter.
Las Vegas fell to USD 1,954.3 million. Casino revenue rose 8%, but the hotel side weakened: room revenue dropped 6%, ADR fell 8% and RevPAR fell 8%. Occupancy held at 89%, so the issue is pricing rather than demand.
MGM China grew 5% to USD 1,138.2 million and reached a record 17.1% market share. MGM Digital added 6% to USD 183.7 million. These two segments partly offset the US casino weakness but could not push consolidated revenue into positive territory.
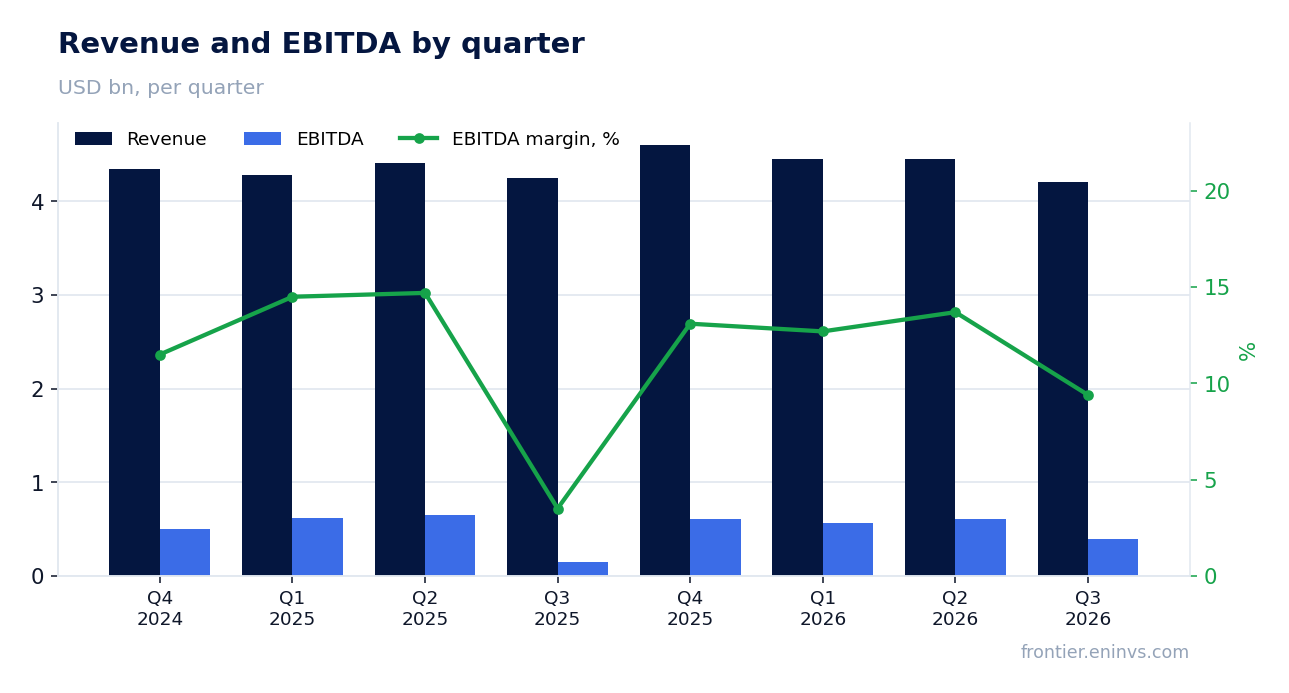
Adjusted EBITDA dropped 2.2% and the margin stayed at 9.4%
Adjusted EBITDA for the third quarter was USD 395.1 million versus USD 505.8 million a year earlier, a 2.2% decline. The margin was essentially unchanged at 9.4% versus 9.5%. With revenue falling, the margin held thanks to lower lease expense and an improved digital result.
Triple net lease rent was USD 548.9 million versus USD 564.7 million a year earlier, down USD 15.8 million. This is one of the largest lines shaping EBITDA: without it segment results would look materially better. Lower rent partly explains why the margin did not fall with revenue.
Segment results were mixed. Las Vegas EBITDAR fell 12% to USD 530.8 million, regional operations 18% to USD 242.6 million and MGM China 7% to USD 264.0 million. The digital segment narrowed its loss to USD 4.2 million from USD 23.2 million. Income from unconsolidated affiliates also helped: the BetMGM and other share rose to USD 31.4 million from USD 25.6 million.
Las Vegas and regional weakness outweighed China and digital growth. A 9.4% margin is thin for a company of this revenue scale, and any further price weakness in Las Vegas would pressure it more than Asian growth can offset.
Las Vegas fell 2% on an 8% ADR decline, while regional operations dropped 8% on the Northfield Park disposal
Las Vegas revenue fell to USD 1,954.3 million from USD 1,984.6 million a year earlier. Casino revenue rose 8% to USD 488 million, with table games win up 17% at a 25.3% hold versus 22.6%. But the hotel side weakened: room revenue dropped 6% to USD 622 million, ADR fell 8% to USD 218 and RevPAR fell 8% to USD 193.
Occupancy held at 89%, meaning hotels were as full as a year earlier but at lower prices. That points to price competition or a shift in the guest mix rather than falling demand. CEO Bill Hornbuckle says in the release that lower room rates affected the quarter and that October has rebounded favourably.
Regional operations fell to USD 883.2 million from USD 956.9 million. On a same-store basis revenue rose 1% to USD 883.2 million, so the entire decline is the disposal of MGM Northfield Park, sold in April 2026. Same-store regional EBITDAR fell 7% to USD 242.6 million, pointing to cost pressure even without the divested asset.
Weak Las Vegas pricing and falling regional profitability are the main risk for the US business. Casino revenue growth in Las Vegas does not offset the room-side losses, because hotel revenue carries a higher margin.
MGM China grew 5% and took a record 17.1% market share, but its EBITDAR fell 7% on the licence fee
MGM China revenue rose 5% to USD 1,138.2 million and market share reached a record 17.1%. Casino revenue added 4% to USD 981 million, with mass table win up 1% at a 27.7% hold versus 24.7%. Revenue growth on a 10% drop in drop means the company earned on higher margin rather than on betting volume.
Despite revenue growth, segment EBITDAR fell 7% to USD 264.0 million. The reason is a higher intercompany licence fee: branding expense rose USD 22 million year on year to USD 41 million. The fee eliminates in consolidation but directly reduces segment profit.
MGM China remains the group's main growth driver and the only large segment with positive revenue momentum. Its contribution to consolidated EBITDA is limited by intercompany charges, so a record market share does not translate into record group profit.
For investors, the Chinese business is growing faster than the market and holds a high mass-table margin. If the licence fee stays at the current level, the segment will generate a stable but not growing stream.
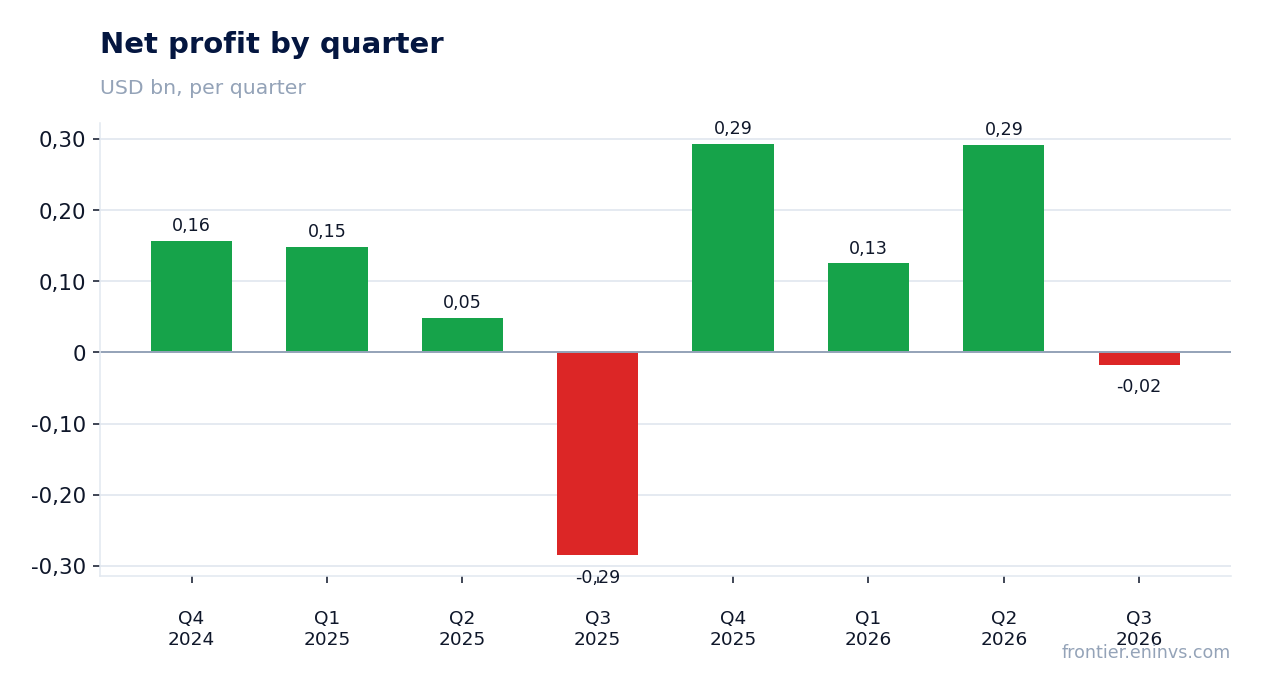
The net loss narrowed to USD 17.1 million from USD 285.3 million a year earlier, but the base included a one-off goodwill impairment
Net loss attributable to MGM Resorts was USD 17.1 million versus USD 285.3 million a year earlier. The USD 268.1 million improvement looks large, but the prior-year base contained a one-off USD 256.1 million goodwill impairment. Without it the prior-year loss would have been materially smaller.
Operating income in the third quarter was USD 118.7 million versus a loss of USD 112.9 million a year earlier. The difference is also largely explained by the absence of the goodwill impairment and lower property transactions expense, down to USD 7.6 million from USD 101.8 million. There is operational improvement, but it is partly cosmetic.
Adjusted EPS was negative at minus USD 0.11 versus plus USD 0.24 a year earlier. The adjusted measure strips out one-offs and shows the quarter was loss-making without them. That matters more than the narrower net loss.
GAAP EPS was minus USD 0.07. The gap between GAAP and adjusted profit mainly reflects losses on debt and equity investments, partly offset by currency items. For assessing business resilience the adjusted measure is the right guide, and it is negative.
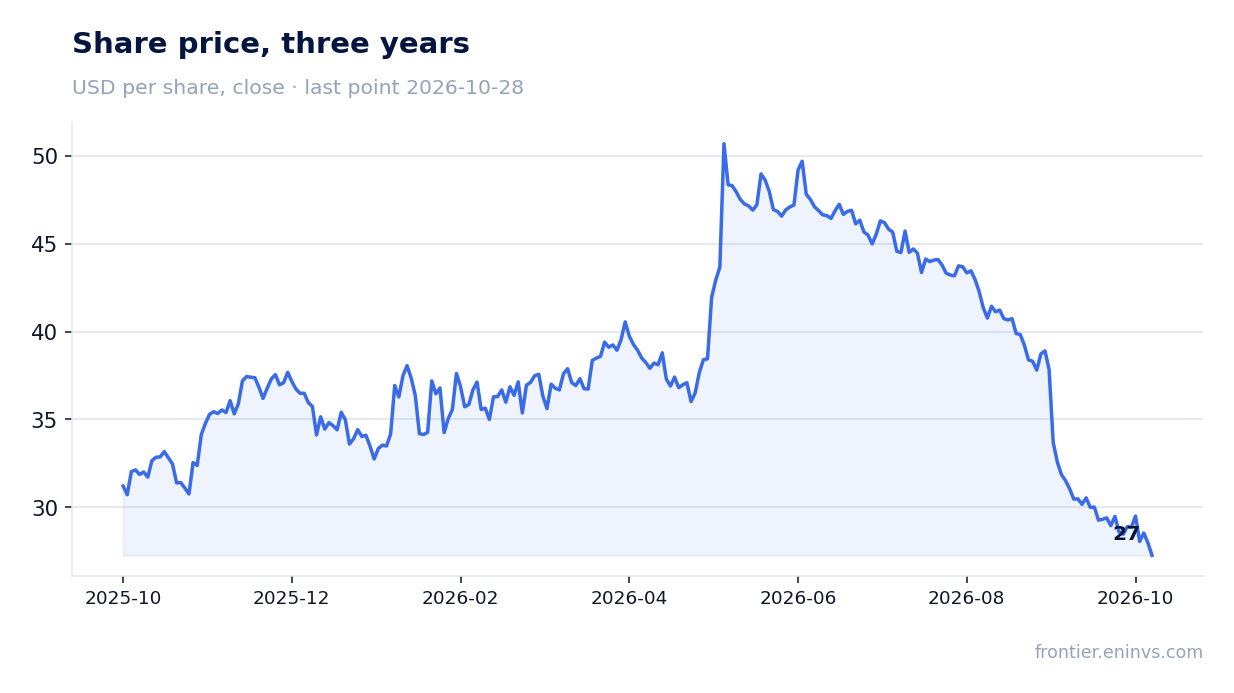
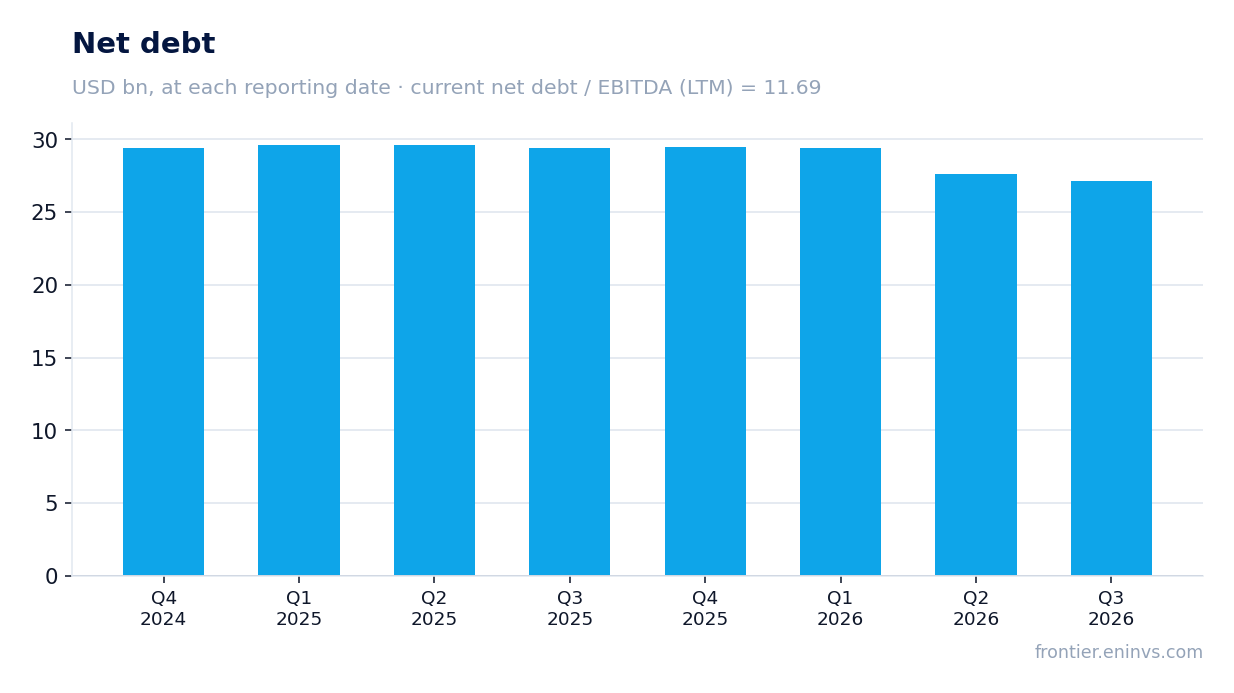
Net debt fell to USD 27.1 billion from USD 29.4 billion a year earlier, yet the ratio to EBITDA remains high at 11.69
Net debt at 30 September 2026 was USD 27,145.3 million. From 30 June it fell from USD 27,611.7 million, a USD 0.5 billion quarterly decline, and from 30 September 2025 from USD 29,387.4 million, down USD 2.2 billion over the year. Lower debt alongside capital expenditure cut to USD 221.7 million for the quarter supports the balance sheet.
The ratio of net debt to trailing-twelve-month EBITDA is 11.69. That is a high level reflecting both significant debt and compressed EBITDA. Operating cash flow for the quarter was USD 532.5 million, covering capital expenditure of USD 221.7 million but leaving little room to reduce debt.
Interest expense for the quarter was USD 102.6 million, roughly flat year on year. Against quarterly EBITDA of USD 395.1 million, interest absorbs about a quarter of operating profit. That limits further debt reduction without EBITDA growth.
The USD 2.2 billion annual debt reduction is a positive signal, but it is largely tied to asset sales including MGM Northfield Park. The durability of that trend depends on generating enough free cash flow without new disposals.
EV/EBITDA of 15.7 is below its own three-year average of 16.7, but the portal's model implies minus 34% to fair value
The trailing-twelve-month EV/EBITDA multiple is 15.7. Its own three-year average is 16.7, so the stock trades 6% below its history on this measure. That is the one argument in favour of the valuation: versus its own past the share is cheaper.
Trailing-twelve-month P/E is 10.1, reflecting earnings that include one-off items. Return on equity is negative at minus 2.7%, unsurprising given the quarterly net loss. Trailing-twelve-month profit was USD 694.1 million, but it is unstable.
The portal's model, which compares EBITDA growth with a target multiple and market capitalisation, implies minus 34% to fair value. That is the portal's own estimate, not a market consensus. It suggests the current price already discounts a profit recovery that has not yet appeared.
Market capitalisation is USD 7,044.5 million. With net debt of USD 27.1 billion the enterprise is worth about USD 34.2 billion, which against trailing-twelve-month EBITDA of USD 2,322.8 million gives the 15.7 multiple. For a company with falling revenue and high leverage, that multiple does not look cheap even if it is below its own history.
Valuation on the latest reported figures
| Metric | Value |
|---|---|
| Market cap | 7.04 bn USD |
| P/E (LTM) | 10.1 |
| EV/EBITDA (LTM) | 15.7 |
| P/B | 2.90 |
| Net debt / EBITDA (LTM) | 11.69 |
| Operating cash flow (LTM) | 2.31 bn |
| ROE | -2.7% |
| EV/EBITDA, 3-year average | 16.7 |
Bottom line
The quarter was mixed. MGM China grew 5% and took a record 17.1% market share, the digital segment narrowed its loss and net debt fell USD 2.2 billion over the year. But group revenue dropped 0.9%, Las Vegas lost 2% on an 8% ADR decline, and adjusted EPS stayed negative at minus USD 0.11. The narrower net loss of USD 17.1 million largely reflects the absence of last year's USD 256.1 million goodwill impairment rather than operational improvement. At EV/EBITDA of 15.7 versus its own three-year average of 16.7 the stock is cheaper than its history, but the portal's model implies minus 34% to fair value and leverage remains high. The verdict is neutral: Las Vegas recovery potential and China growth are balanced by a thin margin and pressure on profit.
Open the company's financial profile MGM →
See also: market overview · valuation map · stock screeners