Magnolia Oil & Gas: revenue up 58.2% after WildFire deal, but quarterly margin and profit slipped

On October 1, Magnolia Oil & Gas Corporation released an interim financial and operational update following the closing of its acquisition of WildFire Energy. Third-quarter 2026 revenue came in at $513.89 million, up 58.2% year on year, EBITDA was $302.462 million (+42.6%), and net profit was $80.475 million (+6.7%). Revenue growth accelerated from 50.1% in Q2 2026, but the EBITDA margin fell to 58.9% from 65.3% and the net margin to 15.7% from 23.2%. At the current price the share looks neutral: the acquisition-driven growth is strong, but leverage has risen and the EV/EBITDA multiple is above its own three-year history.
Key takeaways
— Q3 2026 revenue rose 58.2% year on year to $513.89 million, an acceleration from 50.1% in Q2 2026
— The Q3 2026 EBITDA margin fell to 58.9% from 65.3% a year earlier, even as absolute EBITDA rose 42.6%
— Q3 2026 net profit added only 6.7% to $80.475 million, and the net margin dropped to 15.7% from 23.2%
— Net debt at the end of Q3 2026 stood at $1,979.521 million, equal to 2.33x trailing-twelve-month EBITDA
— Q3 2026 operating cash flow was $368.979 million and capital expenditure was $150.759 million
— The trailing-twelve-month dividend yield is 2.82%, and the company promises to return a substantial portion of free cash flow to shareholders
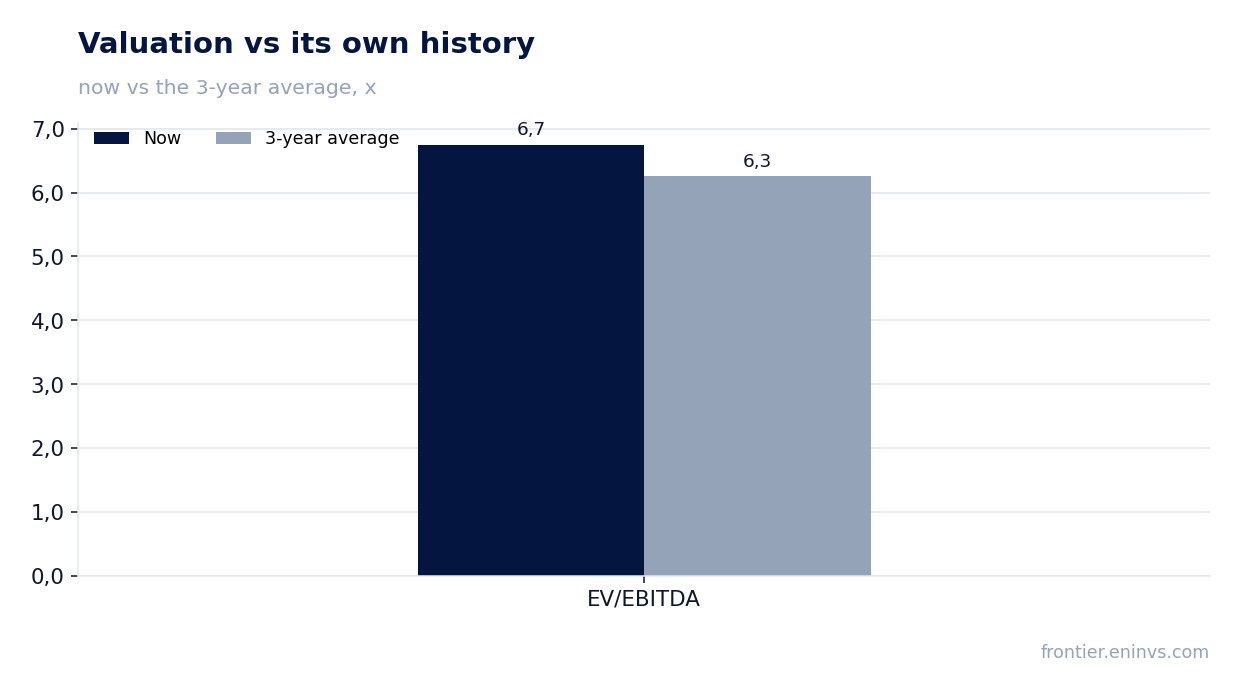
— The trailing-twelve-month EV/EBITDA is 6.7, 8% above its own three-year average of 6.3, meaning the share is more expensive than its own history
Attractiveness
Key figures, USD bn
| Metric | Q3 2025 | Q3 2026 | Change |
|---|---|---|---|
| Revenue | 0.32 | 0.51 | +58.2% |
| EBITDA | 0.21 | 0.30 | +42.6% |
| Operating profit | 0.10 | 0.15 | +52.4% |
| Net profit | 0.08 | 0.08 | +6.7% |
| Operating cash flow | 0.25 | 0.37 | +49.4% |
| Capex | 0.12 | 0.15 | +26.6% |
| EBITDA margin | 65.3% | 58.9% | -6.4 pp |
| Net margin | 23.2% | 15.7% | -7.5 pp |
Q3 2026 revenue rose 58.2% year on year to $513.89 million, an acceleration from 50.1% in Q2 2026
Q3 2026 revenue was $513.89 million, 58.2% above the level of Q3 2025. In Q2 2026 growth was 50.1%, so the pace accelerated. The jump is tied to the closing of the WildFire Energy acquisition, which the company announced in the same October 1 release.
The release states that Q3 2026 production is expected at 116–118 thousand barrels of oil equivalent per day, of which about 42% is oil. This is the first quarter with a partial contribution from WildFire assets, and it provided the bulk of the revenue increase. Organic growth without the deal would have been considerably more modest.
The company reaffirms its target of mid-single-digit organic annual growth of 4–5% for both oil volumes and total production after integration. For Q4 2026, the first full quarter with WildFire, production is guided at 159–161 thousand barrels of oil equivalent per day with an oil share of 49–50%.
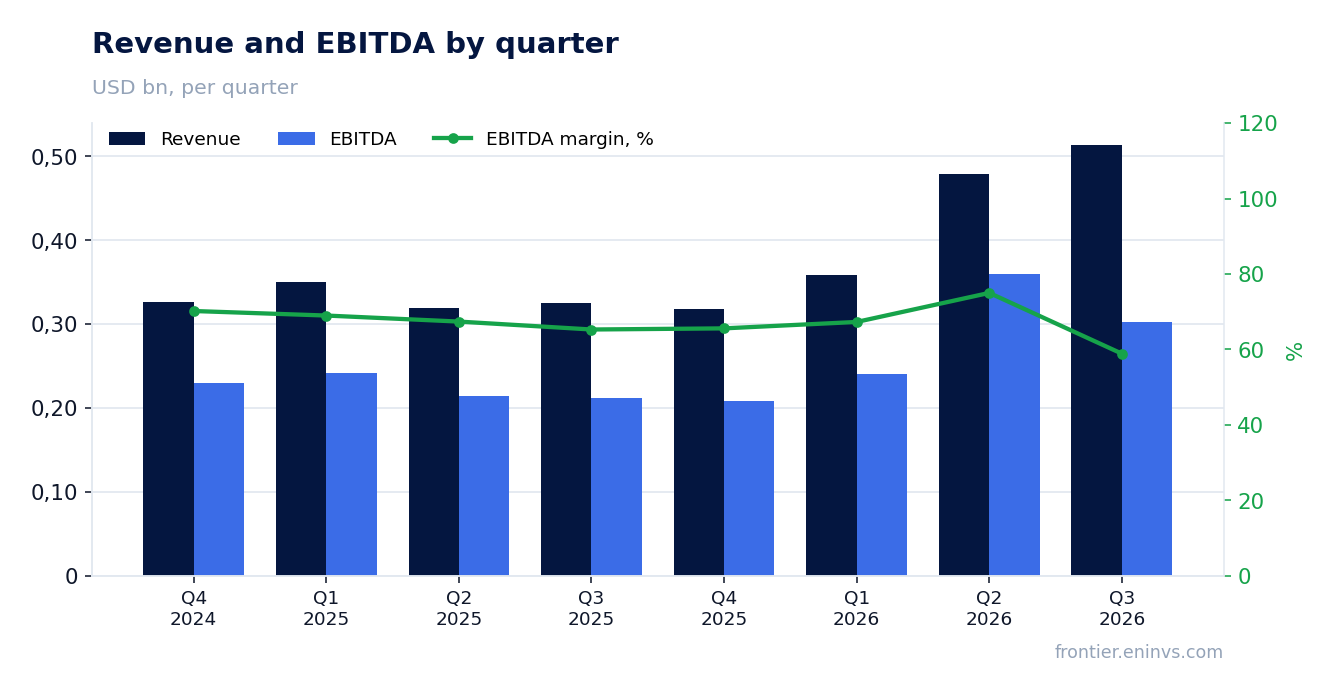
The Q3 2026 EBITDA margin fell to 58.9% from 65.3% a year earlier, even as absolute EBITDA rose 42.6%
Q3 2026 EBITDA was $302.462 million, 42.6% more than a year earlier. At the same time the EBITDA margin fell to 58.9% from 65.3% in Q3 2025. The absolute figure rose, but its ratio to revenue declined.
The margin decline is tied to the integration of WildFire assets and one-off costs. The release states that the company expects one-time transaction and integration-related costs of approximately $65–75 million in Q3. In addition, $14 million was spent on 3D seismic over the newly acquired acreage, which will be reflected as exploration expense.
Q3 2026 operating profit was $154.599 million. The company does not disclose a detailed cost breakdown in this interim release, so the exact contribution of each factor to the margin decline is not given. However, the one-off costs themselves explain part of the gap between revenue and EBITDA growth.
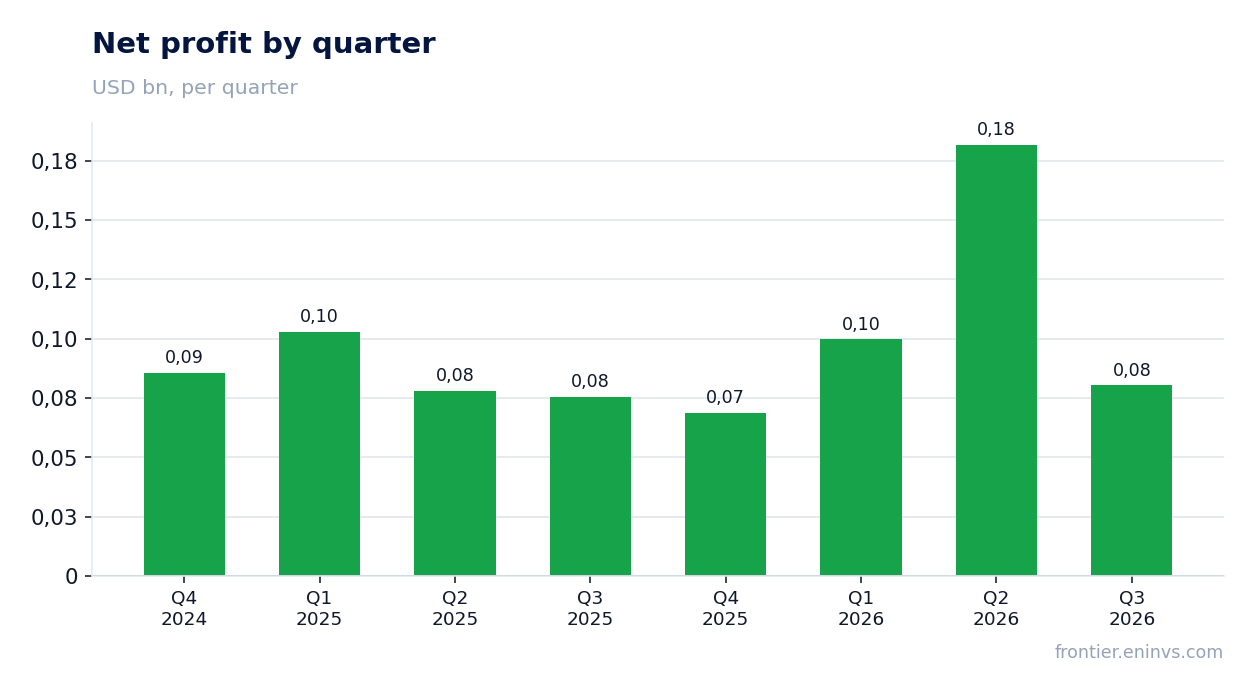
Q3 2026 net profit added only 6.7% to $80.475 million, and the net margin dropped to 15.7% from 23.2%
Q3 2026 net profit was $80.475 million, only 6.7% above the level of Q3 2025. The net margin fell to 15.7% from 23.2%. The gap between 58.2% revenue growth and near-zero profit growth is explained by one-off costs and higher interest expense.
The release states that interest expense in Q4 2026 is expected in the range of $35–40 million. This reflects servicing the debt raised to finance the WildFire purchase. Higher interest expense weighs on net profit, although the company does not disclose the exact amount for Q3.
The one-time transaction and integration costs of $65–75 million mentioned in the release also reduced profit. Without them net profit would have been higher, but the company does not provide an adjusted figure. For the investor it matters that these costs are one-off and should not recur in Q4.
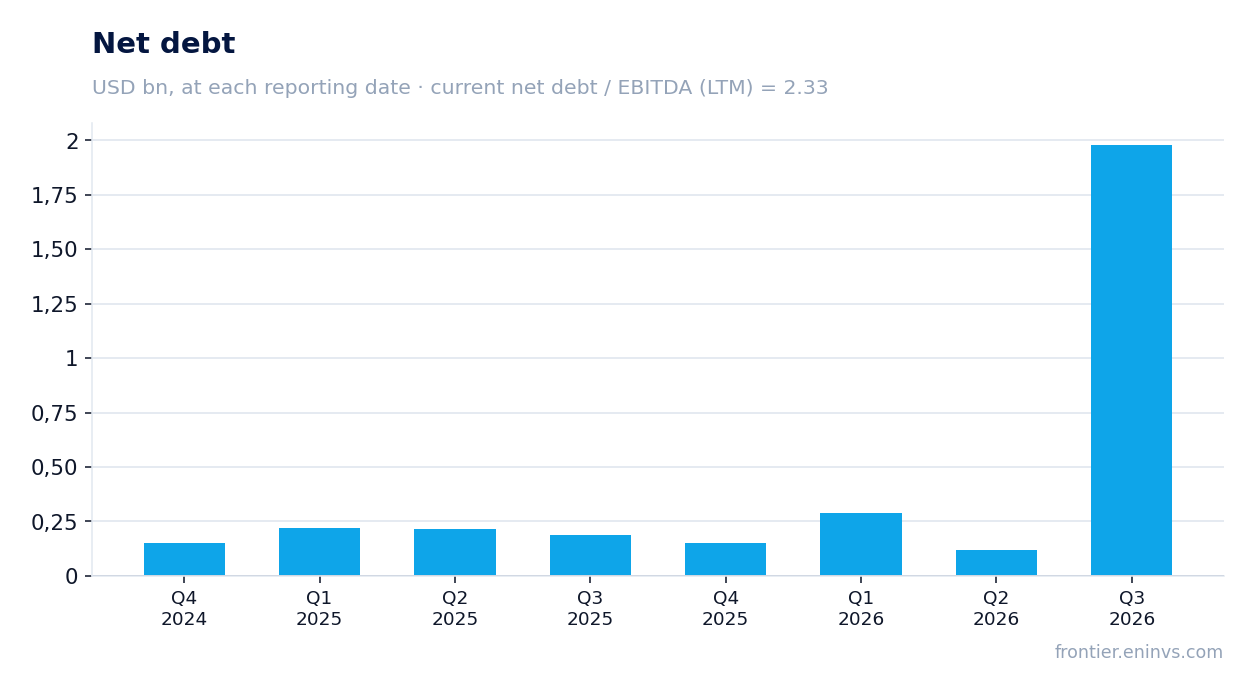
Net debt at the end of Q3 2026 stood at $1,979.521 million, equal to 2.33x trailing-twelve-month EBITDA
Net debt at September 30, 2026 was $1,979.521 million. This is a sharp increase: at June 30, 2026 it was $0.1 billion, and at September 30, 2025 it was $0.2 billion. The change over the quarter was plus $1.9 billion, over 12 months plus $1.8 billion.
The ratio of net debt to trailing-twelve-month EBITDA is 2.33. The company notes in the release that net debt of $1.9 billion is below 1.0x 2027E EBITDA at current strip prices, and that the 0.5x target may be reached ahead of schedule. However, these benchmarks are based on projected EBITDA, not on the actual trailing-twelve-month figure.
The debt increase is tied to financing the WildFire Energy purchase. The release states that the company has already sold non-core assets for $47.5 million and received 616 net acres in Gonzales County. These proceeds go toward debt reduction. Nevertheless, the 2.33x level is a noticeable burden, even if it is below the 0.5x target for 2027.
Q3 2026 operating cash flow was $368.979 million and capital expenditure was $150.759 million
Q3 2026 operating cash flow was $368.979 million. Capital expenditure for the same period was $150.759 million. Free cash flow is therefore positive and substantial, allowing the company to fund dividends and reduce debt.
The release states that capital expenditure in Q3 was expected in the range of $155–165 million, and actually came in at $150.759 million. For Q4 2026 about $235 million is planned, reflecting the first full quarter with WildFire assets. The full-year 2027 guidance is $900–950 million.
The company also reports the sale of non-core assets for $47.5 million, which added to cash flow. These proceeds, together with operating cash flow, go toward debt reduction. At the same time capital expenditure remains moderate relative to operating cash flow, which supports the ability to return capital to shareholders.
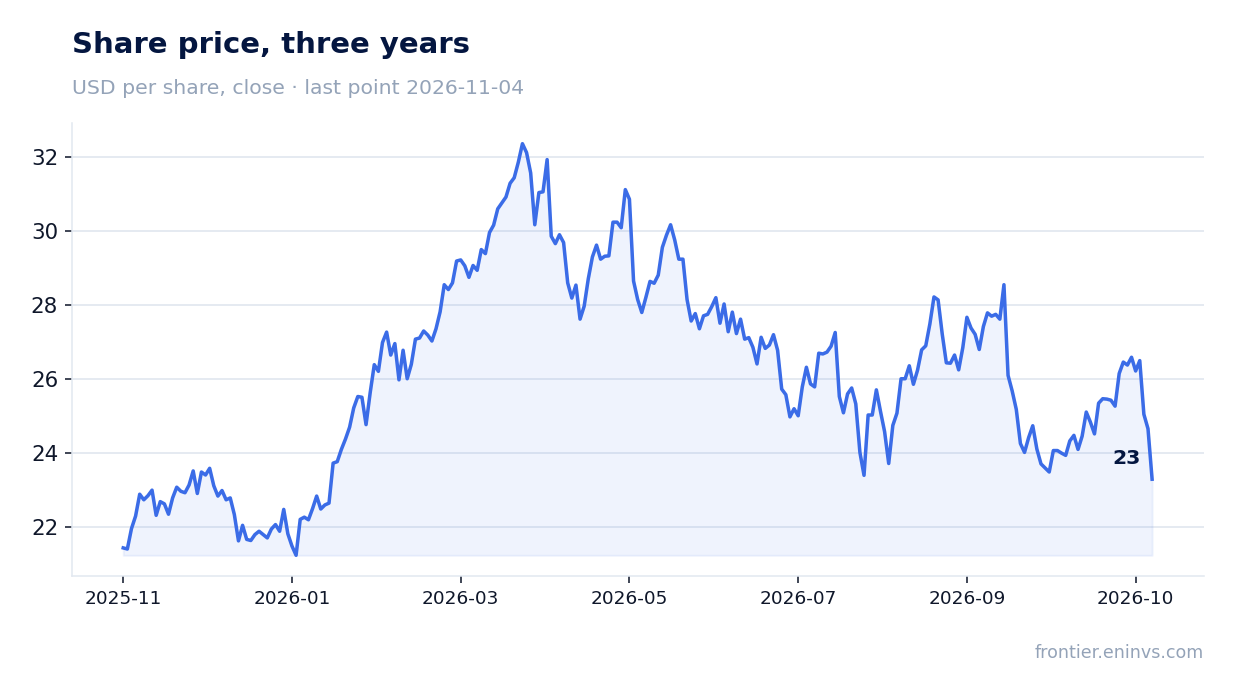
The trailing-twelve-month dividend yield is 2.82%, and the company promises to return a substantial portion of free cash flow to shareholders
The trailing-twelve-month dividend yield is 2.82%. The company reaffirms its commitment to a "safe, sustainable and growing dividend" and promises to repurchase at least 1% of shares per quarter. In Q3 2026 about 2.3 million shares were repurchased, with total shares outstanding at the end of the quarter at about 267 million.
Our estimate of the 2026 dividend is based on the current yield and the company's policy. With trailing-twelve-month net profit of $430.8 million and a market capitalisation of $5,520.18 million, a payout of 2.82% of capitalisation is about $155.7 million, corresponding to roughly 36% of profit. This is a moderate payout ratio, leaving room for dividend growth.
However, the rise in debt to $1,979.521 million and interest expense of $35–40 million in Q4 may limit the pace of dividend growth. The company prioritises reducing debt to 0.5x EBITDA, and part of free cash flow will go toward that. The 2.82% dividend yield is below the key rate, but the company compensates with share repurchases.
The trailing-twelve-month EV/EBITDA is 6.7, 8% above its own three-year average of 6.3, meaning the share is more expensive than its own history
The trailing-twelve-month EV/EBITDA is 6.7. Its own three-year average is 6.3. Thus the share trades 8% above its historical valuation. The trailing-twelve-month P/E is 12.8, and return on equity is 34.8%.
On the portal's model, which reprices EBITDA at current commodity prices at the target EV/EBITDA, the upside of the share to fair value is minus 46%. This means that at current commodity prices the share looks overvalued relative to the model. However, the portal's model is not a market consensus or a target price.
Comparison with its own history shows that the current multiple is above the three-year average. This may be justified by expectations of synergies from WildFire and production growth, but for now the market values the company more expensively than on average over the past three years.
Valuation on the latest reported figures
| Metric | Value |
|---|---|
| Market cap | 5.52 bn USD |
| P/E (LTM) | 12.8 |
| EV/EBITDA (LTM) | 6.7 |
| P/B | 2.68 |
| Net debt / EBITDA (LTM) | 2.33 |
| Operating cash flow (LTM) | 1.16 bn |
| ROE | 34.8% |
| Dividend yield (12m) | 2.8% |
| EV/EBITDA, 3-year average | 6.3 |
Bottom line
The strong side of the report was revenue growth of 58.2% and its acceleration from Q2, along with substantial operating cash flow of $368.979 million. However, net profit rose only 6.7%, and the margin declined due to one-off costs and higher interest expense. Leverage rose to $1,979.521 million, equal to 2.33x trailing-twelve-month EBITDA. The share trades above its three-year average EV/EBITDA, and the portal's model points to minus 46% upside. The verdict is neutral: business growth is impressive, but valuation and leverage balance it out.
Open the company's financial profile MGY →
See also: market overview · valuation map · stock screeners