Monster Beverage Corp: revenue up 16.7%, but margin compressed and growth decelerated
On November 5, Monster Beverage Corp reported third-quarter 2026 results. Revenue rose 16.7% year on year to $2,563.1 million, operating profit by 6.4% to $718.7 million, and net profit by 8.4% to $568.4 million. Revenue growth decelerated from 20.2% in the second quarter, and net margin fell to 22.2% from 23.9%. With an EV/EBITDA of 32.6 against its own three-year average of 26.8, the share looks expensive, so the verdict is neutral.
Key takeaways
— Revenue rose 16.7%, but growth decelerated from 20.2% in the second quarter
— International sales rose 28.1% and accounted for 47% of revenue
— Gross margin fell to 54.7% on aluminum and logistics costs
— One-off impairments and digital transformation ate into operating profit
— Net margin compressed to 22.2% from 23.9% a year earlier
— Leverage is negative: net debt to LTM EBITDA is -0.39
— The share trades above its own history: EV/EBITDA 32.6 versus the 26.8 average
Attractiveness
Key figures, USD bn
| Metric | Q3 2025 | Q3 2026 | Change |
|---|---|---|---|
| Revenue | 2.20 | 2.56 | +16.7% |
| EBITDA | 0.70 | — | — |
| Operating profit | 0.68 | 0.72 | +6.4% |
| Net profit | 0.52 | 0.57 | +8.4% |
| Operating cash flow | 0.75 | — | — |
| Capex | 0.04 | — | — |
| EBITDA margin | 32.1% | — | — |
| Net margin | 23.9% | 22.2% | -1.7 pp |
Revenue rose 16.7%, but growth decelerated from 20.2% in the second quarter
Revenue for the third quarter of 2026 was $2,563.1 million, up 16.7% year on year. This is a deceleration from the second quarter, when growth reached 20.2%. In the first quarter growth was even higher at 26.9%.
The core Monster Energy Drinks segment brought in $2,373.4 million, up 17.1%. Strategic Brands grew 19.8% to $156.4 million. The alcohol segment remains weak: its sales fell 13.6% to $28.5 million.
The deceleration in revenue growth is a key signal for investors. The company is still growing at a double-digit pace, but momentum is fading. The next report will show whether this is a one-off fluctuation or the start of a sustained trend.
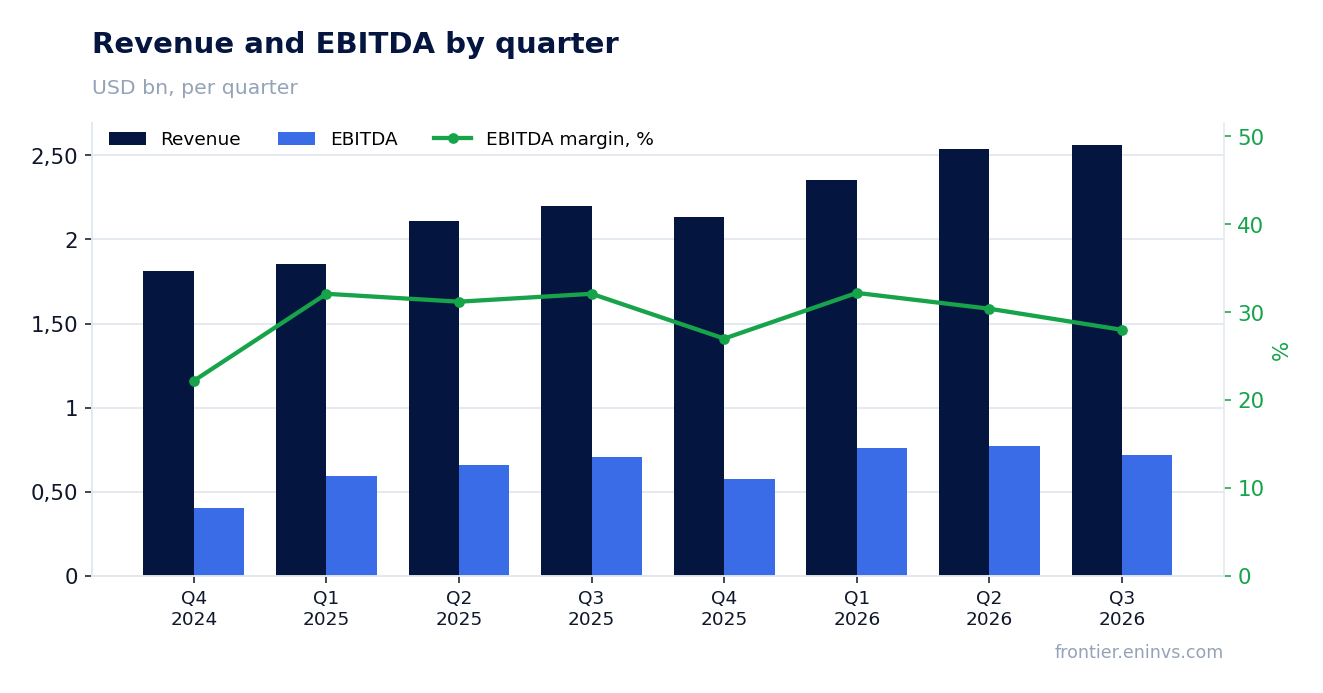
International sales rose 28.1% and accounted for 47% of revenue
Sales outside the United States rose 28.1% to $1,200.0 million and accounted for 47% of total revenue versus 43% a year earlier. This is the company's fastest-growing segment.
Latin America was particularly strong: sales in dollars grew 48.8%, driven primarily by operations in Brazil. Excluding currency effects, international sales rose 27.2%.
International expansion remains the main growth driver for Monster Beverage Corp. The share of overseas markets is rising, reducing dependence on the mature U.S. market. However, a stronger dollar could constrain dollar-denominated revenue in the future.
Gross margin fell to 54.7% on aluminum and logistics costs
Gross margin in the third quarter of 2026 was 54.7% versus 55.7% a year earlier. The 1 percentage point decline was driven by higher aluminum can costs, a change in geographic sales mix, and increased freight-in costs.
Pricing actions partially offset the margin pressure. Excluding the alcohol segment, adjusted gross margin was 54.9% versus 56.2% a year earlier.
The decline in gross margin is a worrying signal, given that the company cannot fully pass on cost increases to consumers. If aluminum prices remain high, pressure on profitability will persist.
One-off impairments and digital transformation ate into operating profit
Operating profit rose 6.4% to $718.7 million, but the growth rate was half that of revenue. In the reporting quarter, the company recognized a $19.9 million impairment of property and equipment related to the reclassification of land and real property in Kona, Hawaii, as held for sale.
In addition, digital transformation expenses amounted to $14.7 million. Excluding these one-off items, adjusted operating profit would have grown 7.1% to $748.1 million.
One-off impairments and digitalization investments are not operational problems but rather signs of the business adapting to new conditions. However, they eat into profit, and investors should watch how quickly these expenses pay off.
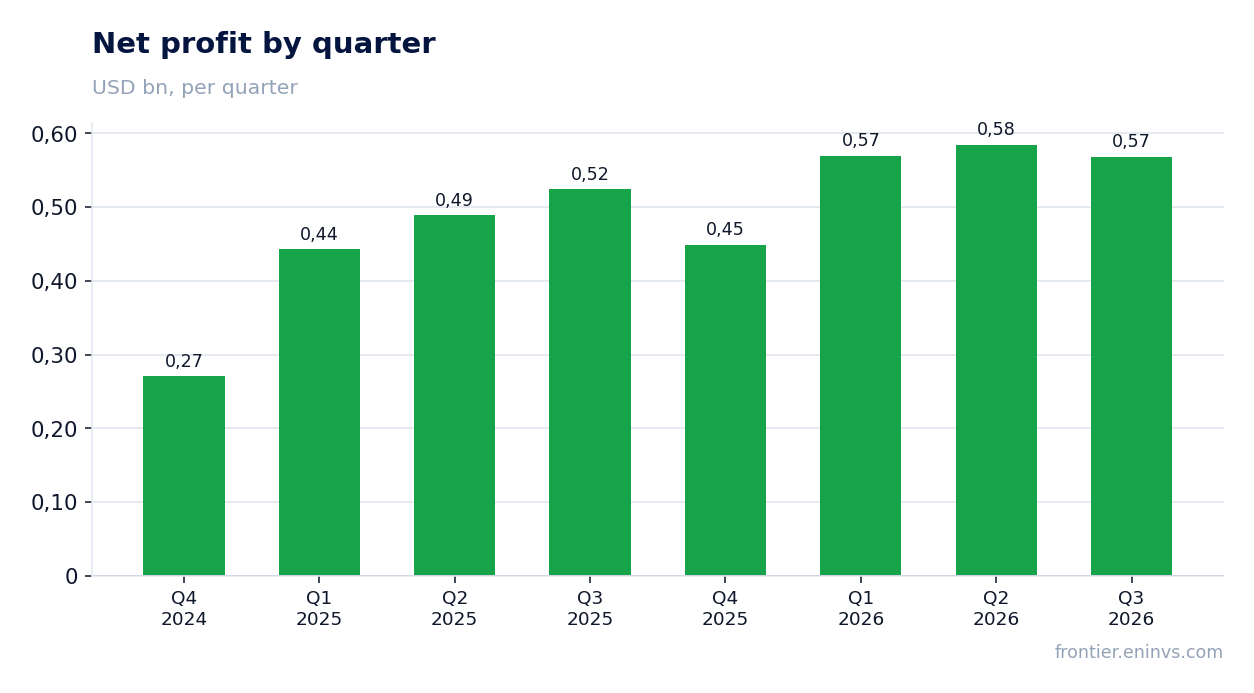
Net margin compressed to 22.2% from 23.9% a year earlier
Net profit rose 8.4% to $568.4 million, but net margin fell to 22.2% from 23.9% a year earlier. The main pressure came from lower gross margin and higher operating expenses.
The effective tax rate rose to 24.6% from 23.9%, which also reduced net profit. The increase in the tax rate was due to a lower stock-based compensation deduction and a higher share of income in high-tax jurisdictions.
The compression of net margin amid double-digit revenue growth indicates that the company cannot fully control costs. Restoring the margin will require either further price increases or lower raw material and logistics costs.
Leverage is negative: net debt to LTM EBITDA is -0.39
The company's net debt at the end of the latest reported balance sheet is -$1,098.7 million, meaning cash exceeds debt obligations. The ratio of net debt to trailing twelve-month EBITDA is -0.39.
Negative leverage is a sign of financial stability. The company does not depend on borrowed financing and has a liquidity cushion for investments or share buybacks.
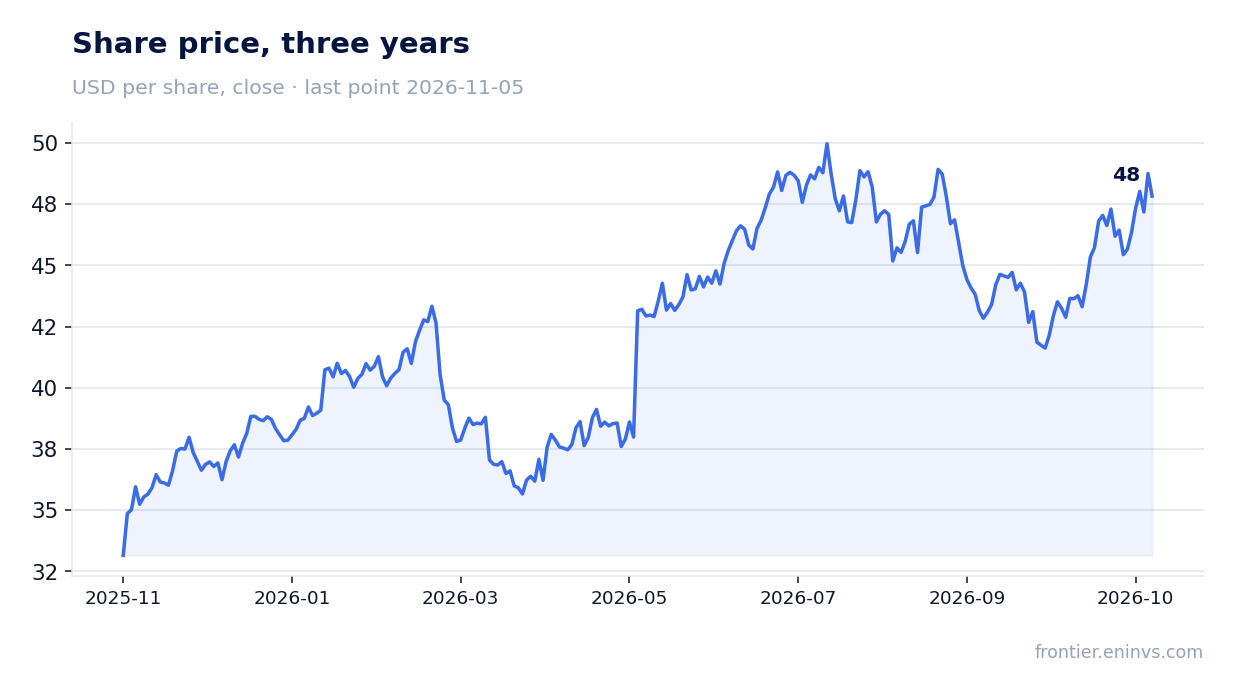
In the third quarter, Monster Beverage Corp repurchased about 2.3 million shares for approximately $100.0 million at an average price of $43.87 per share. The remaining buyback program as of November 4, 2026, was about $800.0 million.
The share trades above its own history: EV/EBITDA 32.6 versus the 26.8 average
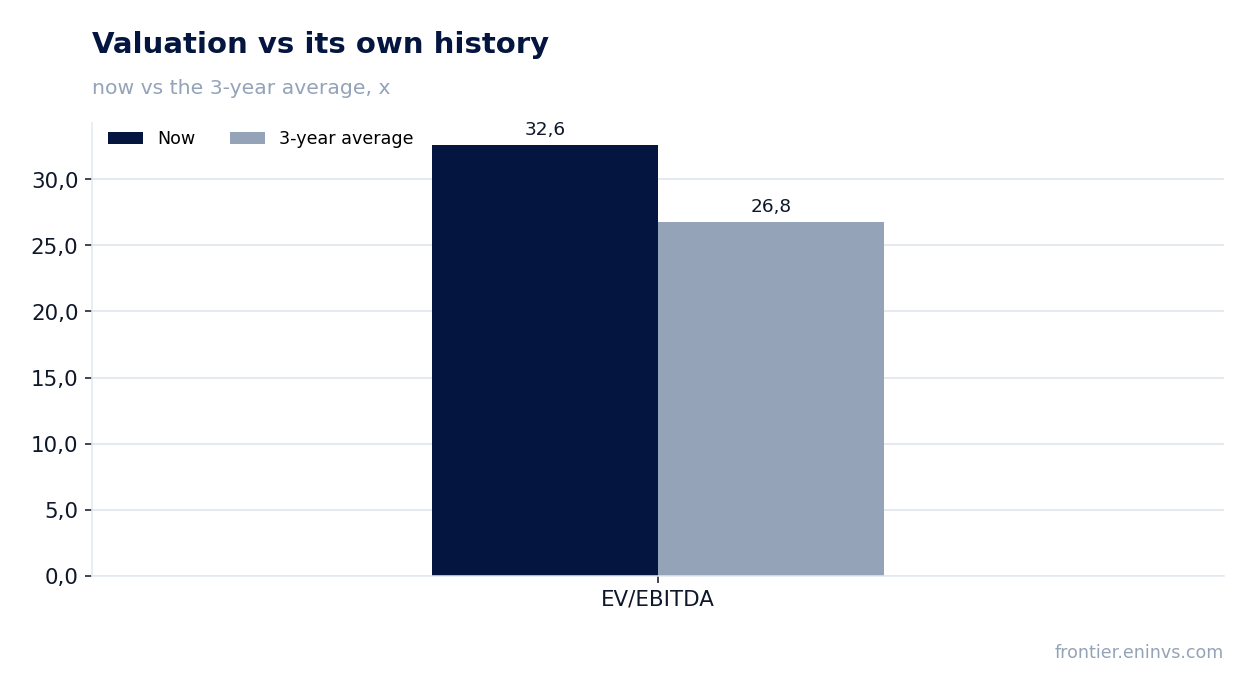
The trailing twelve-month EV/EBITDA multiple is 32.6, which is 22% above its own three-year average of 26.8. This indicates that the share is valued more expensively than usual.
The trailing twelve-month P/E is 43.1. Market capitalization is $93,701.4 million. According to the portal's model, the upside of the share to its fair value is estimated at only +1%.
The current valuation leaves no margin for error. If revenue growth continues to decelerate or the margin does not recover, the multiple could compress toward its historical average, putting pressure on the share price.
Valuation on the latest reported figures
| Metric | Value |
|---|---|
| Market cap | 93.7 bn USD |
| P/E (LTM) | 43.1 |
| EV/EBITDA (LTM) | 32.6 |
| P/B | 15.73 |
| Net debt / EBITDA (LTM) | -0.39 |
| ROE | 23.7% |
| EV/EBITDA, 3-year average | 26.8 |
Bottom line
The report's strengths are double-digit revenue growth, especially internationally, and negative leverage. However, growth decelerated and margin compressed due to rising costs and one-off impairments. The share trades above its own history on EV/EBITDA, which limits upside. The verdict is neutral: the current price already prices in a margin recovery and an acceleration in growth that are not yet visible.
Open the company's financial profile MNST →
See also: market overview · valuation map · stock screeners