Altria Group: profit up 6%, but the stock trades 34% above its own history

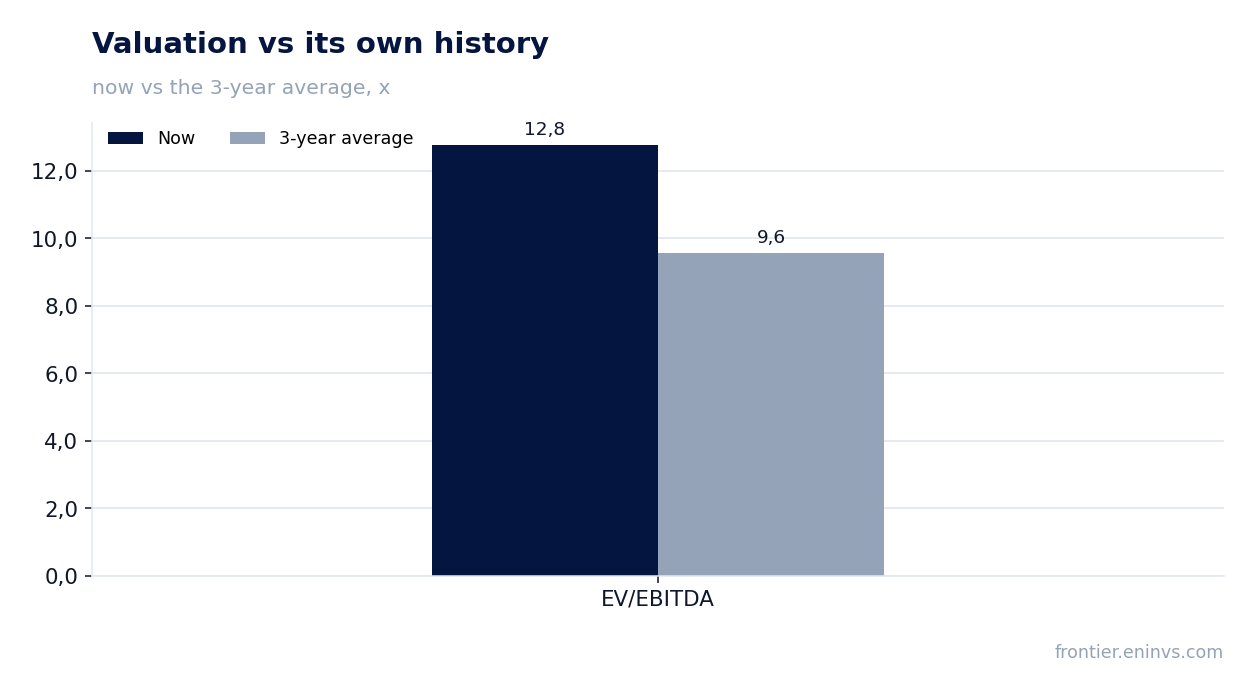
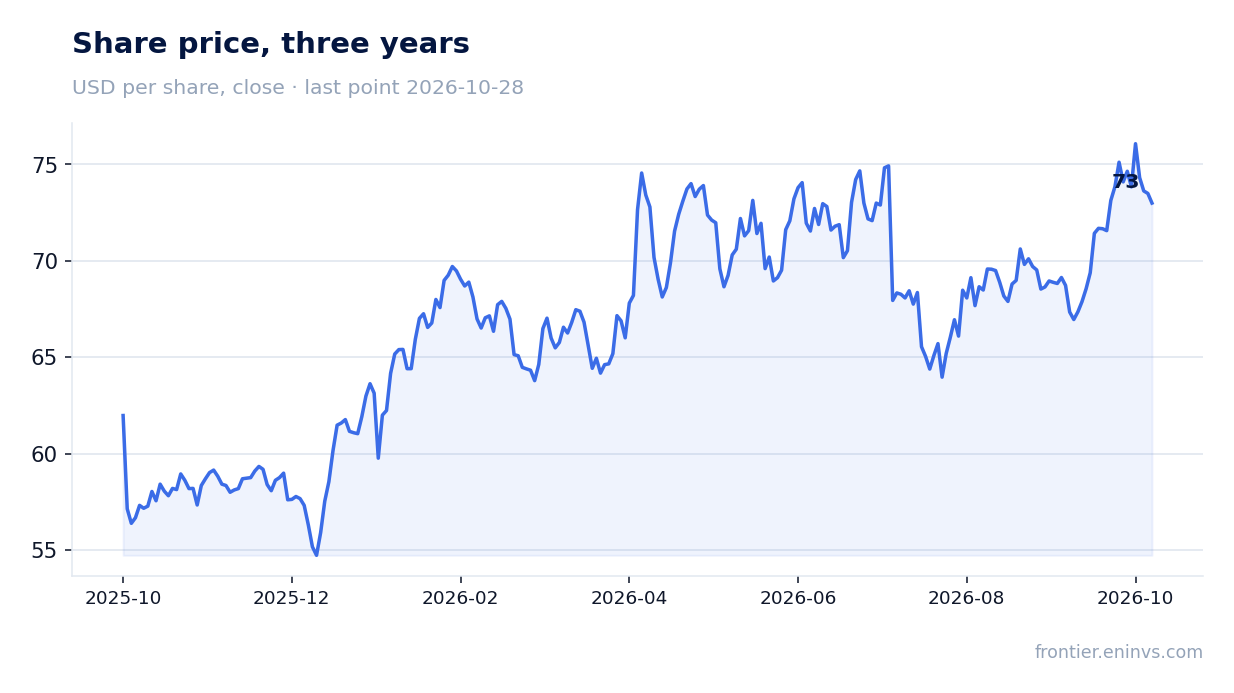
On 29 October Altria Group reported third-quarter 2026 results. Revenue came in at $6,132 million, up 1.0% year on year, EBITDA at $3,334 million (+1.0%), and net profit at $2,518 million (+6.0%). The EBITDA margin was essentially flat at 54.4% versus 54.3% a year earlier, while the net margin rose to 41.1% from 39.1%. The stock trades at EV/EBITDA of 12.8 against its own three-year average of 9.6 – 34% above its own history – and with a 5.7% dividend yield it looks neutral: strong cash generation and profit growth are offset by the premium to the historical multiple.
Key takeaways
— Revenue accelerated to +1.0% from +0.1% a quarter earlier, carried by the smokeable segment
— The EBITDA margin held at 54.4%, even as oral tobacco margin fell 2.8 pp
— Net profit rose 6.0%, helped by higher earnings from the ABI stake
— Operating cash flow for the quarter was $6,151 million – more than the two prior quarters combined
— The dividend was raised 4.7% and the buyback programme expanded by $1 billion
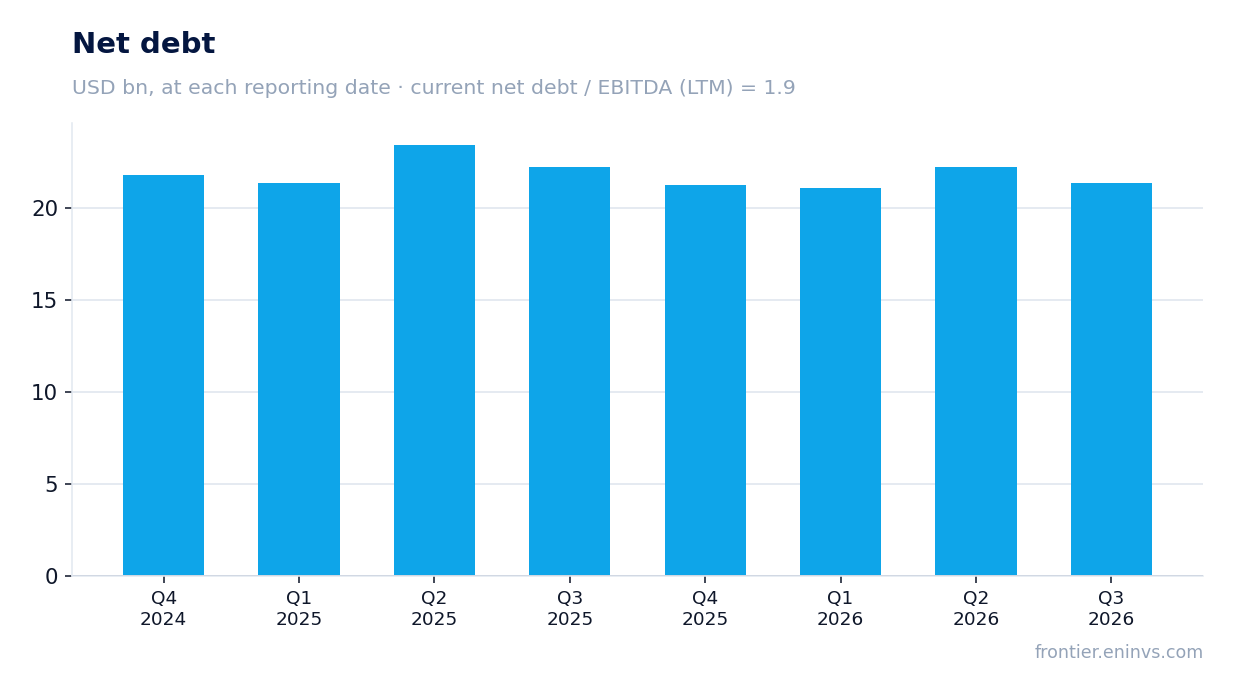
— Net debt of $21.4 billion equals 1.9x LTM EBITDA, a level stated without a direction
— EV/EBITDA of 12.8 is 34% above its own three-year average of 9.6
Attractiveness
Key figures, USD bn
| Metric | Q3 2025 | Q3 2026 | Change |
|---|---|---|---|
| Revenue | 6.07 | 6.13 | +1.0% |
| EBITDA | 3.30 | 3.33 | +1.0% |
| Operating profit | 3.23 | 3.31 | +2.6% |
| Net profit | 2.38 | 2.52 | +6.0% |
| Operating cash flow | 3.09 | 6.15 | +98.8% |
| Capex | 0.05 | — | — |
| EBITDA margin | 54.3% | 54.4% | +0.1 pp |
| Net margin | 39.1% | 41.1% | +2.0 pp |
Revenue accelerated to +1.0% from +0.1% a quarter earlier, carried by the smokeable segment
Third-quarter revenue was $6,132 million, up 1.0% year on year and clearly faster than the +0.1% of the second quarter. The acceleration is modest, but the direction matters: after three quarters of decline in 2025 the company has returned to growth and is building on it for a second consecutive quarter.
The main contribution came from the smokeable segment: its revenue rose 0.8% to $5,432 million on higher pricing, partly offset by promotional investment and lower shipments. Revenue net of excise taxes in the segment rose 3.7% – excise taxes fell by $127 million, which flatters the comparison base.
Oral tobacco remained the weak link: revenue of $688 million, down 0.1%, with shipments down 4.3%. Nicotine pouch volume growth of 13.3% did not offset declines at Copenhagen and Skoal, which fell 10.1% and 12.6% respectively.
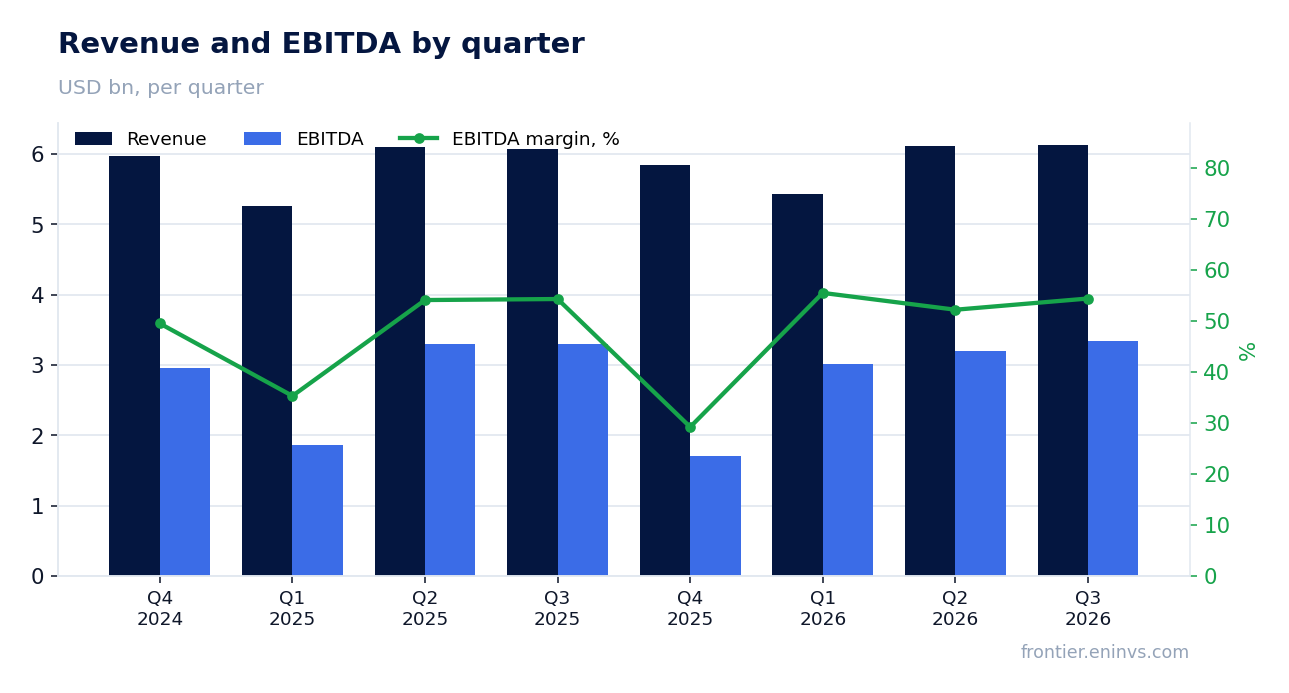
The EBITDA margin held at 54.4%, even as oral tobacco margin fell 2.8 pp
The EBITDA margin in the reported quarter was 54.4% against 54.3% a year earlier – essentially unchanged. The net margin rose to 41.1% from 39.1%, a more visible improvement.
In the smokeable segment the adjusted operating margin added 0.1 pp to 64.5%, helped by pricing and refunds of taxes and duties on imported cigarettes. In oral tobacco the margin fell 2.8 pp to 66.4% on lower shipments, higher costs including the USSTC facilities consolidation, and promotional investment.
Net profit growth of 6.0% to $2,518 million is partly explained by earnings from the ABI stake: the company booked $242 million on this line in the quarter against $107 million a year earlier. That is not an operating result and should be kept separate when judging the durability of profit.
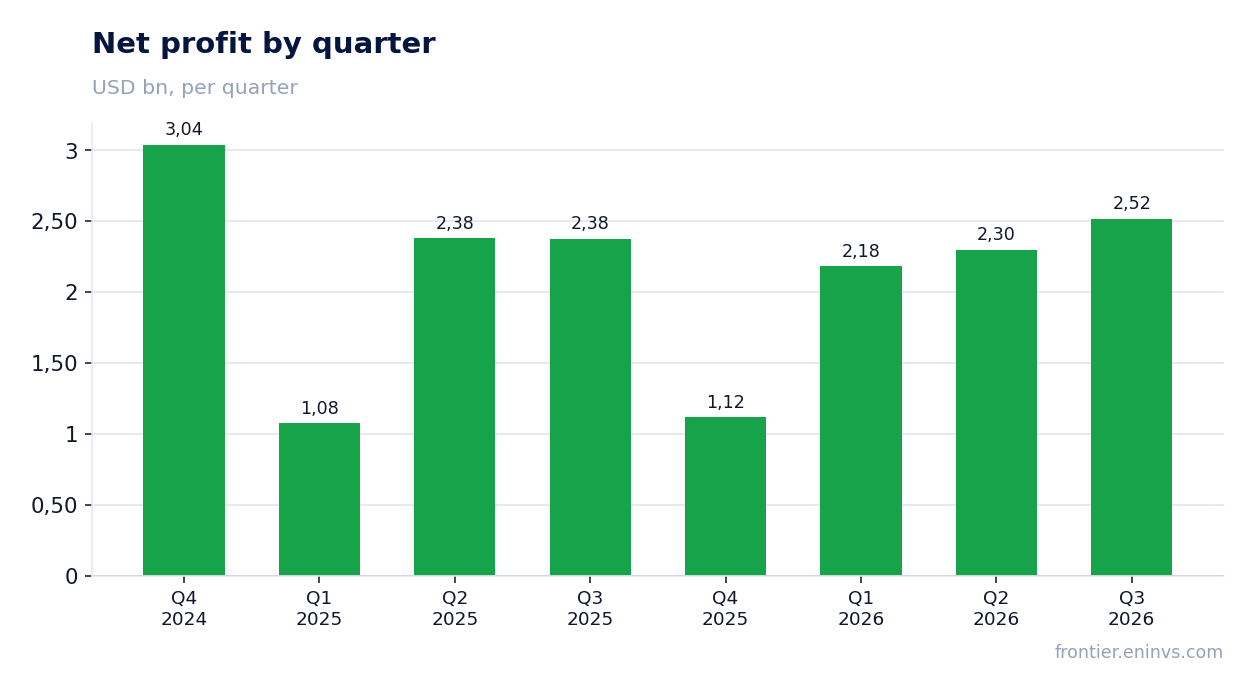
Net profit rose 6.0%, helped by higher earnings from the ABI stake
Net profit in the reported quarter was $2,518 million, 6.0% above a year earlier. Operating profit rose 2.6% to $3,313 million, so the core business grew more slowly than the bottom line.
The gap was closed by two lines below operating profit. Income from the ABI investment was $242 million against $107 million a year earlier, and interest expense fell to $270 million from $278 million. The effective tax rate rose 0.8 pp to 23.6%.
Adjusted diluted EPS rose 4.8% to $1.52, the metric the company uses to frame its annual guidance. Full-year 2026 guidance was raised to $5.66–5.74 per share, a growth rate of 4.5–6.0% from a base of $5.42 in 2025.
Operating cash flow for the quarter was $6,151 million – more than the two prior quarters combined
Operating cash flow in the reported quarter was $6,151 million – more than the $2,324 million in the first quarter and $719 million in the second combined. Over the last twelve months the flow reached $11,746 million.
Such quarterly dispersion reflects working capital and payment timing rather than a one-off event. The company remains a highly cash-generative business, and that cash funds the dividend and the buyback.
Dividends paid were $1.7 billion in the quarter and $5.3 billion over nine months. Buybacks were $400 million in the quarter and $735 million over nine months. Together that is about $6 billion returned to shareholders over nine months against a flow of $9.2 billion over the same period.
The dividend was raised 4.7% and the buyback programme expanded by $1 billion
In August the board raised the quarterly dividend 4.7%, the 61st increase in 57 years. The annual rate is now $4.44 per share, and the yield at the current price is 5.7%.
The company reaffirms a goal of mid-single-digit dividend per share growth annually through 2028. With adjusted EPS guidance of $5.66–5.74, a $4.44 payout implies a payout ratio of about 77–78% – our estimate from the figures the company gives.
Yesterday the board authorised a $1 billion expansion of the buyback programme, extended to the end of 2027. Buybacks support EPS: over nine months the diluted share count fell 0.8%.
The risk to the dividend is not cash flow but debt: net debt of $21.4 billion against LTM EBITDA of $11,233 million gives 1.9x. If ABI earnings fall or interest costs rise, room to raise the payout narrows.
Net debt of $21.4 billion equals 1.9x LTM EBITDA, a level stated without a direction
Net debt at 30 September 2026 was $21.4 billion. It fell from $22.2 billion at 30 June, and over twelve months from $22.2 billion at 30 September 2025.
The ratio of net debt to LTM EBITDA is 1.9x. That is a moderate level for a company with this margin and a stable cash flow, and it leaves room for shareholder returns.
Interest expense fell to $270 million in the quarter from $278 million a year earlier. On the current EBITDA base, debt service does not look burdensome, but sensitivity to rates remains.
EV/EBITDA of 12.8 is 34% above its own three-year average of 9.6
On EV/EBITDA the stock trades at 12.8 against its own three-year average of 9.6 – 34% above its history. That is the main argument against buying at the current price.
The LTM P/E is 15.1. With a 5.7% dividend yield and 6.0% quarterly profit growth, the market is already pricing in durable cash flow and continued payout increases.
On the portal's model, fair value implies +2% upside to the current price. That is our own estimate, not a market consensus, and it says the stock is valued close to fair.
Valuation on the latest reported figures
| Metric | Value |
|---|---|
| Market cap | 122 bn USD |
| P/E (LTM) | 15.1 |
| EV/EBITDA (LTM) | 12.8 |
| Net debt / EBITDA (LTM) | 1.90 |
| Operating cash flow (LTM) | 11.7 bn |
| ROE | -127.6% |
| Dividend yield (12m) | 5.7% |
| EV/EBITDA, 3-year average | 9.6 |
Bottom line
The quarter's strength was cash flow: $6,151 million over three months and $11,746 million over the year, with moderate debt at 1.9x EBITDA. Profit rose 6.0%, but part of that came from the ABI stake rather than the core business, whose operating profit grew 2.6%. The dividend was raised 4.7% for a 5.7% yield, and the buyback was expanded by $1 billion. The question for a holder now is price: EV/EBITDA of 12.8 is 34% above its own history, and the portal's model shows only +2% upside. Verdict – neutral: the business is solid, but the premium to the historical multiple absorbs most of the appeal.
Open the company's financial profile MO →
See also: market overview · valuation map · stock screeners