MODINE MANUFACTURING CO: revenue up 34.6% on data-center cooling, but net profit fell 32.4% on a one-off tax charge
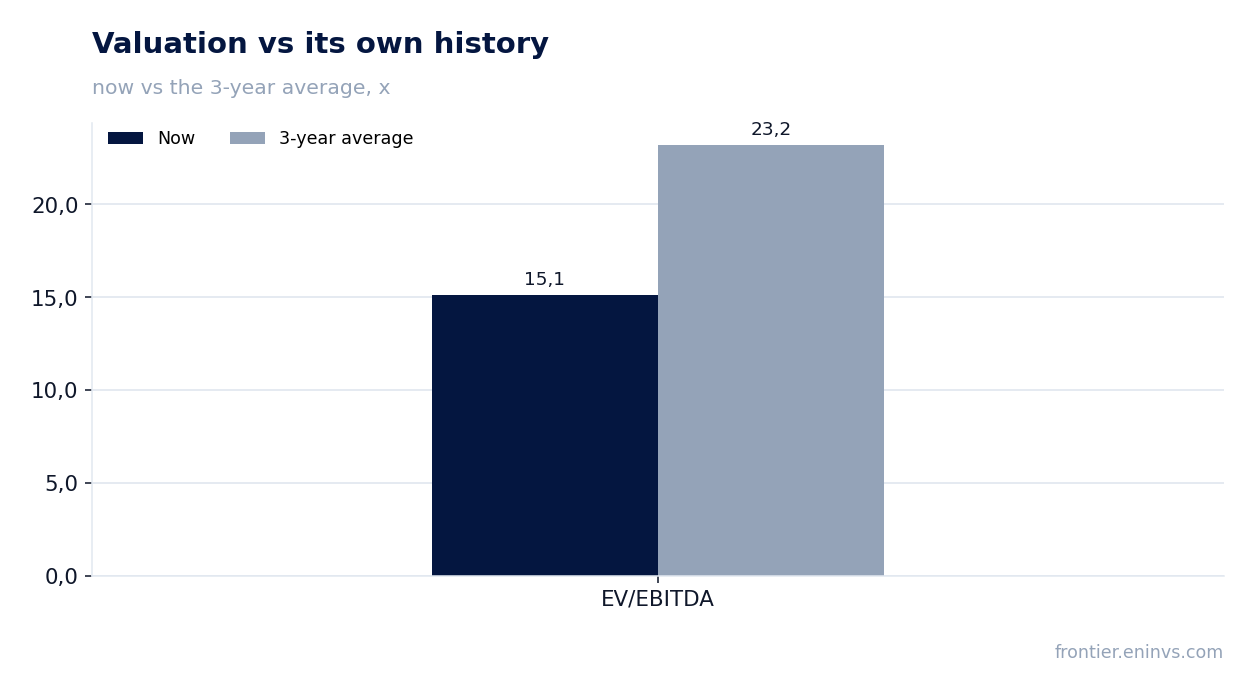
On November 3, MODINE MANUFACTURING CO reported results for the quarter ended September 30, 2026. Revenue rose 34.6% year on year to $994.4 million, adjusted EBITDA grew 40.0% to $136.2 million, while net profit fell 32.4% to $30.0 million: the quarter included $29.5 million of income tax expense related to legal entity restructuring ahead of the Performance Technologies spin-off. The business is growing fast, leverage is moderate, and the EV/EBITDA multiple of 15.1 sits below its own three-year average of 23.2, so the share looks rather attractive than neutral.
Key takeaways
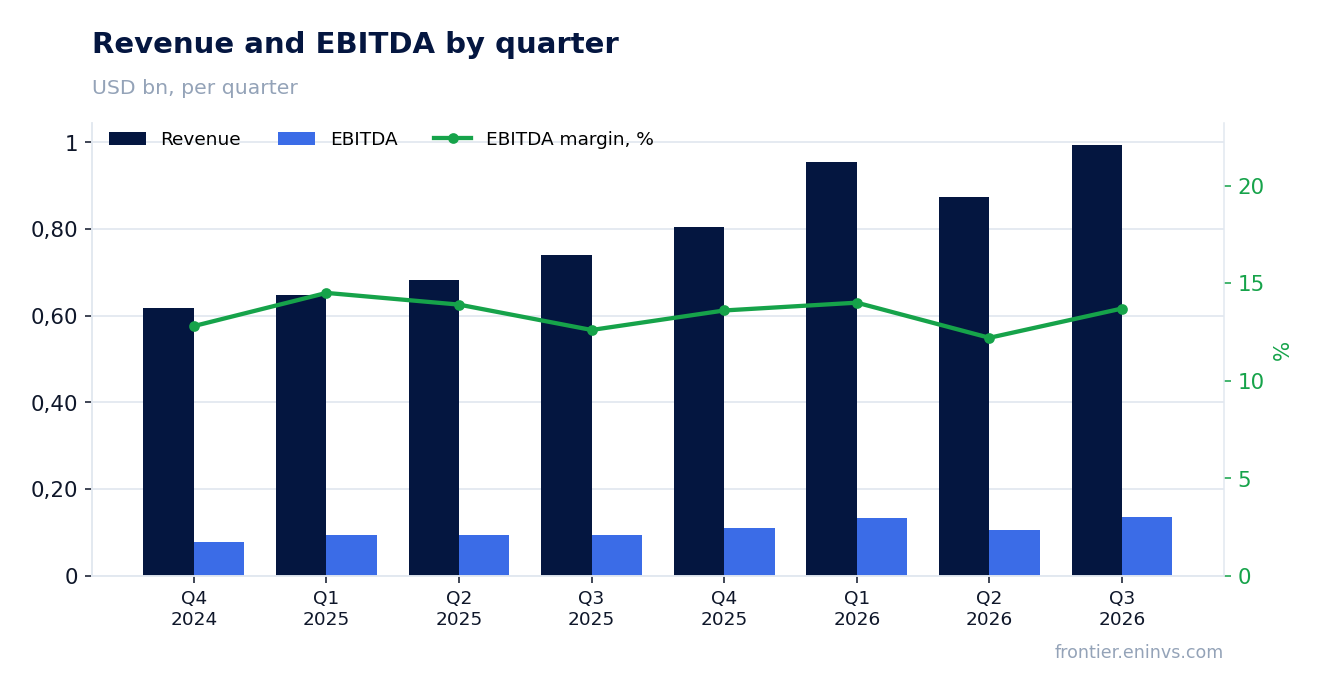
— Revenue rose 34.6% to $994.4 million, with almost all of the increase coming from Data Centers and Commercial HVAC
— Adjusted EBITDA grew 40.0% to $136.2 million, and the margin rose to 13.7% from 13.2%
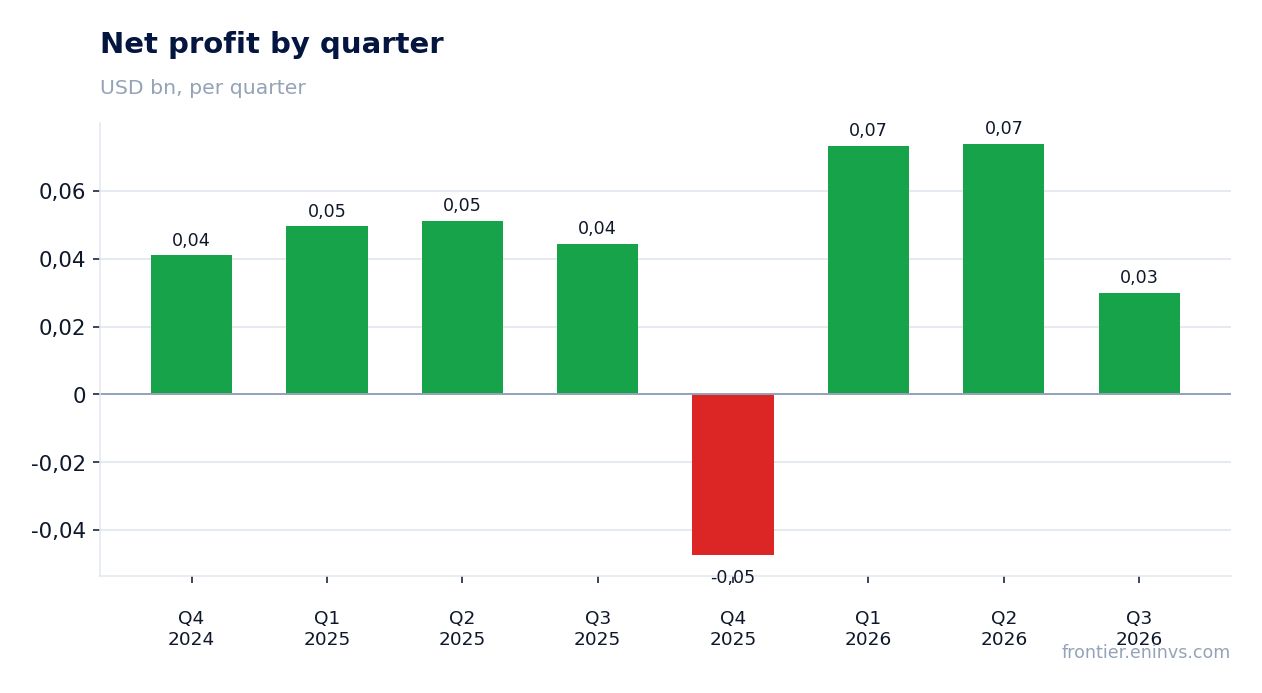
— Net profit fell 32.4% to $30.0 million because of $29.5 million of tax expense on restructuring ahead of the Performance Technologies spin-off
— Adjusted EPS rose 27% to $1.35, so operationally the business earns more than a year ago
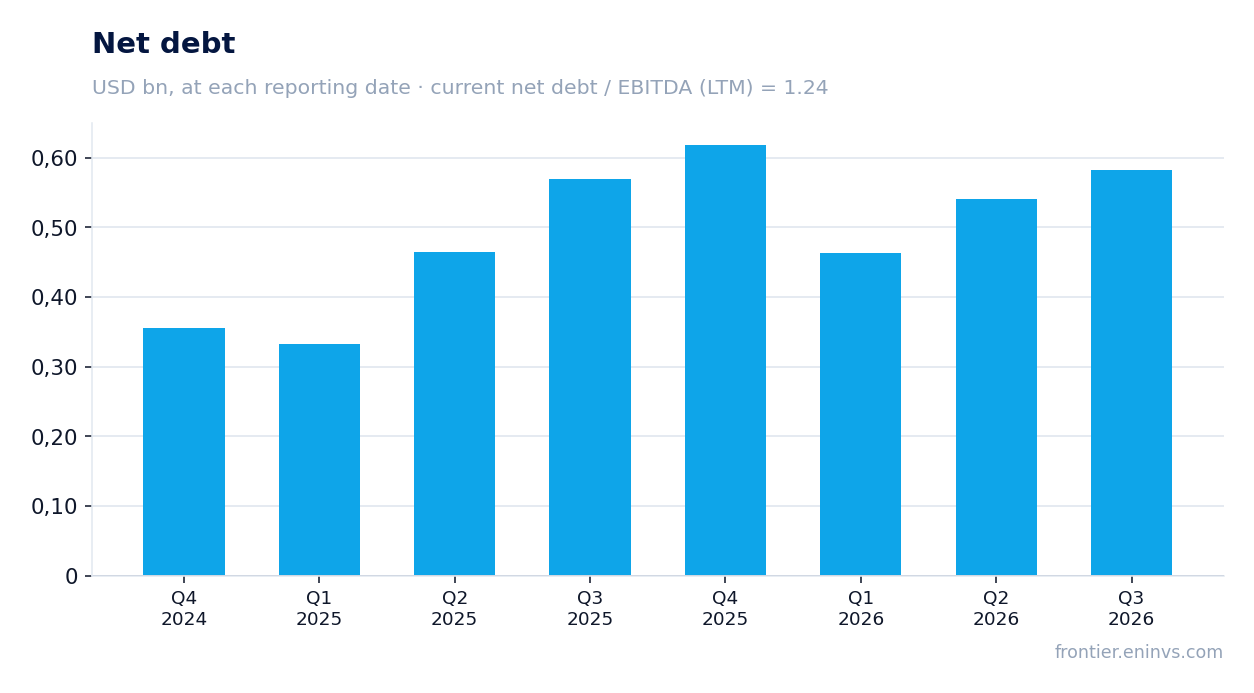
— Net debt is $0.6 billion at 1.24x LTM EBITDA – moderate leverage, but free cash flow for the half-year was negative
— EV/EBITDA LTM of 15.1 is 35% below its own three-year average of 23.2, and on the portal's model the share trades 7% below fair value
— The company raised its fiscal 2027 outlook: revenue of $3.1–3.2 billion and adjusted EBITDA of $470–500 million excluding Performance Technologies
Attractiveness
Key figures, USD bn
| Metric | Q3 2025 | Q3 2026 | Change |
|---|---|---|---|
| Revenue | 0.74 | 0.99 | +34.6% |
| EBITDA | 0.10 | 0.14 | +40.0% |
| Operating profit | 0.07 | 0.10 | +33.1% |
| Net profit | 0.04 | 0.03 | -32.4% |
| Operating cash flow | 0.03 | — | — |
| Capex | 0.06 | — | — |
| EBITDA margin | 13.2% | 13.7% | +0.5 pp |
| Net margin | 6.0% | 3.0% | -3.0 pp |
Revenue rose 34.6% to $994.4 million, with almost all of the increase coming from Data Centers and Commercial HVAC
Revenue for the quarter ended September 30, 2026 was $994.4 million against $738.9 million a year earlier. The $255.5 million increase came almost entirely from two segments: Data Centers sales rose 95% to $439.7 million, Commercial HVAC rose 23% to $285.5 million. Performance Technologies, which the company spun off on October 1, added less than 1% to $287.7 million.
The momentum is accelerating: revenue grew 34.6% year on year in the reported quarter versus 28.0% in the first quarter of fiscal 2027. In Data Centers the growth comes from higher sales to hyperscale customers in North America, and management cites record orders and backlog. Demand for data-center cooling is spilling into Commercial HVAC, where the company sees expanding opportunities.
For an investor, the key point is that growth is concentrated in the two segments that remain after the Performance Technologies spin-off. That means the raised fiscal 2027 outlook – revenue of $3.1–3.2 billion – applies to the core business, not to the departing unit.
Adjusted EBITDA grew 40.0% to $136.2 million, and the margin rose to 13.7% from 13.2%
Adjusted EBITDA for the reported quarter was $136.2 million against $103.8 million a year earlier, up 40.0%. The margin rose to 13.7% from 13.2%. Operating income grew 33% to $97.8 million, but gross margin fell 160 basis points to 20.7%: the company explicitly attributes this to higher material, component and tariff costs across all three segments.
In Data Centers gross margin fell 470 basis points to 19.7%, in Commercial HVAC it fell 140 basis points to 23.1%. Yet Data Centers operating income rose 70% to $61.2 million and its adjusted EBITDA rose 66% to $67.6 million: volume growth outweighs the pressure on unit margin. Commercial HVAC delivered operating income of $34.3 million, up 30%.
SG&A expenses rose 24% to $104.6 million, but fell as a share of sales. Part of the increase is spending to support Data Centers growth and to prepare the Performance Technologies spin-off. So the EBITDA margin is held up by scale, not by cost cuts: revenue is growing faster than fixed costs.
Net profit fell 32.4% to $30.0 million because of $29.5 million of tax expense on restructuring ahead of the Performance Technologies spin-off
Net profit attributable to shareholders was $30.0 million against $44.4 million a year earlier, down 32.4%. The report states the reason directly: as part of preparing the Reverse Morris Trust transaction with Gentherm, the company restructured legal entities, and the tax impact of those steps increased income tax expense by $29.5 million. Without that one-off charge, profit would have been above last year's level.
This shows up in adjusted EPS: $1.35 against $1.06 a year earlier, up 27%. Reported diluted EPS was $0.56 against $0.83. The gap between the two measures is that tax charge and the related costs, which are not part of operating activity.
Besides the tax, the quarter included $3.0 million of restructuring expenses and $14.1 million of spin-off costs. All of these are one-off items tied to splitting the company, not to running the business. For sustainable earnings it is right to look at adjusted figures, but they do not change the fact that reported net profit was lower this quarter than a year ago.
Adjusted EPS rose 27% to $1.35, so operationally the business earns more than a year ago
Adjusted EPS rose to $1.35 from $1.06, up 27%. This measure excludes restructuring expenses, spin-off costs, the tax impact of legal entity restructuring and other one-off items. It shows how much the business earns per share before the cost of splitting the company.
The diluted share count was almost unchanged – 53.9 million against 53.8 million a year earlier. So all of the EPS growth came from higher profit, not from a smaller share count. The company repurchased shares from employees to cover option-related tax obligations, but this has little effect on the diluted count.
For an investor, this is the main argument that the fall in reported profit is an accounting episode rather than a deterioration in the business. However, adjusted profit is not free of assumptions either: it does not include spin-off costs, which will continue in this and the next half-year.
Net debt is $0.6 billion at 1.24x LTM EBITDA – moderate leverage, but free cash flow for the half-year was negative
Net debt at September 30, 2026 was $0.6 billion. At June 30 it was $0.5 billion, at September 30, 2025 it was $0.6 billion, so the level has not changed over the year. Net debt to LTM EBITDA is 1.24. That is moderate leverage, leaving room to invest in expanding data-center capacity.
Cash flow, however, is weak. For the six months ended September 30, 2026, operating activities used $57.1 million, and free cash flow was negative at minus $145.6 million. The report gives the reason: higher capital expenditure to expand Data Centers production and higher working capital, primarily inventory, to support demand.
Inventories rose to $697.5 million from $506.1 million at March 31, 2026. This is the price of growth: the company is ramping production and building stock against its order book. The question is whether that stock turns into revenue and cash in the coming quarters, or sits on the balance sheet longer than management expects.
EV/EBITDA LTM of 15.1 is 35% below its own three-year average of 23.2, and on the portal's model the share trades 7% below fair value
On EV/EBITDA for the last twelve months the share trades at 15.1. Its own three-year average for this multiple is 23.2, so the current valuation is 35% below its history. This is the main argument that the market is not pricing in either the 34.6% revenue growth or the raised fiscal 2027 outlook.
P/E for the last twelve months is 51.1, which is high, but that figure is distorted by the one-off tax charge in the reported quarter: trailing profit includes $29.5 million of restructuring tax. On adjusted profit the picture is different, which is why EV/EBITDA is more informative here.
On the portal's model, which compares EBITDA growth with the target multiple and market capitalization, fair value is 7% above the current price. This is our own estimate, not a market consensus. It rests on the durability of EBITDA growth and on the multiple staying below its historical average.
The company raised its fiscal 2027 outlook: revenue of $3.1–3.2 billion and adjusted EBITDA of $470–500 million excluding Performance Technologies
The fiscal 2027 outlook was raised: revenue of $3.1–3.2 billion, adjusted EBITDA of $470–500 million. Both ranges apply to the continuing business, i.e. excluding Performance Technologies, which from the third quarter will be reported as a discontinued operation. That implies revenue growth of 50–55% year on year and EBITDA growth of more than 50%.
The outlook includes interest expense of $26–30 million, income tax of $95–105 million and depreciation and amortization of $56–61 million. In addition, in the second half of fiscal 2027 the company expects $20–25 million of additional costs on the Gentherm transaction – legal, accounting, tax and other services. These costs are excluded from adjusted EBITDA.
For an investor, the outlook matters because it confirms that growth in Data Centers and Commercial HVAC is not a one-off spike but a line the company is willing to build its plans on. The risk is that the outlook rests on a record order book, and its delivery depends on component supplies, for which the company has signed long-term agreements with strategic suppliers.
Valuation on the latest reported figures
| Metric | Value |
|---|---|
| Market cap | 6.63 bn USD |
| P/E (LTM) | 51.1 |
| EV/EBITDA (LTM) | 15.1 |
| P/B | 5.52 |
| Net debt / EBITDA (LTM) | 1.24 |
| ROE | 9.8% |
| EV/EBITDA, 3-year average | 23.2 |
Bottom line
The strong side of the report is revenue and EBITDA: $994.4 million and $136.2 million, up 34.6% and 40.0%, and that is before the departing Performance Technologies. The weak side is reported profit: $30.0 million against $44.4 million a year earlier, but the fall is fully explained by the $29.5 million restructuring tax, while adjusted EPS rose 27%. Leverage is moderate at 1.24x LTM EBITDA, but free cash flow for the half-year was negative, and that is the main question about the quality of growth. At an EV/EBITDA of 15.1 the share is 35% below its own three-year average of 23.2, and the portal's model implies 7% upside, so the verdict is rather attractive.
Open the company's financial profile MOD →
See also: market overview · valuation map · stock screeners