Merck & Co., Inc.: revenue up 4.7% but profit down 12.4% – margin compressed to 28.0%

On 29 October Merck & Co., Inc. reported third-quarter 2026 results. Revenue came in at USD 18,085.0 million, up 4.7% year on year, while net profit was USD 5,065.0 million, down 12.4% from a year earlier. The net margin fell to 28.0% from 33.5% a year ago. At the same time the stock trades above its own history on EV/EBITDA (15.4 versus a three-year average of 11.2), and the portal's model puts upside to fair value at +6%. With margin compression and a premium valuation, the share looks neutral.
Key takeaways
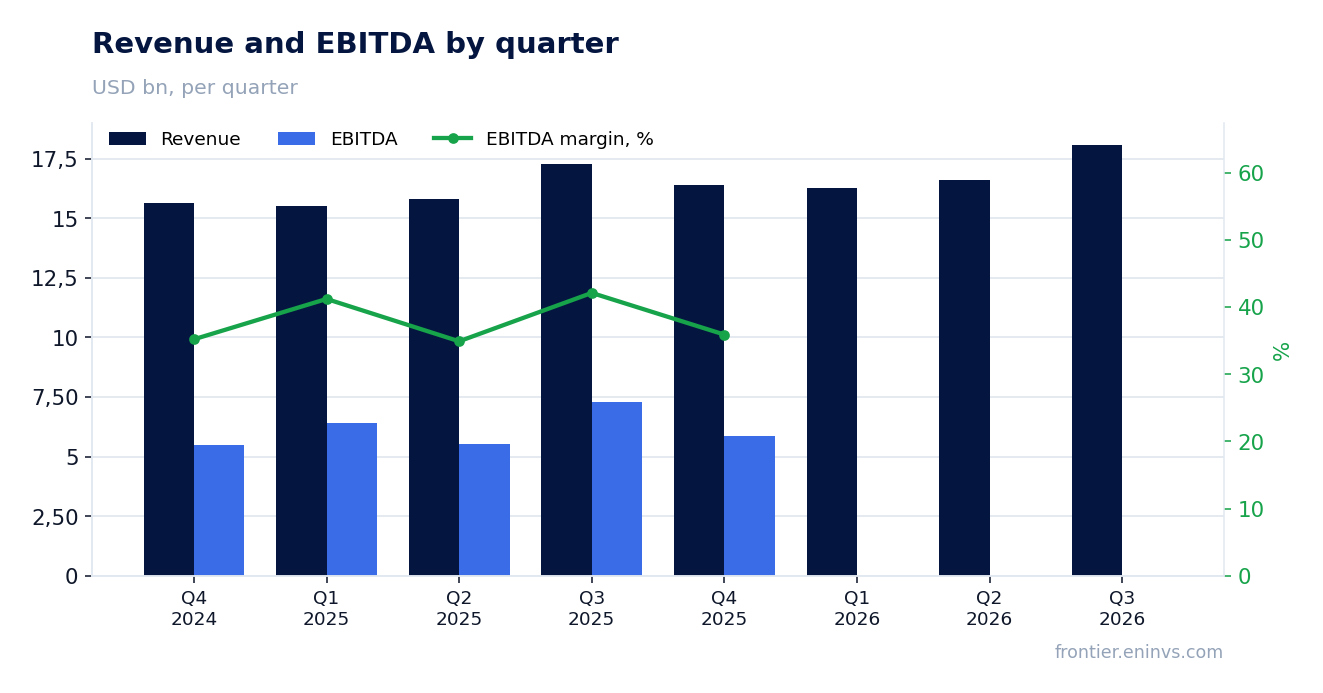
— Revenue grew 4.7% year on year, but the pace slowed from 5.1% in the prior quarter
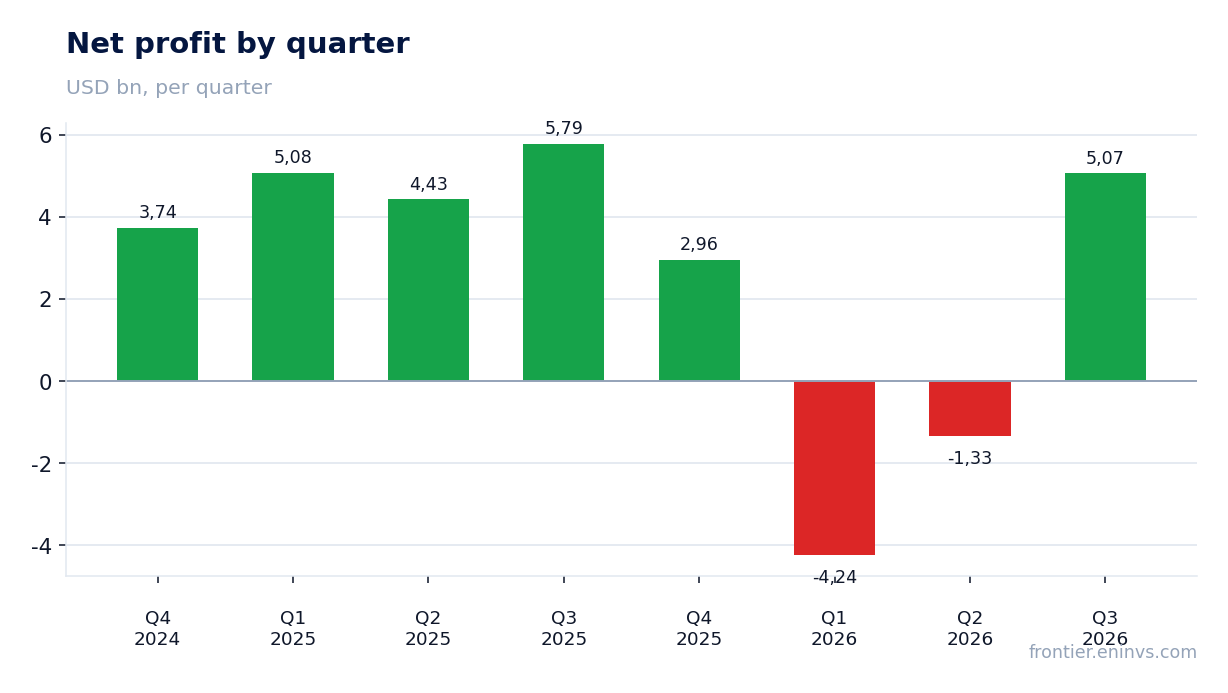
— Net profit fell 12.4%, and the margin compressed to 28.0% from 33.5%
— Over the trailing twelve months net profit was only USD 2,453.0 million on revenue of USD 67,400.0 million
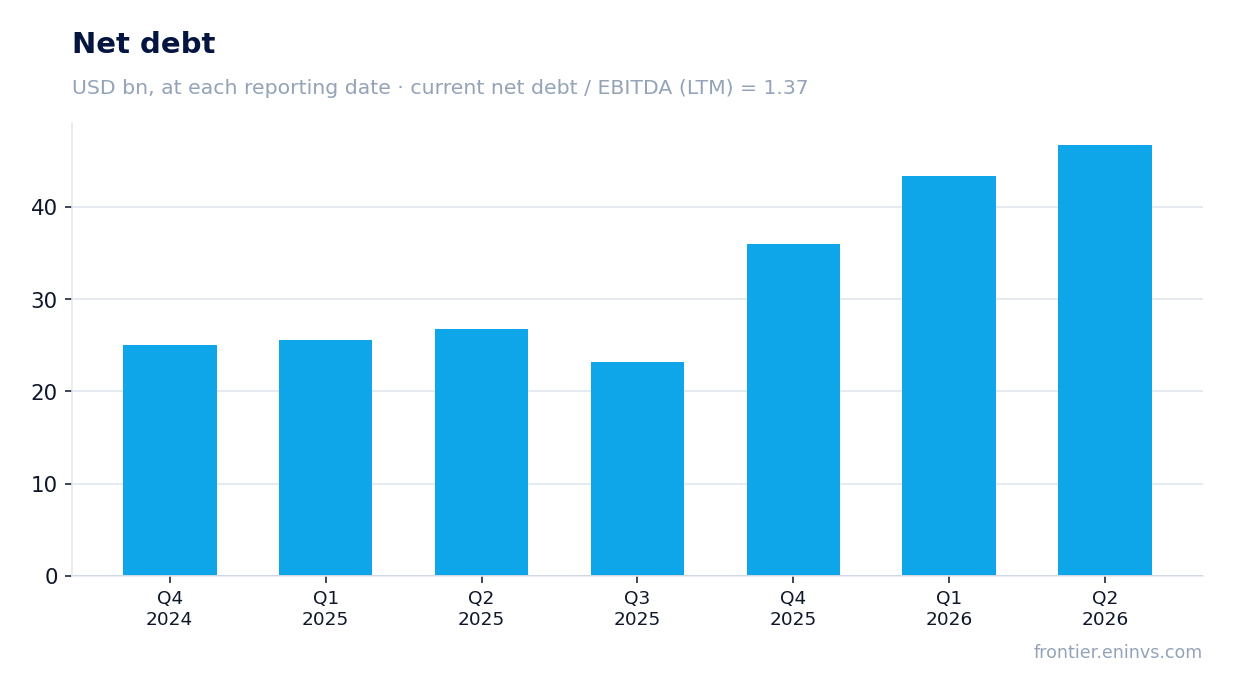
— Net debt to EBITDA LTM stands at 1.37 – a moderate level
— Trailing twelve-month dividend yield is 2.32%, below the key rate
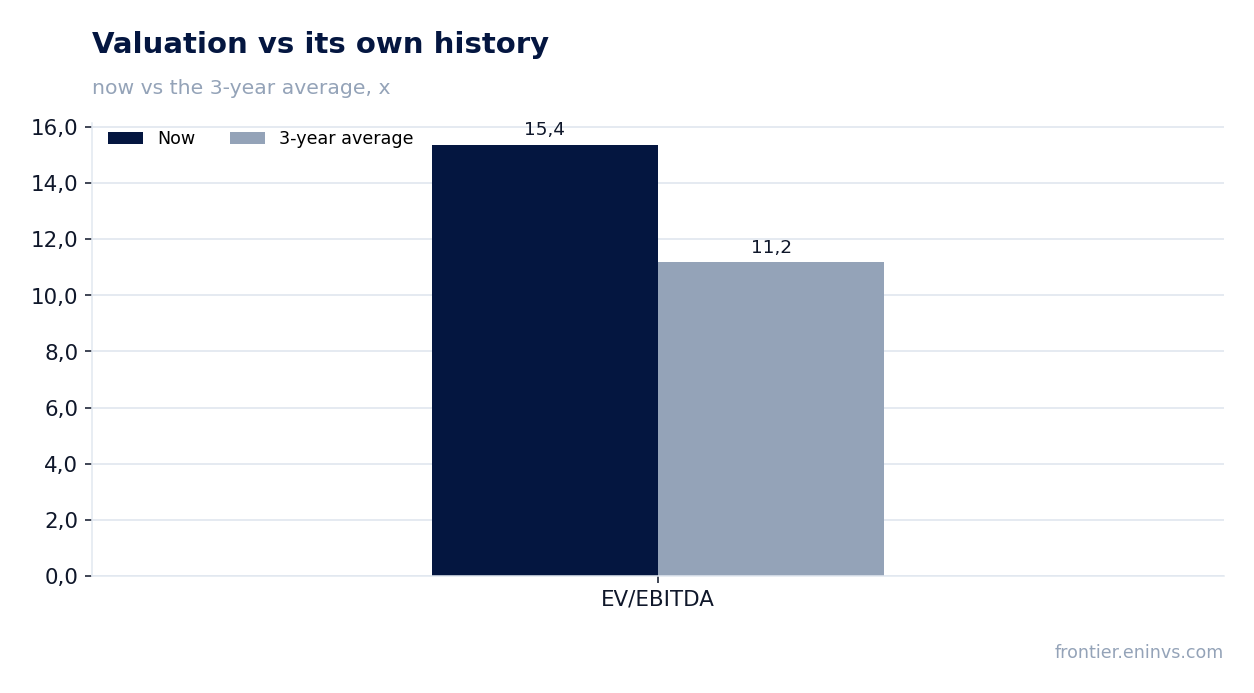
— EV/EBITDA LTM of 15.4 is 37% above its own three-year average of 11.2
— The portal's model puts upside to fair value at +6%
Attractiveness
Key figures, USD bn
| Metric | Q3 2025 | Q3 2026 | Change |
|---|---|---|---|
| Revenue | 17.3 | 18.1 | +4.7% |
| EBITDA | 7.28 | — | — |
| Operating profit | 6.75 | — | — |
| Net profit | 5.79 | 5.07 | -12.4% |
| Operating cash flow | 7.82 | — | — |
| Capex | 0.99 | — | — |
| EBITDA margin | 42.1% | — | — |
| Net margin | 33.5% | 28.0% | -5.5 pp |
Revenue grew 4.7% year on year, but the pace slowed from 5.1% in the prior quarter
In the third quarter of 2026 Merck & Co., Inc. revenue reached USD 18,085.0 million, up 4.7% year on year. In the prior quarter growth was 5.1%, so the pace was roughly the same, though formally slower.
The top line is supported by steady demand for the product portfolio, but without segment detail in the facts the specific driver cannot be named. Revenue growth remains positive, but its contribution to profit was offset by other factors.
Net profit fell 12.4%, and the margin compressed to 28.0% from 33.5%
Net profit for the third quarter of 2026 was USD 5,065.0 million, down 12.4% from a year earlier. The net margin fell to 28.0% from 33.5% a year ago.
Margin compression alongside revenue growth means costs or one-off items rose faster than sales. The facts do not break down cost lines, so the specific cause cannot be named – only the fact that profit did not follow revenue.
Over the trailing twelve months net profit was only USD 2,453.0 million on revenue of USD 67,400.0 million
Over the trailing twelve months Merck & Co., Inc. revenue totalled USD 67,400.0 million, while net profit was only USD 2,453.0 million. The low result is explained by losses in the first and second quarters of 2026: minus USD 4,240.0 million and minus USD 1,335.0 million respectively.
The annual profit is therefore heavily distorted by the weak first two quarters, and the third-quarter recovery has not yet offset those losses. For assessing business resilience, the latest quarter's dynamics matter more, showing a return to profit.
Net debt to EBITDA LTM stands at 1.37 – a moderate level
Net debt at the latest balance-sheet date was USD 35,969.0 million, and the net debt to EBITDA LTM ratio was 1.37. This is a moderate level that does not create acute pressure on finances.
Operating cash flow for the third quarter of 2026 is not disclosed in the facts, so its dynamics cannot be judged. In the prior quarters of 2026 the flow was positive: USD 3,918.0 million in the first and USD 5,370.0 million in the second.
Trailing twelve-month dividend yield is 2.32%, below the key rate
Merck & Co., Inc. trailing twelve-month dividend yield is 2.32%. This is a modest level that does not compensate for the risk of holding the stock at the current valuation.
Payouts are supported by cash flow, but with LTM net profit of only USD 2,453.0 million the payout ratio may be high. If profit remains under pressure, the dividend could be revised downward.
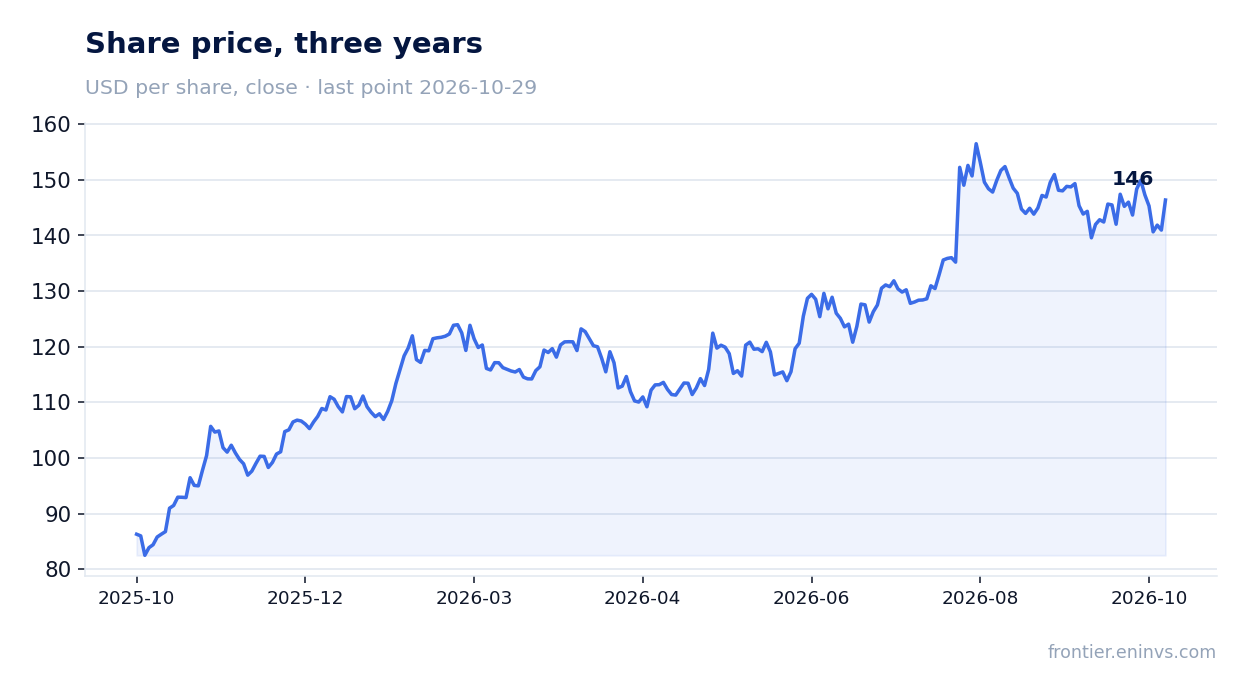
EV/EBITDA LTM of 15.4 is 37% above its own three-year average of 11.2
The EV/EBITDA LTM multiple stands at 15.4 versus its own three-year average of 11.2, i.e. 37% higher. On this measure the stock is more expensive than usual over the past three years.
P/E LTM reaches 149.6, reflecting the low profit base over the trailing twelve months. Such a valuation requires confidence in a profit recovery that is not yet fully in place.
The portal's model puts upside to fair value at +6%
According to the portal's model, the fair value of Merck & Co., Inc. shares implies +6% upside from the current price. This is a moderate benchmark that does not suggest a significant advantage for the buyer.
Given the premium to its own history on EV/EBITDA and margin compression, the 6% upside looks modest. A turnaround in profit dynamics is needed for more confident growth.
Valuation on the latest reported figures
| Metric | Value |
|---|---|
| Market cap | 367 bn USD |
| P/E (LTM) | 149.6 |
| EV/EBITDA (LTM) | 15.4 |
| P/B | 6.97 |
| Net debt / EBITDA (LTM) | 1.37 |
| ROE | -12.2% |
| Dividend yield (12m) | 2.3% |
| EV/EBITDA, 3-year average | 11.2 |
Bottom line
The report's strengths remain revenue growth of 4.7% and a return to profit in the third quarter. However, LTM net profit of USD 2,453.0 million is distorted by losses in the first two quarters, and the margin compressed to 28.0%. Leverage is moderate at 1.37 net debt to EBITDA, but the EV/EBITDA valuation is 37% above its own history. The verdict is neutral: the portal's model shows only +6% upside, and a 2.32% dividend yield offers no edge.
Open the company's financial profile MRK →
See also: market overview · valuation map · stock screeners