MICROSOFT CORP: profit up by a third, but the gap came from OpenAI investments, not the business
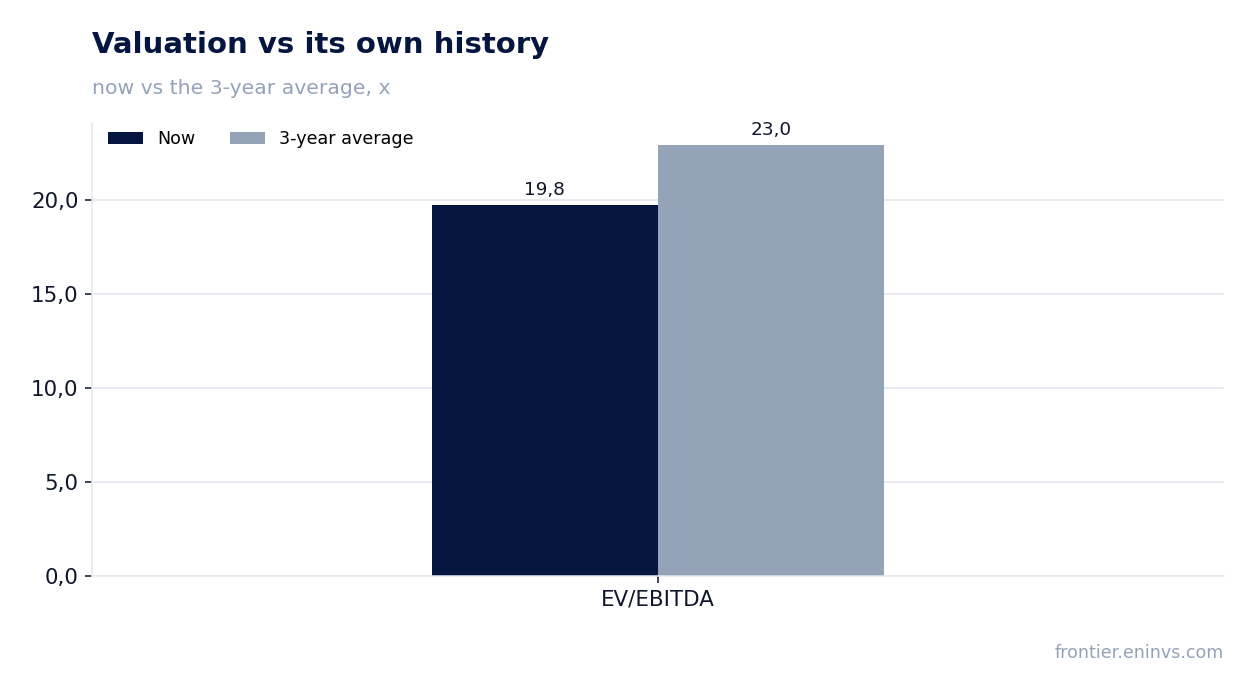
On 28 October MICROSOFT CORP reported results for the quarter ended 30 September 2026. Revenue was $92.3bn (+18.8% YoY), operating income $45.9bn (+21%), net income $36.6bn (+32%). Half of that last jump is a base effect: a year earlier OpenAI losses cut net income by $3.1bn, now the same investments added $0.2bn, and without it net income would have grown 18%. The stock trades below its own history on EV/EBITDA (19.8 vs 23.0) and the portal's model puts upside at +15%, so at the current price it looks rather attractive.
Key takeaways
— Revenue accelerated to +18.8% in fiscal Q1 2027 from +17.7% a quarter earlier
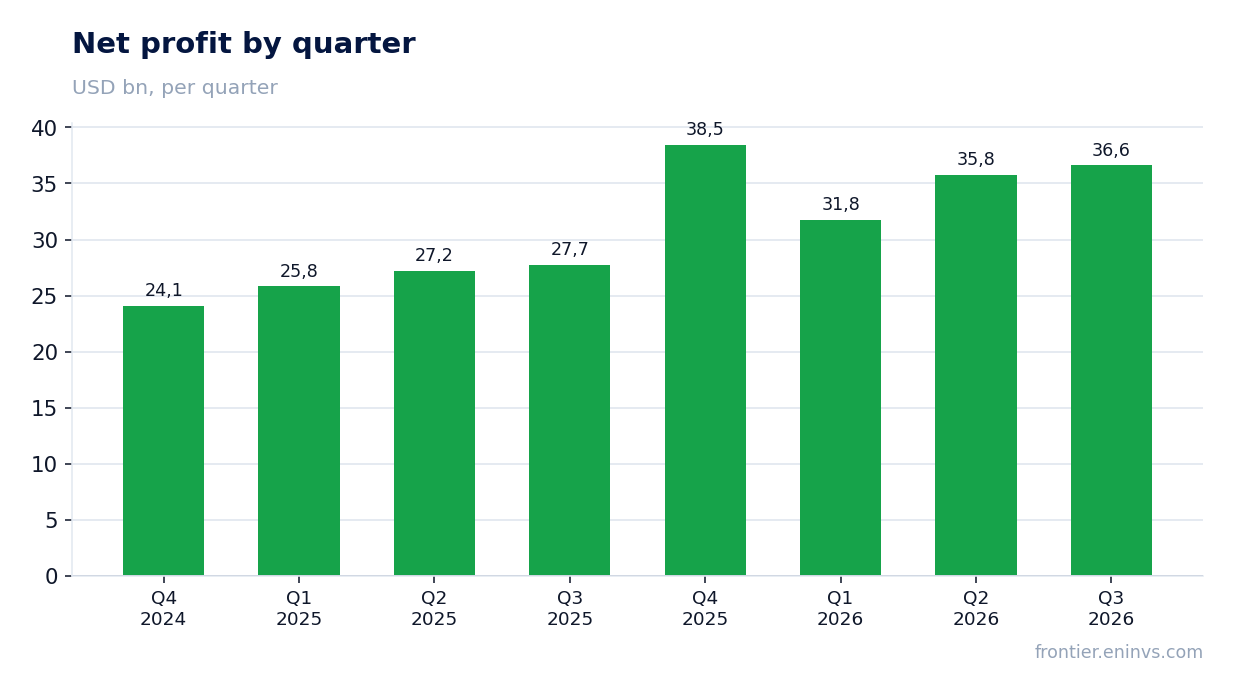
— The 32% profit gain is half made by the OpenAI swing, not by operating leverage
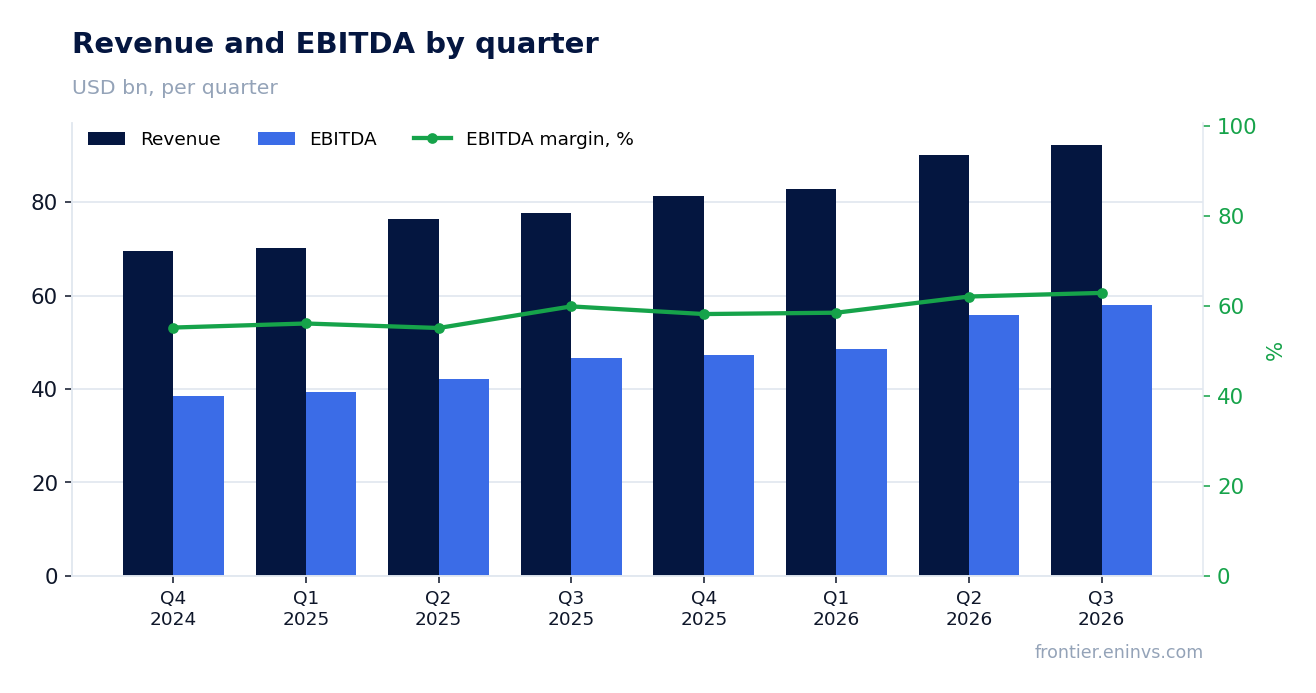
— EBITDA margin rose to 62.9% as service revenue outgrew product revenue
— Capex doubled to $39.4bn and almost swallowed operating cash flow
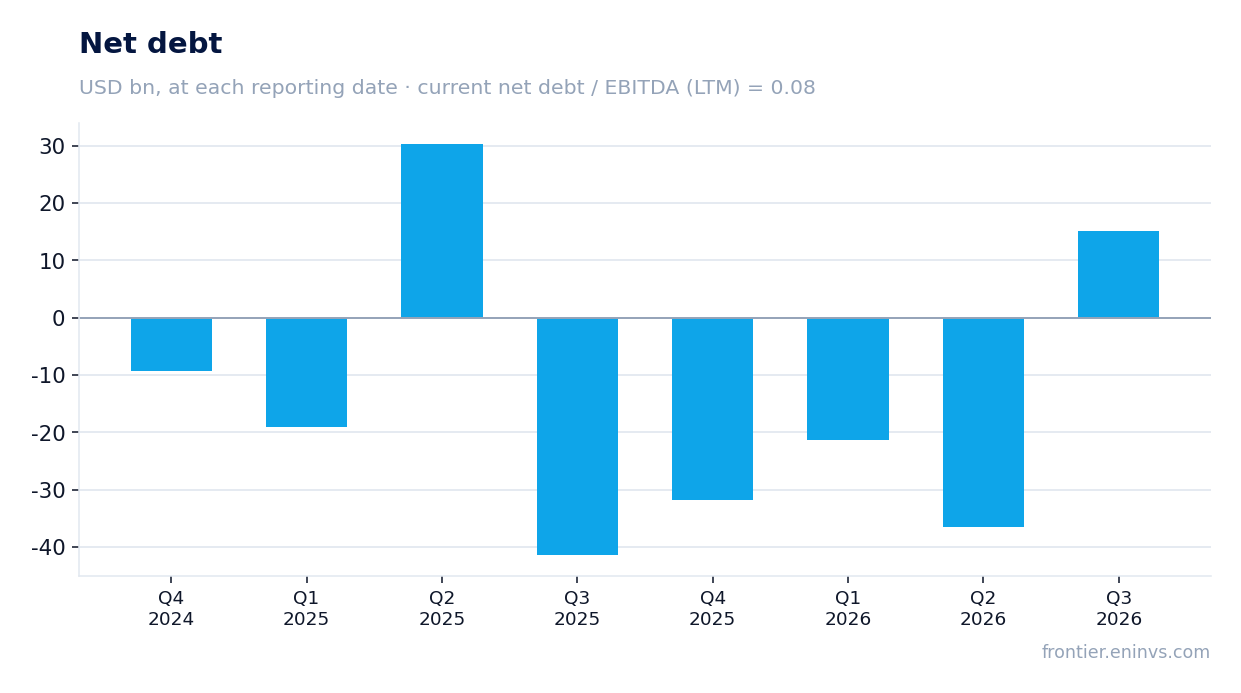
— Net debt is $15.2bn, just 0.08x LTM EBITDA
— The 0.69% dividend yield does not catch the key rate, and the payout leans on buybacks
— EV/EBITDA of 19.8 is 14% below its own three-year average of 23.0
Attractiveness
Key figures, USD bn
| Metric | Q3 2025 | Q3 2026 | Change |
|---|---|---|---|
| Revenue | 77.7 | 92.3 | +18.8% |
| EBITDA | 46.6 | 58.0 | +24.6% |
| Operating profit | 38.0 | 45.9 | +21.0% |
| Net profit | 27.7 | 36.6 | +32.0% |
| Operating cash flow | 45.1 | 58.0 | +28.7% |
| Capex | 19.4 | 39.4 | +103.0% |
| EBITDA margin | 59.9% | 62.9% | +3.0 pp |
| Net margin | 35.7% | 39.7% | +4.0 pp |
Revenue accelerated to +18.8% in fiscal Q1 2027 from +17.7% a quarter earlier
Revenue for the quarter ended 30 September 2026 was $92.3bn, up 18.8% year on year. The prior quarter grew 17.7%, so the pace accelerated. In constant currency the gain is almost the same at 19%, so FX is not the story.
Cloud carries the top line: Microsoft Cloud brought in $63.9bn, up 30%, and Azure $33.2bn, up 48%. Commercial remaining performance obligation rose 73% to $677bn – contracted future revenue, and its size says infrastructure demand is not fading.
The second segment, Devices and Consumer, shrank 3% to $15.5bn. Windows OEM and devices fell 22%, Xbox 2%, and only search and advertising grew 12%. The gap between the two halves of the business widened: infrastructure and AI grow three times faster than consumer hardware.
The 32% profit gain is half made by the OpenAI swing, not by operating leverage
Net income for the quarter was $36.6bn against $27.7bn a year earlier, up 32%. But the release says plainly: a year ago OpenAI investment losses cut profit by $3.1bn, and this quarter the same investments added $0.2bn. Without that effect profit would have grown 18% – exactly in line with revenue.
Operating income rose 21% to $45.9bn, and that line is already clean of investment swings. The gap between 21% and 18.8% revenue growth is the operating leverage: R&D added 11%, sales and marketing stayed flat, and G&A grew 4%.
The company itself shows the GAAP/non-GAAP gap: diluted EPS of $4.92 GAAP against $4.89 non-GAAP, versus $3.72 against $4.13 a year earlier. Last year adjusted profit was above reported, this year it almost matches. For an investor looking at sustainable earnings, 18% is the relevant number, not 32%.
EBITDA margin rose to 62.9% as service revenue outgrew product revenue
EBITDA for the quarter was $58.0bn, a 62.9% margin against 59.9% a year earlier. Profit grew faster than revenue, and it is not only scale: service revenue added 26% to $77.6bn while product revenue fell 8% to $14.6bn. Services carry a higher margin, and their share of revenue is rising.
Cost of revenue rose 24% to $29.7bn, faster than revenue. Gross margin still rose – from $53.6bn to $62.6bn – because service growth outweighed infrastructure costs. Operating expenses grew only 6% to $16.6bn, and that is the main source of the margin improvement.
Net margin was 39.7% against 35.7% a year earlier, but again remember OpenAI: without the investment effect it would be closer to 39%. EBITDA margin is the cleaner indicator because it excludes investment results entirely.
Capex doubled to $39.4bn and almost swallowed operating cash flow
Operating cash flow for the quarter was $58.0bn against $45.1bn a year earlier. Capex rose to $39.4bn from $19.4bn – more than double. Free cash flow, the difference between the two, narrowed to $18.6bn from $25.7bn a year earlier.
The capex surge is the price of AI infrastructure: the release shows net property and equipment rising to $346.8bn from $313.1bn at end-June. The company is building data centres faster than they pay back, a deliberate choice in favour of future revenue.
For the shareholder this means dividends and buybacks are funded not only by cash flow but by the balance sheet. The quarter saw $6.8bn on dividends and $4.4bn on buybacks, $10.2bn of total returns. Against $18.6bn of free cash flow that is covered, but the cushion is thinner than a year ago.
Net debt is $15.2bn, just 0.08x LTM EBITDA
Net debt at 30 September 2026 was $15.2bn, or 0.08x LTM EBITDA. That is a level at which debt is not a risk factor: LTM EBITDA of $202.0bn covers it many times over.
The trajectory matters more than the level. At 30 June net debt was minus $36.5bn, i.e. a net cash position, and by 30 September it was plus $15.2bn – a change of $51.7bn in one quarter. A year earlier, at 30 September 2025, it was minus $41.5bn, a 12-month change of $56.7bn. The cause is the capex and shareholder returns that together exceeded operating cash flow.
Total debt is small: $4.4bn current and $31.1bn long-term. The company repaid $4.9bn of debt in the quarter. Even with capex rising further the balance sheet holds: $64.5bn of cash and short-term investments plus cash flow cover the obligations.
The 0.69% dividend yield does not catch the key rate, and the payout leans on buybacks
Trailing 12-month dividend yield was 0.69%. The quarter saw $6.8bn paid in dividends – the regular payout, up from $6.2bn a year earlier. The company pays consistently and raises the payout, but the yield stays low relative to the share price.
Our estimate for the current year's dividend is growth within 8–10% of the prior level, and it rests on two things: profit growing at a double-digit pace and a payout ratio below a quarter of earnings. If capex keeps rising and free cash flow keeps narrowing, the company may prefer to put money into infrastructure rather than the dividend.
A 0.69% yield loses to the key rate, and for an investor buying the stock for income that is a weak argument. The main return here comes through buybacks – $4.4bn in the quarter – and through capital appreciation. The dividend in this story is a nice extra, not a reason to buy.
EV/EBITDA of 19.8 is 14% below its own three-year average of 23.0
On trailing 12 months EV/EBITDA is 19.8 against its own three-year average of 23.0. The stock trades 14% cheaper than it usually has over the past three years. P/E LTM is 27.7, which against 18% sustainable profit growth looks moderate.
The portal's model puts fair value at +15% to the current price. That is our own estimate, built on EBITDA growth and a target multiple, not a market consensus. It rests on profit growth continuing and the multiple returning at least partly to its historical level.
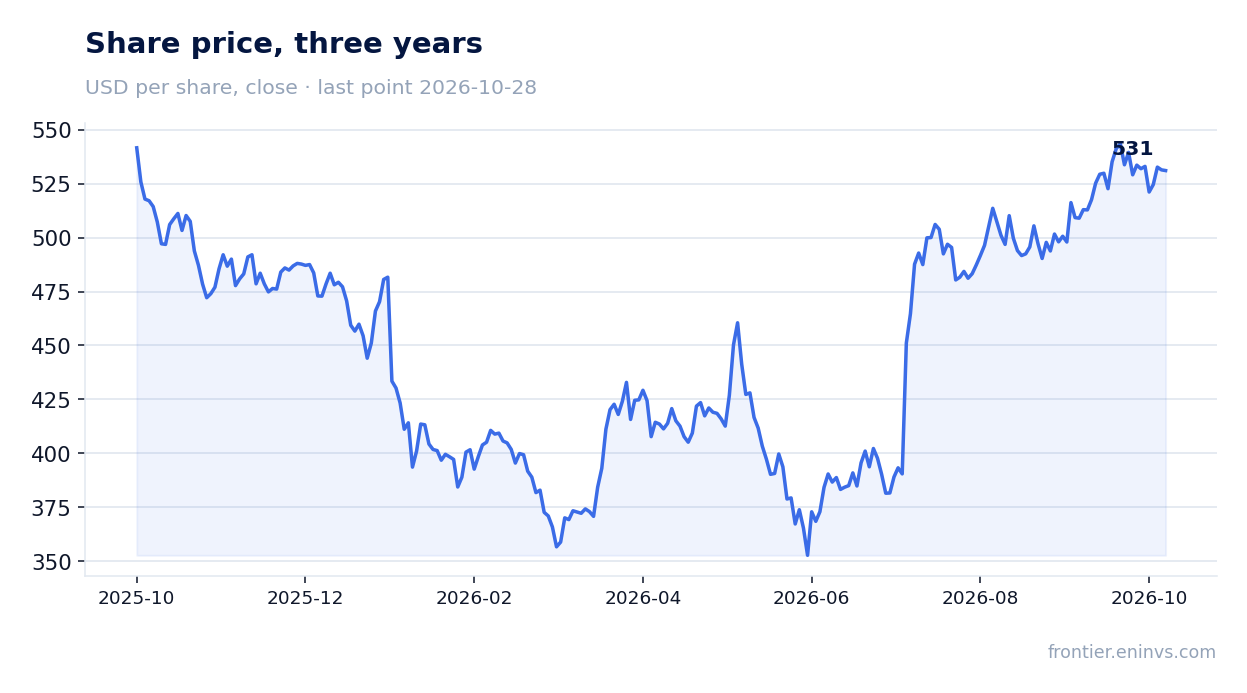
The market reaction was muted: the share lost 0.1% on the release day and 0.1% from the release to 28 October. The market had already priced in a strong quarter, and a re-rating needs the next report to confirm that capex is starting to pay off.
Valuation on the latest reported figures
| Metric | Value |
|---|---|
| Market cap | 3 958 bn USD |
| P/E (LTM) | 27.7 |
| EV/EBITDA (LTM) | 19.8 |
| P/B | 8.95 |
| Net debt / EBITDA (LTM) | 0.08 |
| Operating cash flow (LTM) | 196 bn |
| ROE | 32.1% |
| Dividend yield (12m) | 0.7% |
| EV/EBITDA, 3-year average | 23.0 |
Bottom line
A strong quarter on revenue and operating income: growth accelerated to 18.8%, EBITDA margin rose to 62.9%, and Azure grew 48%. But the headline 32% net income gain is half made by the OpenAI swing, and the sustainable pace is 18%. Capex doubled and almost swallowed cash flow, and net debt went from negative to positive at $15.2bn. Yet the multiple of 19.8 is below its own three-year average of 23.0, and the portal's model gives +15%. The stock looks rather attractive at the current price, but the verdict rests on capex starting to pay back, not on the one-off investment effect.
Open the company's financial profile MSFT →
See also: market overview · valuation map · stock screeners