Matador Resources: revenue up 39.7%, but profit was held back by a gas-price reversal, not by growth
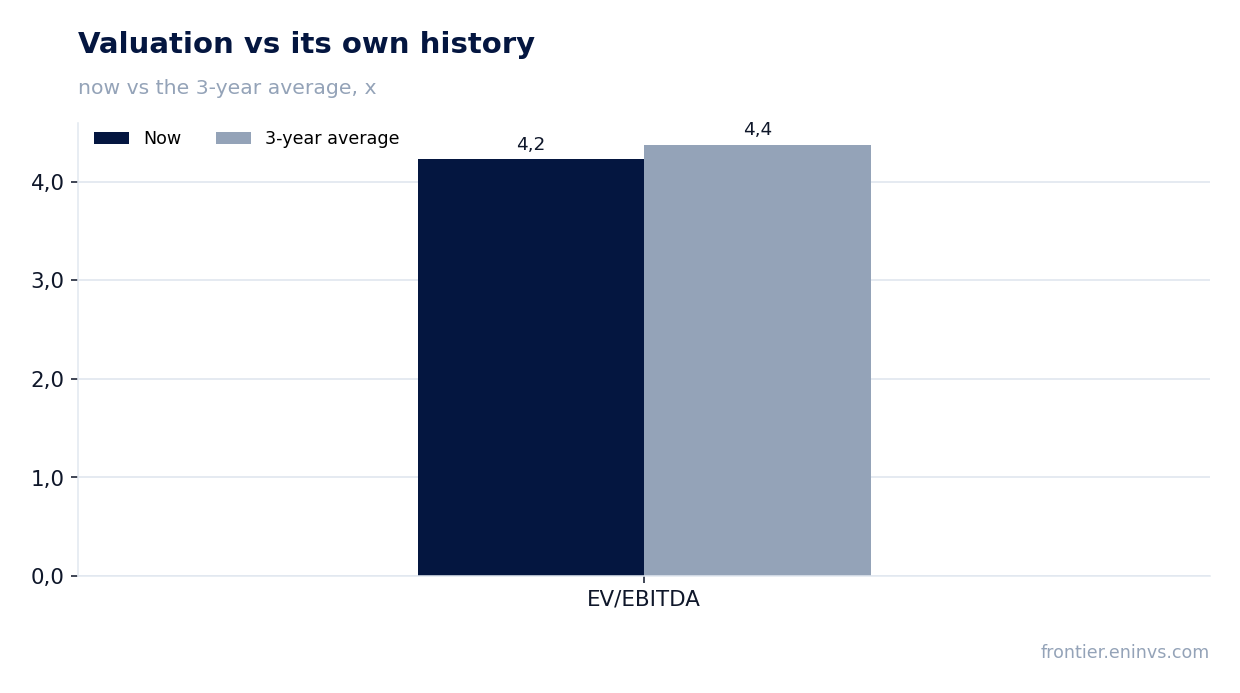
On 3 November Matador Resources Company released its third-quarter 2026 results. Revenue came in at $1,278.4 million, EBITDA at $738.3 million and net profit at $172.1 million. Year on year revenue rose 39.7%, an acceleration from 26.8% in the second quarter, but EBITDA added only 25.7% and profit fell 2.4%: the EBITDA margin narrowed to 57.8% from 64.2%, and the realised loss on derivatives reached $160.2 million. With EV/EBITDA at 4.2 – in line with its own three-year average of 4.4 – and a dividend yield of 2.8%, the share looks neutral: volume and debt growth are already priced in, and the portal's model implies 38% downside to fair value.
Key takeaways
— Revenue rose 39.7% year on year, and almost all of the gain came from volumes and gas prices, not oil
— The EBITDA margin narrowed to 57.8% from 64.2% because derivatives took $160.2 million out of revenue
— Net profit fell 2.4%, even though adjusted profit rose to $257.5 million
— Operating cash flow of $594.4 million covered capital expenditure of $381.4 million, leaving free cash flow of $287.6 million
— Debt rose to $3,837.8 million, and net debt to LTM EBITDA stands at 1.54 – a level, with no direction implied
— The dividend was raised to $1.75 per share a year, but the 2.8% yield is thinner than the risk-free rate
— EV/EBITDA of 4.2 is in line with its own three-year average of 4.4, and the portal's model implies 38% downside to fair value
Attractiveness
Key figures, USD bn
| Metric | Q3 2025 | Q3 2026 | Change |
|---|---|---|---|
| Revenue | 0.92 | 1.28 | +39.7% |
| EBITDA | 0.59 | 0.74 | +25.7% |
| Operating profit | 0.28 | — | — |
| Net profit | 0.18 | 0.17 | -2.4% |
| Operating cash flow | 0.72 | 0.59 | -17.6% |
| Capex | 0.64 | 0.38 | -40.7% |
| EBITDA margin | 64.2% | 57.8% | -6.4 pp |
| Net margin | 19.3% | 13.5% | -5.8 pp |
Revenue rose 39.7% year on year, and almost all of the gain came from volumes and gas prices, not oil
Third-quarter revenue came to $1,278.4 million against $915.1 million a year earlier, up 39.7%. That is an acceleration from 26.8% in the second quarter, and the structure shows why: production rose 10% to 230,470 barrels of oil equivalent per day, and realised gas prices climbed to $2.99 per thousand cubic feet from $1.95 a year earlier.
Oil revenue grew more modestly: the realised oil price added 34% to $87.25 a barrel, but including derivatives it was only $74.84. The gas segment brought in $162 million against negative $39 million in the second quarter – the reversal came from a 10% rise in gas production and the commissioning of the Hugh Brinson pipeline on 1 September 2026.
For a holder, the key point is that the revenue acceleration rests on quarter-specific factors: the pipeline start-up and the recovery of gas prices from negative levels. Whether this holds will be shown by the fourth quarter, when the company expects production of 238,000–242,000 barrels of oil equivalent per day.
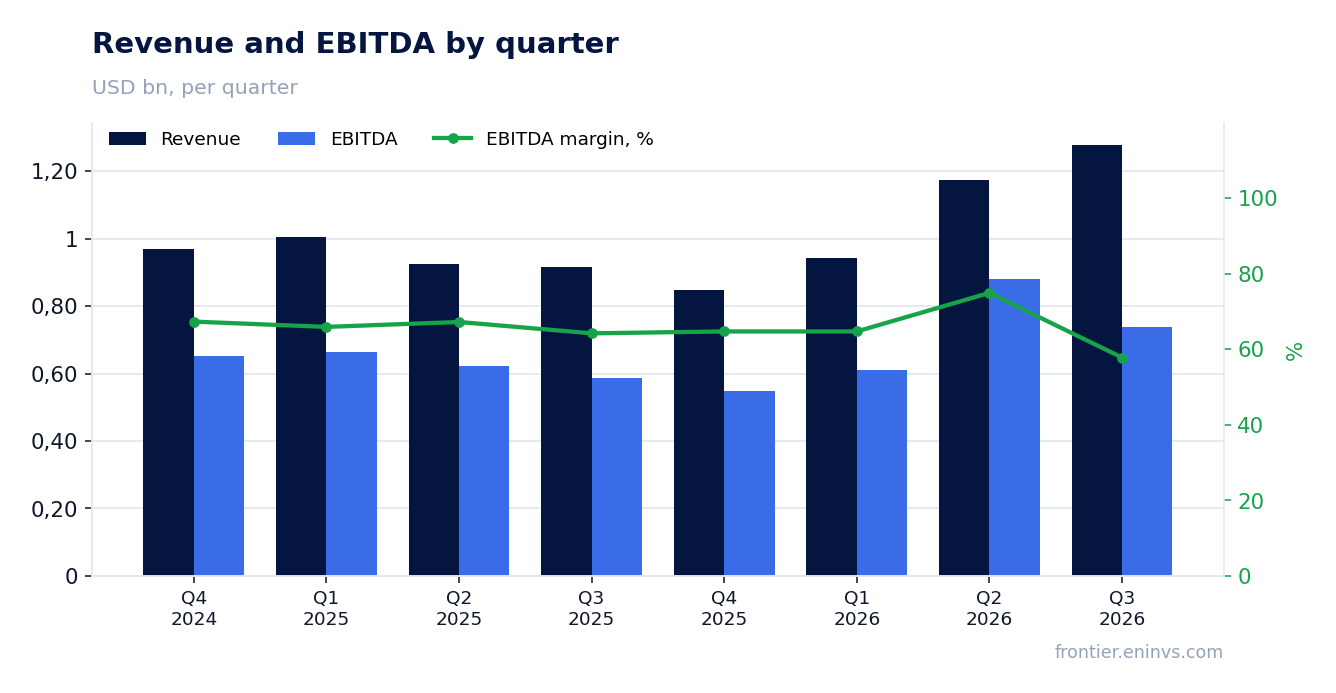
The EBITDA margin narrowed to 57.8% from 64.2% because derivatives took $160.2 million out of revenue
EBITDA rose 25.7% to $738.3 million, but the margin fell to 57.8% from 64.2% a year earlier. The gap is explained by a realised loss on derivatives of $160.2 million: a year earlier that line showed a small gain of $3.9 million. Without it, revenue would have been noticeably higher and the margin closer to last year's.
Operating expenses per barrel rose to $33.67 from $30.31. The main contributor was midstream operating expense of $3.89 per barrel against $2.56, tied to the Cardinal Midstream acquisition and one-off costs in the quarter. Lease operating expense, by contrast, beat expectations at $5.66 per barrel.
The margin compression alongside revenue growth is the main signal in the report: the company is selling more, but each dollar of revenue brings less operating profit. For durability, it matters that part of the pressure is derivatives, whose effect depends on prices, and part is the rise in midstream costs after the deal.
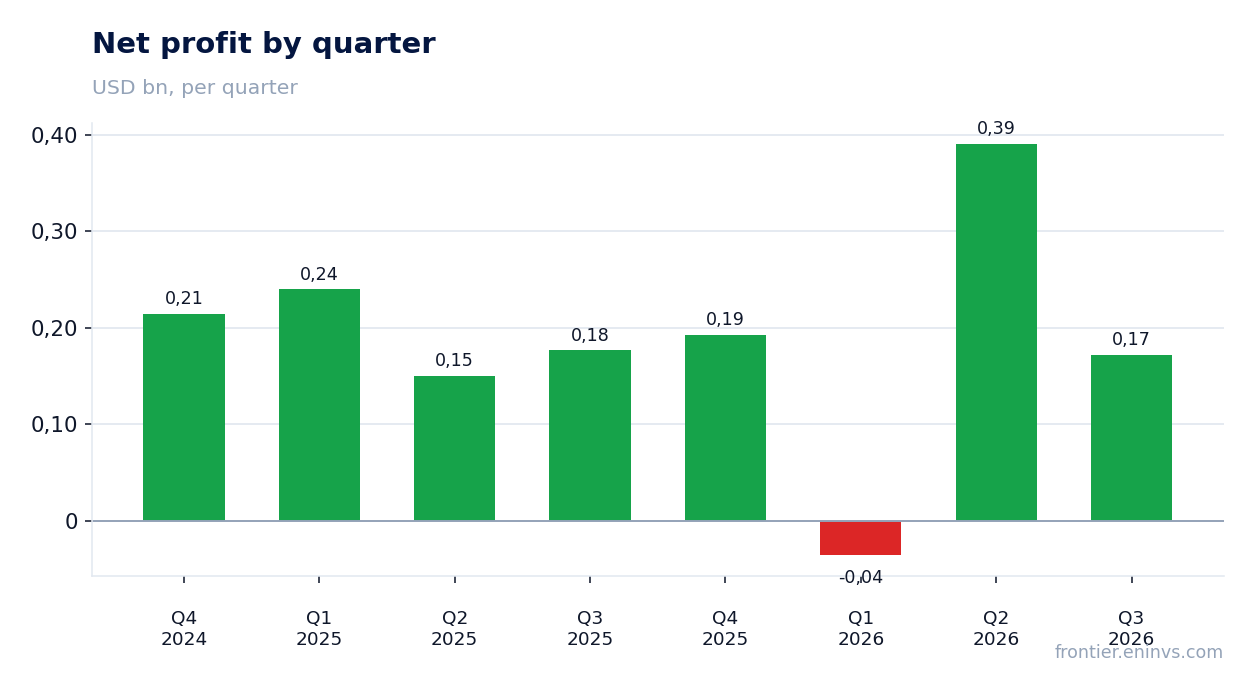
Net profit fell 2.4%, even though adjusted profit rose to $257.5 million
Net profit came to $172.1 million against $176.4 million a year earlier, down 2.4%. The net margin narrowed to 13.5% from 19.3%. The gap between weak reported and strong adjusted profit – $257.5 million – sits in an unrealised loss on derivatives of $67.7 million and in interest expense rising to $80.0 million from $50.6 million.
Adjusted earnings per share were $2.08 against $1.36 a year earlier. That means the company earned more operationally, while reported profit was held back by paper revaluations of derivatives and by servicing a larger debt load.
For a holder this distinction matters: reported earnings per share of $1.39 look weak, but they do not reflect the cash-generating capacity of the business. The adjusted profit and cash flow are the better guide, not the reported line.
Operating cash flow of $594.4 million covered capital expenditure of $381.4 million, leaving free cash flow of $287.6 million
Operating cash flow for the quarter was $594.4 million, capital expenditure $381.4 million. Free cash flow reached $287.6 million, and that is the main argument for the company's ability to fund debt and dividends from its own resources.
Capital expenditure came in below the $410–440 million guide: the company spent $381.4 million, of which $329.9 million on drilling and $51.5 million on midstream. Some spending shifted into the fourth quarter, where $425–485 million is expected, so the full-year guide of $1.67–1.73 billion stands.
Free cash flow of $287.6 million is what remains after investment and what funds dividends and debt repayment. In October the company repaid $150 million of debt ahead of schedule, more than it had previously announced.
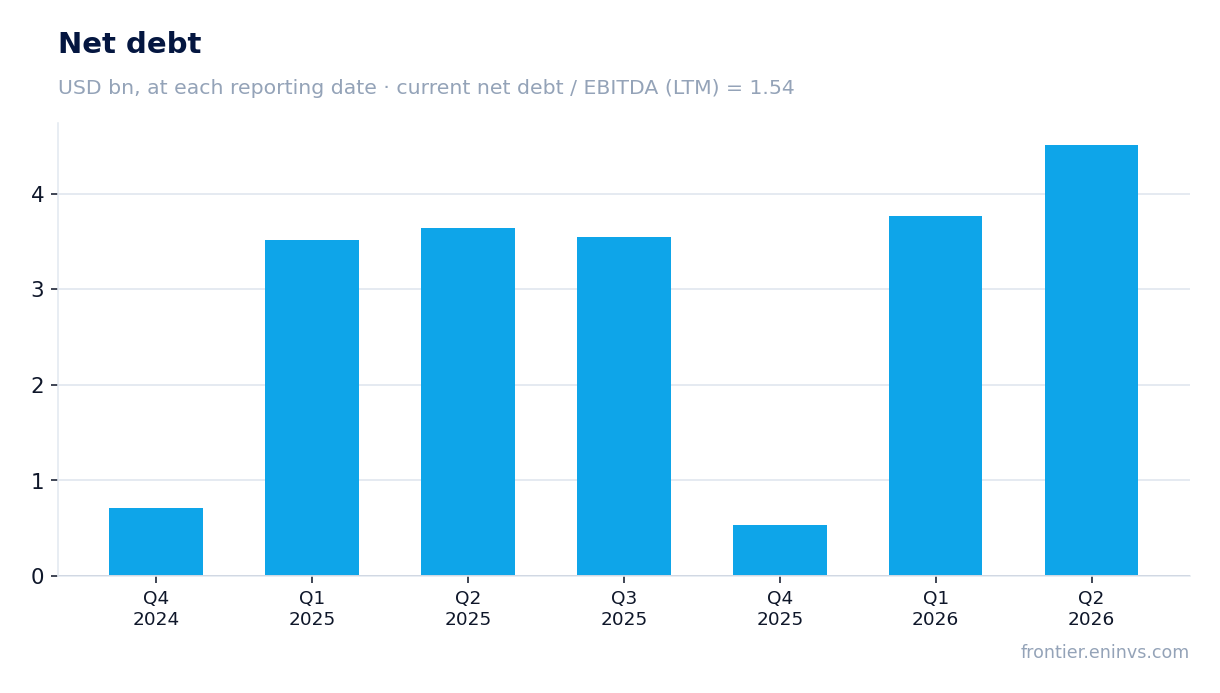
Debt rose to $3,837.8 million, and net debt to LTM EBITDA stands at 1.54 – a level, with no direction implied
Net debt on the latest annual balance sheet was $3,837.8 million. Net debt to LTM EBITDA stands at 1.54. That is a moderate level for the industry, but it rose along with acquisitions: in 2026 the company closed the Cardinal Midstream, Paloma and Ridge Runner deals.
Interest expense rose to $80.0 million from $50.6 million a year earlier, reflecting both higher debt and higher rates. The company said it expects the ratio to approach 1.5 by the end of 2026, and it has already repaid $150 million in October.
For a holder it matters that debt is serviced from free cash flow rather than new borrowing. But the rise in debt means part of future cash flow is already committed, which limits room for additional payouts.
The dividend was raised to $1.75 per share a year, but the 2.8% yield is thinner than the risk-free rate
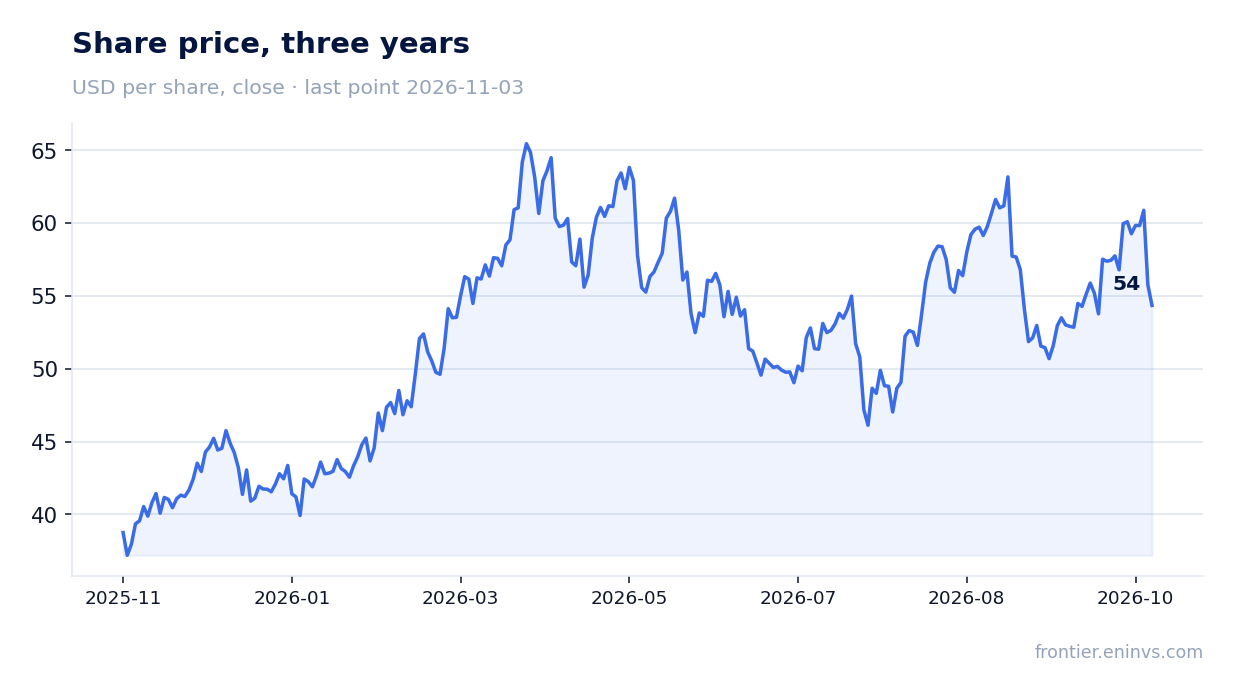
The company announced its eighth dividend increase in five years: the annual dividend rose to $1.75 per share from $1.50, up 17%. At a share price of $55.76, the trailing twelve-month dividend yield is 2.8%.
Our estimate for the 2026 dividend is about $1.75 per share, matching the announced annual level. The payout rests on free cash flow of $287.6 million for the quarter and on adjusted profit, not on reported profit, which was held back by paper derivative losses.
A 2.8% yield is thinner than the risk-free rate, which limits the appeal of the share as a dividend story. The payout could be cut by a fall in oil and gas prices or by a rise in capital expenditure if the company accelerates development of acquired assets.
EV/EBITDA of 4.2 is in line with its own three-year average of 4.4, and the portal's model implies 38% downside to fair value
The LTM EV/EBITDA multiple is 4.2 against its own three-year average of 4.4 – the share is valued in line with its history, with neither a discount nor a premium. The LTM P/E is 9.3, which looks inexpensive against a 27.1% return on equity, but that return rests on the quarter's high realisations.
The portal's model, which reprices EBITDA at current commodity prices at the target EV/EBITDA, implies 38% downside to fair value. That is our own estimate, not a market consensus, and it reflects the risk that current oil and gas prices will not hold at third-quarter levels.
The market reaction was muted: the share lost 2.5% on the publication day and another 2.5% from the release to 3 November. With a neutral multiple and a thin dividend yield, the share needs either stronger commodity prices or further debt reduction to become attractive.
Valuation on the latest reported figures
| Metric | Value |
|---|---|
| Market cap | 6.73 bn USD |
| P/E (LTM) | 9.3 |
| EV/EBITDA (LTM) | 4.2 |
| P/B | 1.12 |
| Net debt / EBITDA (LTM) | 1.54 |
| Operating cash flow (LTM) | 2.48 bn |
| ROE | 27.1% |
| Dividend yield (12m) | 2.8% |
| EV/EBITDA, 3-year average | 4.4 |
Bottom line
The quarter's strength was 10% production growth and the recovery of gas revenue to $162 million, which drove the revenue acceleration to 39.7%. But profit was held back by derivatives – a $160.2 million realised loss – and by interest expense rising to $80.0 million. Free cash flow of $287.6 million covers dividends and debt repayment, but the 2.8% dividend yield is thin and the 4.2 multiple offers no discount to its own history. The verdict is neutral: the share is fairly valued at current commodity prices, and a re-rating needs either sustained price strength or further debt reduction.
Open the company's financial profile MTDR →
See also: market overview · valuation map · stock screeners