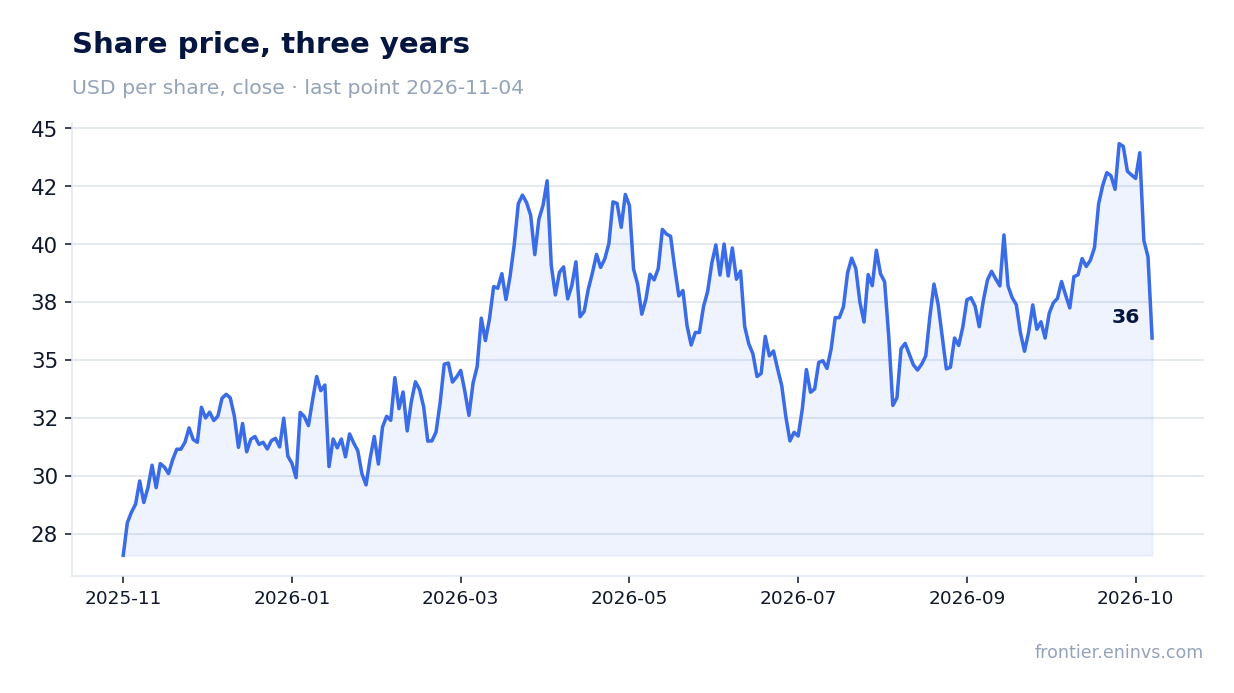
Murphy Oil: profit up 58-fold, yet the stock fell 8.9% — the market is looking at free cash flow
On 4 November Murphy Oil Corporation reported third-quarter 2026 results: revenue of $849.2 million (+16.8% year on year), EBITDA of $527.9 million (+32.5%), and net income of $171.1 million against a $3.0 million loss a year earlier. Free cash flow was only $48.2 million on capital spending of $422.2 million, and the stock lost 8.9% on the release day. At an EV/EBITDA of 3.8 versus its own three-year average of 4.4 the share is cheaper than its history, but the portal's model implies minus 32% to fair value — a neutral verdict.
Key takeaways
— Revenue rose 16.8%, but growth decelerated from 35.3% a quarter earlier
— The 62.2% EBITDA margin rose from 54.8% off a low operating base last year
— Net income of $171.1 million versus a $3.0 million loss a year earlier — a low-base effect
— Free cash flow of $48.2 million on $422.2 million of capex — cash is going into construction
— Net debt of $1.8 billion and 0.94x EBITDA — moderate leverage
— The $0.35 per-share dividend yields 3.8%
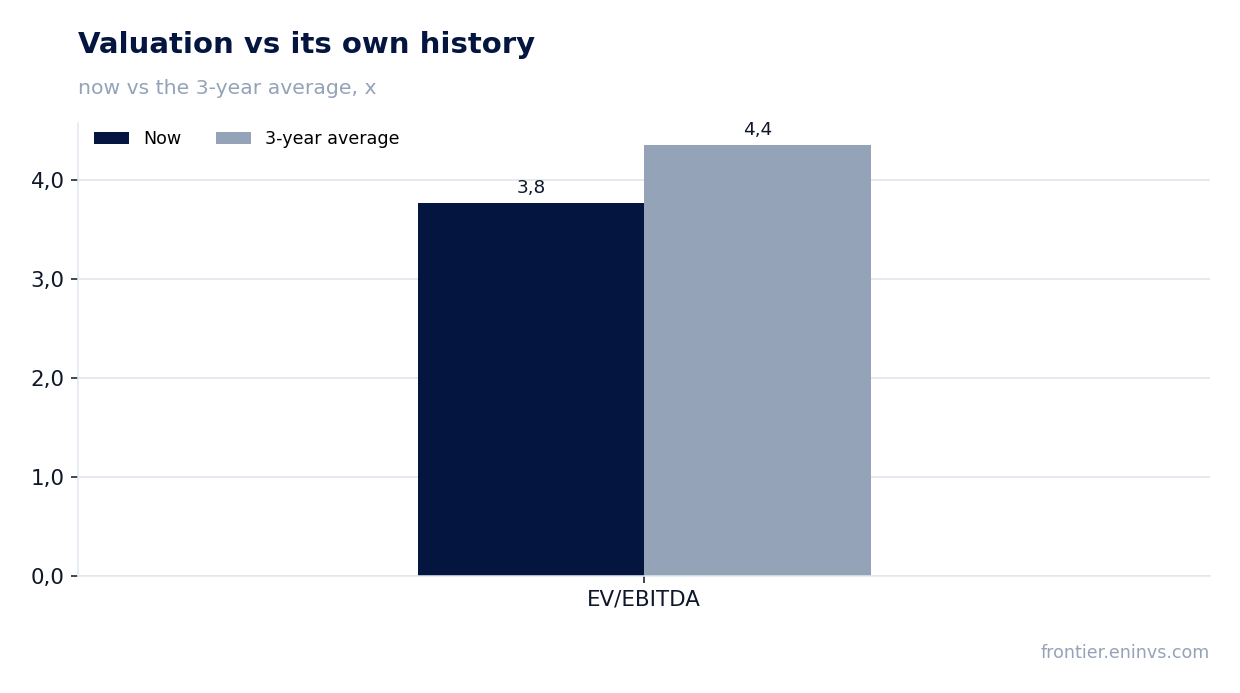
— EV/EBITDA of 3.8 is below its own three-year average of 4.4
Attractiveness
Key figures, USD bn
| Metric | Q3 2025 | Q3 2026 | Change |
|---|---|---|---|
| Revenue | 0.73 | 0.85 | +16.8% |
| EBITDA | 0.40 | 0.53 | +32.5% |
| Operating profit | 0.00 | 0.26 | +361145.1% |
| Net profit | -0.00 | 0.17 | to profit |
| Operating cash flow | 0.34 | 0.54 | +59.2% |
| Capex | 0.15 | — | — |
| EBITDA margin | 54.8% | 62.2% | +7.4 pp |
| Net margin | -0.4% | 20.2% | +20.6 pp |
Revenue rose 16.8%, but growth decelerated from 35.3% a quarter earlier
Third-quarter 2026 revenue was $849.2 million, 16.8% more than a year earlier. That is a marked deceleration from the second quarter, when growth reached 35.3%: revenue was $926.3 million then and $849.2 million now.
The US segment did the heavy lifting: US revenue was $681.7 million against $613.7 million a year earlier, while Canada rose to $169.5 million from $108.0 million. Production, however, fell to 186.5 thousand barrels of oil equivalent per day from 200.4 thousand a year earlier, so prices, not volumes, carried revenue.
The average US offshore oil price rose to $89.38 per barrel from $67.00, and Canadian offshore to $108.21 from $69.42. The company raised full-year production guidance to 176,000–178,000 barrels per day, 6,000 above the midpoint of the previous range.
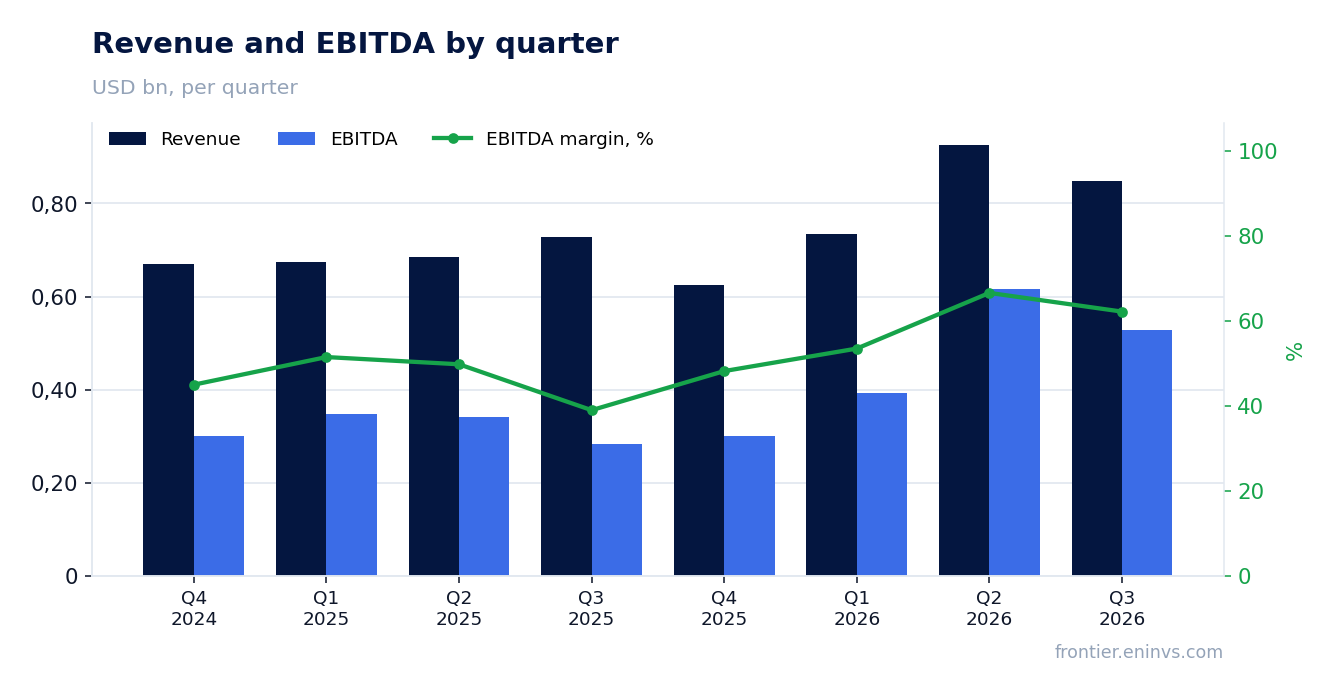
The 62.2% EBITDA margin rose from 54.8% off a low operating base last year
Third-quarter EBITDA was $527.9 million, 32.5% more than a year earlier, and the margin rose to 62.2% from 54.8%. The margin gain came primarily from lower costs: lease operating expenses fell to $149.2 million from $184.4 million, and transportation costs to $47.0 million from $48.1 million.
A year earlier the base included a $115.0 million asset impairment that weighed on operating profit. There is no such impairment now, and operating profit was $256.5 million against $5.8 million a year earlier — the comparison against that base flatters the visible growth.
Exploration expenses rose to $33.1 million from $32.5 million, and selling and general expenses to $40.5 million from $30.9 million. Part of the operating cost saving was thus eaten by higher corporate costs.
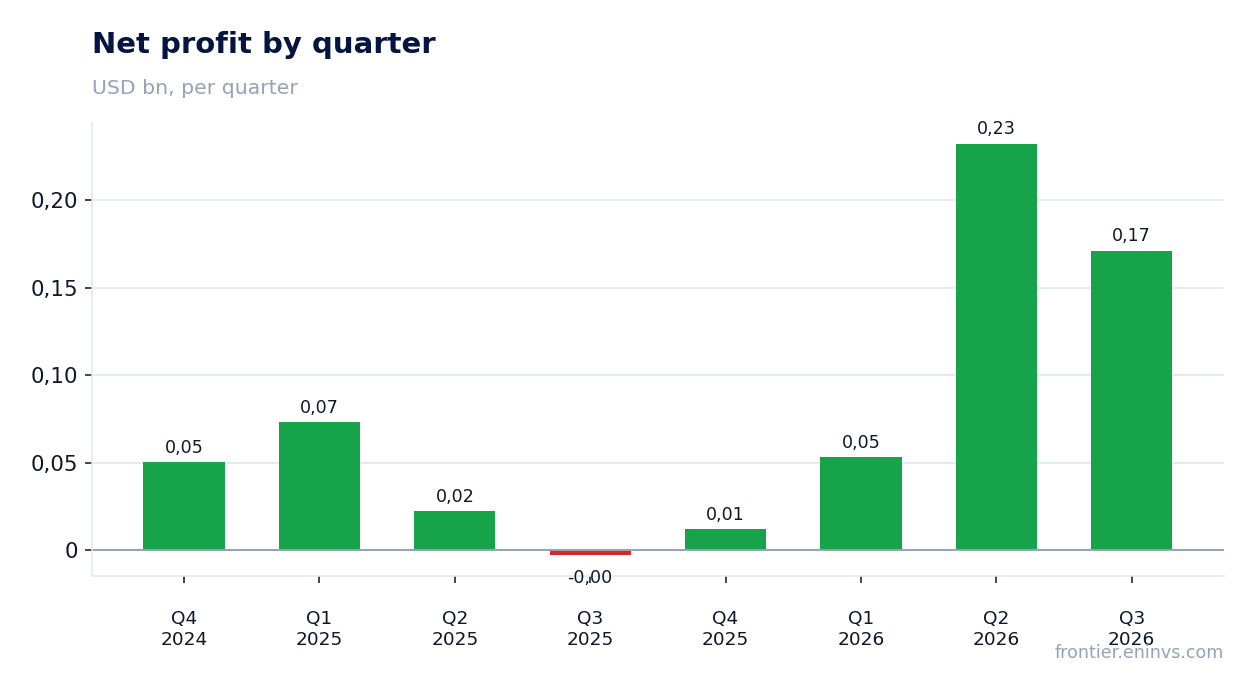
Net income of $171.1 million versus a $3.0 million loss a year earlier — a low-base effect
Net income attributable to Murphy shareholders was $171.1 million, or $1.17 per diluted share, against a $3.0 million loss a year earlier. The net margin rose to 20.2% from minus 0.4%.
There are one-off items inside the profit: the company's adjusted net income was $158.4 million, or $1.08 per share, so adjustments account for about $12.7 million. The main one is an $11.8 million tax benefit on foreign investments.
Pre-tax income was $235.1 million and the tax charge $39.4 million. Profit was weighed on by $24.2 million of net interest expense, little changed from $24.7 million a year earlier.
Free cash flow of $48.2 million on $422.2 million of capex — cash is going into construction
Operating cash flow was $540.5 million against $339.4 million a year earlier, but capital spending rose to $422.2 million from $186.9 million. As a result free cash flow shrank to $48.2 million from $218.8 million a year earlier, and adjusted free cash flow went to minus $8.4 million.
The capex increase is development-driven: in the third quarter the company achieved first oil at the Lac Da Vang project in Vietnam and brought on the Chinook #8 well in the Gulf of America. For the nine months, capex was $1,363.2 million against $840.6 million a year earlier.
The company reaffirmed full-year capex guidance of $1.5–1.6 billion, so spending stays high in the fourth quarter. It is the weak free cash flow, not profit, that explains the 8.9% drop in the share on the release day.
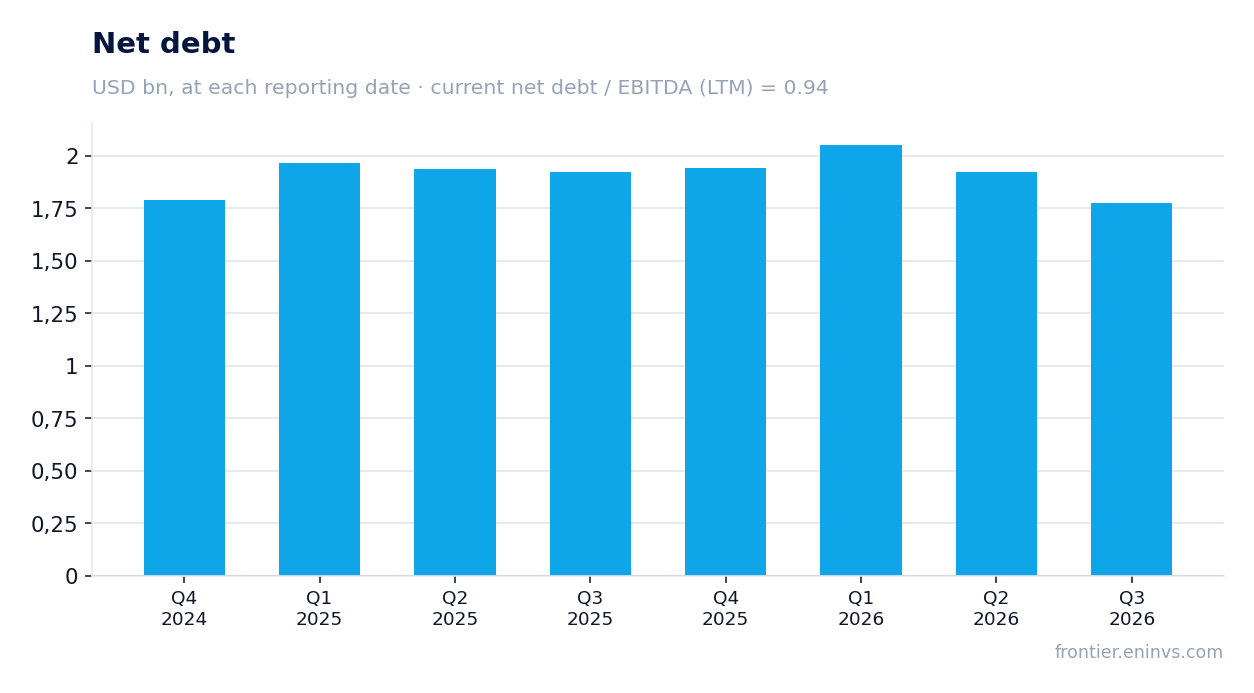
Net debt of $1.8 billion and 0.94x EBITDA — moderate leverage
Net debt at 30 September 2026 was $1.8 billion against $1.9 billion at 30 June 2026 and $1.9 billion at 30 September 2025. The ratio of net debt to trailing-twelve-month EBITDA is 0.94, meaning debt is below annual EBITDA.
Total debt is $1.63 billion, of which $1.54 billion is long-term notes with an average maturity of 8.4 years and an average coupon of 6.3%. The $80 million quarterly increase reflects recognition of the finance lease for the Lac Da Vang floating storage vessel in Vietnam through 2039.
Liquidity is about $2.50 billion: an undrawn $2.00 billion credit facility and about $500 million of cash. With $24.2 million of quarterly interest expense, debt service does not pressure profit.
The $0.35 per-share dividend yields 3.8%
For the third quarter of 2026 the company paid $50.2 million of dividends, or $0.35 per share. For the nine months, payments were $150.5 million, or $1.05 per share, against $0.975 a year earlier.
At the pre-release share price of $39.46, the trailing-twelve-month dividend yield is 3.8%. Payments are covered by operating cash flow of $540.5 million, but with free cash flow of $48.2 million the dividend is funded mainly from working capital and borrowings.
The company did not repurchase shares in the third quarter, retaining $550 million under its authorised buyback programme. If capex stays at $1.5–1.6 billion, the dividend will compete with construction for cash, and its growth is in question.
EV/EBITDA of 3.8 is below its own three-year average of 4.4
The trailing-twelve-month EV/EBITDA multiple is 3.8 against its own three-year average of 4.4, 14% below its history. On this multiple the share is cheaper than it has typically been over the past three years.
The trailing-twelve-month P/E is 11.0, market capitalisation is $5,155 million, and trailing-twelve-month net income is $468.2 million. Return on equity is 12.9%.
The portal's model, repricing EBITDA at current commodity prices at the target EV/EBITDA, implies minus 32% to fair value. Even at a cheap multiple relative to history, the market is pricing in the risk of lower oil prices and weak free cash flow.
Valuation on the latest reported figures
| Metric | Value |
|---|---|
| Market cap | 5.15 bn USD |
| P/E (LTM) | 11.0 |
| EV/EBITDA (LTM) | 3.8 |
| P/B | 0.98 |
| Net debt / EBITDA (LTM) | 0.94 |
| Operating cash flow (LTM) | 1.77 bn |
| ROE | 12.9% |
| Dividend yield (12m) | 3.8% |
| EV/EBITDA, 3-year average | 4.4 |
Bottom line
What was genuinely strong in the report was everything tied to oil prices and cost reduction: revenue rose 16.8%, EBITDA 32.5%, the margin climbed to 62.2%, and net income reached $171.1 million. But the comparison is against a base that included a $115.0 million impairment, and free cash flow shrank to $48.2 million because of $422.2 million of capex. The real question for a holder is whether the company can fund both the dividend and construction at an oil price below today's. The 3.8 multiple against a 4.4 history says the market is already pricing that risk, but the portal's model implies minus 32%, so the verdict is neutral.
Open the company's financial profile MUR →
See also: market overview · valuation map · stock screeners